Estimated zip code population in 2022: 48,506 Zip code population in 2010: 47,618 Zip code population in 2000: 49,003
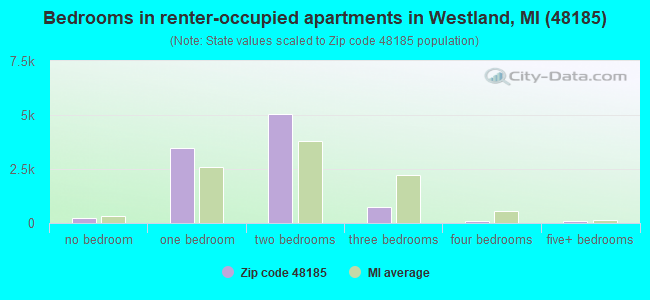
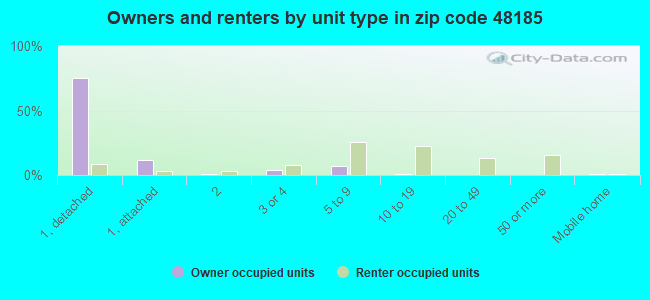
Houses and condos: 23,538 Renter-occupied apartments: 9,546
% of renters here:
43%
State:
27%
March 2022 cost of living index in zip code 48185: 96.1 (near average, U.S. average is 100)
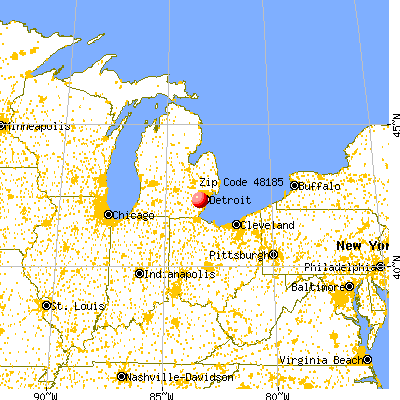
Land area: 12.2 sq. mi. Water area: 0.0 sq. mi.
Population density: 3,987 people per square mile
(average).
OSM Map
General Map
Google Map
MSN Map
OSM Map
General Map
Google Map
MSN Map
OSM Map
General Map
Google Map
MSN Map
OSM Map
General Map
Google Map
MSN Map
Please wait while loading the map...
Real estate property taxes paid for housing units in 2022:
This zip code:
1.4% ($2,633)
Michigan:
1.2% ($2,746)
Median real estate property taxes paid for housing units with mortgages in 2022: $2,698 (1.4%) Median real estate property taxes paid for housing units with no mortgage in 2022: $2,553 (1.4%)
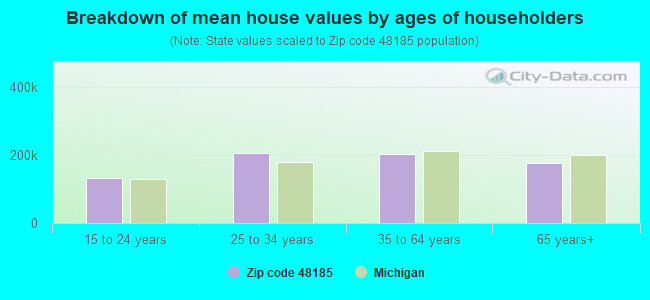
Estimated median house/condo value in 2022: $192,040
48185:
$192,040
Michigan:
$224,400
According to our research of Michigan and other state lists, there were 64 registered sex offenders living in 48185 zip code as of April 26, 2024. The ratio of all residents to sex offenders in zip code 48185 is 761 to 1. The ratio of registered sex offenders to all residents in this zip code is much lower than the state average.
Median resident age:
This zip code:
39.4 years
Michigan median age:
40.3 years
Average household size:
This zip code:
2.2 people
Michigan:
2.4 people
Averages for the 2020 tax year for zip code 48185, filed in 2021:
Average Adjusted Gross Income (AGI) in 2020: $48,132 (Individual Income Tax Returns)
Here:
$48,132
State:
$68,945
Salary/wage: $45,809 (reported on 79.0% of returns)
Here:
$45,809
State:
$57,142
(% of AGI for various income ranges: 1004.2% for AGIs below $25k, 3380.0% for AGIs $25k-50k, 6526.3% for AGIs $50k-75k, 9331.4% for AGIs $75k-100k, 16608.3% for AGIs $100k-200k, 70923.8% for AGIs over 200k)
Taxable interest for individuals: $781 (reported on 24.4% of returns)
This zip code:
$781
Michigan:
$1,630
(% of AGI for various income ranges: 12.7% for AGIs below $25k, 14.0% for AGIs $25k-50k, 30.1% for AGIs $50k-75k, 44.1% for AGIs $75k-100k, 66.5% for AGIs $100k-200k, 787.5% for AGIs over 200k)
Ordinary dividends: $2,168 (reported on 12.9% of returns)
Here:
$2,168
State:
$6,972
(% of AGI for various income ranges: 16.0% for AGIs below $25k, 21.6% for AGIs $25k-50k, 48.4% for AGIs $50k-75k, 72.3% for AGIs $75k-100k, 111.3% for AGIs $100k-200k, 667.5% for AGIs over 200k)
Net capital gain/loss in AGI: +$4,241 (reported on 11.5% of returns)
Here:
+$4,241
State:
+$20,064
(% of AGI for various income ranges: 4.9% for AGIs below $25k, 14.2% for AGIs $25k-50k, 40.4% for AGIs $50k-75k, 114.1% for AGIs $75k-100k, 267.2% for AGIs $100k-200k, 5427.5% for AGIs over 200k)
Profit/loss from business: +$4,229 (reported on 14.5% of returns)
Here:
+$4,229
State:
+$11,172
(% of AGI for various income ranges: 51.7% for AGIs below $25k, 61.7% for AGIs $25k-50k, 67.5% for AGIs $50k-75k, 105.6% for AGIs $75k-100k, 221.0% for AGIs $100k-200k, 2085.0% for AGIs over 200k)
Taxable individual retirement arrangement distribution: $13,068 (reported on 7.8% of returns)
48185:
$13,068
Michigan:
$19,803
(% of AGI for various income ranges: 61.0% for AGIs below $25k, 79.4% for AGIs $25k-50k, 155.0% for AGIs $50k-75k, 263.6% for AGIs $75k-100k, 393.5% for AGIs $100k-200k, 3343.8% for AGIs over 200k)
Total itemized deductions: $23,768 (reported on 4.3% of returns)
Here:
$23,768
State:
$34,117
(% of AGI for various income ranges: 26.8% for AGIs below $25k, 78.4% for AGIs $25k-50k, 176.6% for AGIs $50k-75k, 282.0% for AGIs $75k-100k, 524.0% for AGIs $100k-200k, 2235.0% for AGIs over 200k)
Charity contributions: $7,850 (reported on 3.3% of returns)
Here:
$7,850
State:
$13,548
(% of AGI for various income ranges: 2.1% for AGIs below $25k, 15.9% for AGIs $25k-50k, 40.8% for AGIs $50k-75k, 69.7% for AGIs $75k-100k, 159.0% for AGIs $100k-200k, 983.8% for AGIs over 200k)
Taxes paid: $6,702 (reported on 4.3% of returns)
48185:
$6,702
State:
$7,972
(% of AGI for various income ranges: 4.4% for AGIs below $25k, 17.0% for AGIs $25k-50k, 53.4% for AGIs $50k-75k, 88.4% for AGIs $75k-100k, 165.3% for AGIs $100k-200k, 611.2% for AGIs over 200k)
Earned income credit: $2,041 (reported on 14.7% of returns)
Here:
$2,041
State:
$2,251
(% of AGI for various income ranges: 69.3% for AGIs below $25k, 55.5% for AGIs $25k-50k, 0.7% for AGIs $50k-75k)
Percentage of individuals using paid preparers for their 2020 taxes: 93.0%
Here:
93%
State:
93%
(% for various income ranges: 92.4% for AGIs below $25k, 93.6% for AGIs $25k-50k, 92.9% for AGIs $50k-75k, 93.8% for AGIs $75k-100k, 93.4% for AGIs $100k-200k, 92.0% for AGIs over 200k)
Averages for the 2012 tax year for zip code 48185, filed in 2013:
Average Adjusted Gross Income (AGI) in 2012: $38,759 (Individual Income Tax Returns)
Here:
$38,759
State:
$55,609
Salary/wage: $36,680 (reported on 81.6% of returns)
Here:
$36,680
State:
$46,782
(% of AGI for various income ranges: 69.0% for AGIs below $25k, 77.5% for AGIs $25k-50k, 78.3% for AGIs $50k-75k, 81.6% for AGIs $75k-100k, 82.8% for AGIs $100k-200k, 55.6% for AGIs over 200k)
Taxable interest for individuals: $779 (reported on 28.2% of returns)
This zip code:
$779
Michigan:
$1,491
(% of AGI for various income ranges: 0.9% for AGIs below $25k, 0.5% for AGIs $25k-50k, 0.5% for AGIs $50k-75k, 0.5% for AGIs $75k-100k, 0.4% for AGIs $100k-200k, 1.6% for AGIs over 200k)
Ordinary dividends: $2,008 (reported on 14.4% of returns)
Here:
$2,008
State:
$6,225
(% of AGI for various income ranges: 1.1% for AGIs below $25k, 0.7% for AGIs $25k-50k, 0.6% for AGIs $50k-75k, 0.6% for AGIs $75k-100k, 0.6% for AGIs $100k-200k, 1.9% for AGIs over 200k)
Net capital gain/loss in AGI: +$752 (reported on 9.8% of returns)
Here:
+$752
State:
+$9,326
(% of AGI for various income ranges: 0.2% for AGIs $50k-75k, 0.2% for AGIs $75k-100k, 0.5% for AGIs $100k-200k, 0.9% for AGIs over 200k)
Profit/loss from business: +$7,060 (reported on 11.2% of returns)
Here:
+$7,060
State:
+$11,523
(% of AGI for various income ranges: 6.2% for AGIs below $25k, 1.7% for AGIs $25k-50k, 1.0% for AGIs $50k-75k, 1.0% for AGIs $75k-100k, 1.2% for AGIs $100k-200k, 3.2% for AGIs over 200k)
Taxable individual retirement arrangement distribution: $10,465 (reported on 9.6% of returns)
48185:
$10,465
Michigan:
$15,298
(% of AGI for various income ranges: 3.0% for AGIs below $25k, 2.3% for AGIs $25k-50k, 2.6% for AGIs $50k-75k, 2.6% for AGIs $75k-100k, 3.2% for AGIs $100k-200k)
Self-employment retirement plans: $7,767 (reported on 0.1% of returns)
48185:
$7,767
Michigan:
$20,834
Total itemized deductions: $15,893 (22% of AGI, reported on 23.4% of returns)
Here:
$15,893
State:
$21,628
Here:
22.1% of AGI
State:
18.4% of AGI
(% of AGI for various income ranges: 6.5% for AGIs below $25k, 7.5% for AGIs $25k-50k, 9.8% for AGIs $50k-75k, 10.7% for AGIs $75k-100k, 12.4% for AGIs $100k-200k, 14.3% for AGIs over 200k)
Charity contributions: $2,648 (reported on 19.4% of returns)
Here:
$2,648
State:
$4,225
(% of AGI for various income ranges: 0.7% for AGIs below $25k, 1.1% for AGIs $25k-50k, 1.4% for AGIs $50k-75k, 1.5% for AGIs $75k-100k, 1.9% for AGIs $100k-200k, 1.6% for AGIs over 200k)
Taxes paid: $5,226 (reported on 23.2% of returns)
48185:
$5,226
State:
$8,327
(% of AGI for various income ranges: 1.4% for AGIs below $25k, 2.0% for AGIs $25k-50k, 3.1% for AGIs $50k-75k, 3.8% for AGIs $75k-100k, 5.0% for AGIs $100k-200k, 5.1% for AGIs over 200k)
Earned income credit: $2,144 (reported on 19.5% of returns)
Here:
$2,144
State:
$2,306
(% of AGI for various income ranges: 5.8% for AGIs below $25k, 0.9% for AGIs $25k-50k)
Percentage of individuals using paid preparers for their 2012 taxes: 54.4%
Here:
54%
State:
57%
(% for various income ranges: 52.3% for AGIs below $25k, 54.5% for AGIs $25k-50k, 56.9% for AGIs $50k-75k, 57.1% for AGIs $75k-100k, 59.1% for AGIs $100k-200k, 75.0% for AGIs over 200k)
Averages for the 2004 tax year for zip code 48185, filed in 2005:
Average Adjusted Gross Income (AGI) in 2004: $38,799 (Individual Income Tax Returns)
Here:
$38,799
State:
$48,204
Salary/wage: $38,136 (reported on 83.8% of returns)
Here:
$38,136
State:
$42,791
(% of AGI for various income ranges: 78.1% for AGIs below $10k, 67.0% for AGIs $10k-25k, 81.2% for AGIs $25k-50k, 85.4% for AGIs $50k-75k, 87.7% for AGIs $75k-100k, 83.9% for AGIs over 100k)
Taxable interest for individuals: $1,026 (reported on 47.0% of returns)
This zip code:
$1,026
Michigan:
$1,725
(% of AGI for various income ranges: 5.6% for AGIs below $10k, 2.7% for AGIs $10k-25k, 1.1% for AGIs $25k-50k, 1.1% for AGIs $50k-75k, 0.8% for AGIs $75k-100k, 0.8% for AGIs over 100k)
Taxable dividends: $1,396 (reported on 22.3% of returns)
Here:
$1,396
State:
$3,420
(% of AGI for various income ranges: 3.2% for AGIs below $10k, 1.4% for AGIs $10k-25k, 0.8% for AGIs $25k-50k, 0.6% for AGIs $50k-75k, 0.6% for AGIs $75k-100k, 0.7% for AGIs over 100k)
Net capital gain/loss: +$1,351 (reported on 14.9% of returns)
Here:
+$1,351
State:
+$8,532
(% of AGI for various income ranges: -2.2% for AGIs below $10k, -0.0% for AGIs $10k-25k, 0.1% for AGIs $25k-50k, 0.2% for AGIs $50k-75k, 0.3% for AGIs $75k-100k, 2.4% for AGIs over 100k)
Profit/loss from business: +$7,092 (reported on 9.1% of returns)
Here:
+$7,092
State:
+$9,547
(% of AGI for various income ranges: 6.4% for AGIs below $10k, 3.9% for AGIs $10k-25k, 1.5% for AGIs $25k-50k, 0.9% for AGIs $50k-75k, 1.1% for AGIs $75k-100k, 1.7% for AGIs over 100k)
IRA payment deduction: $2,478 (reported on 1.8% of returns)
48185:
$2,478
Michigan:
$2,875
(% of AGI for various income ranges: 0.1% for AGIs below $10k, 0.2% for AGIs $10k-25k, 0.2% for AGIs $25k-50k, 0.1% for AGIs $50k-75k, 0.1% for AGIs $75k-100k, 0.1% for AGIs over 100k)
Self-employed pension: $6,780 (reported on 0.2% of returns)
Here:
$6,780
Michigan:
$13,826
(% of AGI for various income ranges: 0.1% for AGIs $10k-25k, 0.1% for AGIs $50k-75k, 0.1% for AGIs over 100k)
Total itemized deductions: $15,414 (24% of AGI, reported on 34.2% of returns)
Here:
$15,414
State:
$18,509
Here:
24.1% of AGI
State:
20.7% of AGI
(% of AGI for various income ranges: 12.0% for AGIs below $10k, 8.5% for AGIs $10k-25k, 13.9% for AGIs $25k-50k, 14.2% for AGIs $50k-75k, 14.7% for AGIs $75k-100k, 14.3% for AGIs over 100k)
Charity contributions deductions: $2,130 (3% of AGI, reported on 30.8% of returns)
Here:
$2,130
State:
$3,365
Here:
3.2% of AGI
State:
3.6% of AGI
(% of AGI for various income ranges: 0.6% for AGIs below $10k, 1.0% for AGIs $10k-25k, 1.4% for AGIs $25k-50k, 1.8% for AGIs $50k-75k, 2.0% for AGIs $75k-100k, 2.2% for AGIs over 100k)
Total tax: $4,742 (reported on 78.1% of returns)
48185:
$4,742
State:
$7,691
(% of AGI for various income ranges: 2.3% for AGIs below $10k, 4.2% for AGIs $10k-25k, 7.6% for AGIs $25k-50k, 9.7% for AGIs $50k-75k, 10.9% for AGIs $75k-100k, 14.8% for AGIs over 100k)
Earned income credit: $1,577 (reported on 11.8% of returns)
Here:
$1,577
State:
$1,737
Percentage of individuals using paid preparers for their 2004 taxes: 58.3%
Here:
58%
State:
60%
(% for various income ranges: 54.7% for AGIs below $10k, 60.4% for AGIs $10k-25k, 57.4% for AGIs $25k-50k, 58.9% for AGIs $50k-75k, 60.9% for AGIs $75k-100k, 60.3% for AGIs over 100k)
Likely homosexual households (counted as self-reported same-sex unmarried-partner households)
Lesbian couples: 0.1% of all households
Gay men: 0.0% of all households
Household received Food Stamps/SNAP in the past 12 months: 3,276 Household did not receive Food Stamps/SNAP in the past 12 months: 19,031
Women who had a birth in the past 12 months: 654 (548 now married, 113 unmarried) Women who did not have a birth in the past 12 months: 10,180 (3,323 now married, 6,873 unmarried)
Housing units in zip code 48185 with a mortgage: 7,723 (575 second mortgage, 492 both second mortgage and home equity loan) Houses without a mortgage: 267
Median monthly owner costs for units with a mortgage: $1,246 Median monthly owner costs for units without a mortgage: $546
Residents with income below the poverty level in 2022:
This zip code:
15.4%
Whole state:
13.4%
Residents with income below 50% of the poverty level in 2022:
This zip code:
5.3%
Whole state:
6.9%
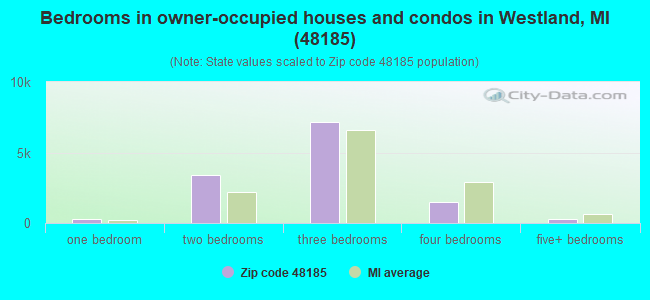
Median number of rooms in houses and condos:
Here:
5.5
State:
6.5
Median number of rooms in apartments:
Here:
3.8
State:
4.3
Notable locations in this zip code not listed on our city pages
Notable locations in zip code 48185: Hawthorne Valley Golf Course (A), Wayne District Courthouse (B), Westland City Hall (C), Westland Library (D), Henry Ford Medical Center - Westland (E), Oakwood Healthcare Center - North Westland (F), Westland Fire Prevention Division (G), Westland Fire Department Station 1 Headquarters (H), Westland Fire Department Station 2 (I). Display/hide their locations on the map
Shopping Centers: Merri-Warren Plaza Shopping Center (1), Joyand Merriman Shopping Center (2), Chatham Center Shopping Center (3), Central City Plaza Shopping Center (4), Arbor Town Square Shopping Center (5), ACO Center Shopping Center (6), Farmer Jack Plaza Shopping Center (7), Westland Crossings Shopping Center (8). Display/hide their locations on the map
Churches in zip code 48185 include: Holy Cross Church (A), Kirk of Our Savior (B), Saint Theodore Church (C), Mount Olive Church (D). Display/hide their locations on the map
Parks in zip code 48185 include: Chief Tonquish Burial Site Historical Marker (1), Cooper School Historical Marker (2), Nankin Mills Historical Marker (3), Nankin Township School District Number Three Historical Marker (4), Perrinsville Historical Marker (5), Perrinsville School Historical Marker (6), Central City Park (7), Tattan Park (8), Samuel Corrado Park (9). Display/hide their locations on the map
4,881 married couples with children.
3,338 single-parent households (903 men, 2,435 women).
86.0% of residents of 48185 zip code speak English at home.
2.8% of residents speak Spanish at home (60% very well, 25% well, 8% not well, 7% not at all).
4.3% of residents speak other Indo-European language at home (49% very well, 33% well, 11% not well, 7% not at all).
3.0% of residents speak Asian or Pacific Island language at home (63% very well, 28% well, 8% not well, 1% not at all).
3.8% of residents speak other language at home (49% very well, 43% well, 8% not well).
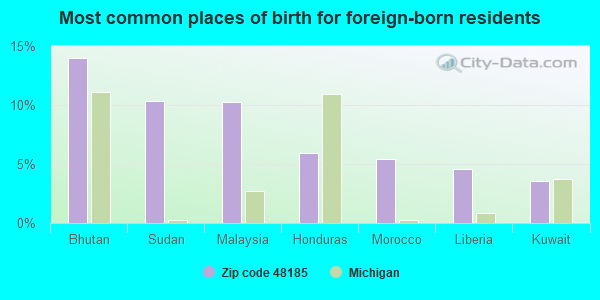
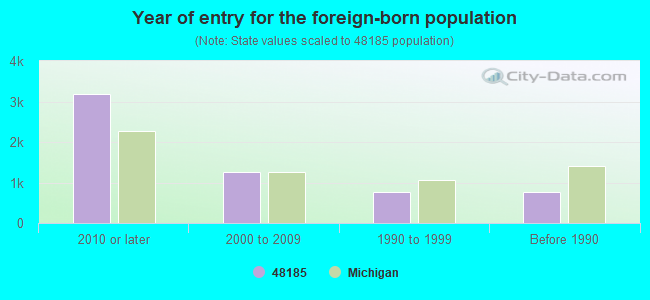
Foreign born population: 5,439 (11.2%) (45.2% of them are naturalized citizens)
Major facilities with environmental interests located in this zip code:
ADAMS MIDDLE SCHOOL (33475 PALMER ROAD in WESTLAND, MI)
(National Center for Education Statistics) - STATE ID-00017 (Resource Conservation and Recovery Act (tracking hazardous waste)) Organizations: WAYNE WESTLAND COMMUNITY SCHOOLS (CONTACT/OPERATOR)
, WAYNE-WESTLAND COMMUNITY SCHOOL DISTRICT (SCHOOL DISTRICT)
Alternative names: ADAMS JUNIOR HIGH SCHOOL
EUGENE B. ELLIOTT ELEM. SCHOOL (30800 BENNINGTON in WESTLAND, MI)
(National Center for Education Statistics) - STATE ID-01111 Conditionally Exempt Small Quantity Generators, less than 100 kg/month of hazardous waste (Resource Conservation and Recovery Act (tracking hazardous waste)) Organizations: WAYNE WESTLAND COMMUNITY SCHOOLS (CONTACT/OPERATOR)
, WAYNE-WESTLAND COMMUNITY SCHOOL DISTRICT (SCHOOL DISTRICT)
Alternative names: ELLIOT ELEMENTARY SCHOOL, ELLIOTT ELEMENTARY SCHOOL
ALBERT SCHWEITZER ELEMENTARY SCHOOL (2601 TREADWELL in WESTLAND, MI)
(National Center for Education Statistics) - STATE ID-00043 Conditionally Exempt Small Quantity Generators, less than 100 kg/month of hazardous waste (Resource Conservation and Recovery Act (tracking hazardous waste)) Organizations: WAYNE WESTLAND COMMTY SCH00LS (CONTACT/OPERATOR)
, WAYNE-WESTLAND COMMUNITY SCHOOL DISTRICT (SCHOOL DISTRICT)
Alternative names: SCHWEITZER ELEMENTARY SCHL
BILLS AUTO SERVICE (35522 FORD ROAD in WESTLAND, MI)
AIR MINOR (AIRS/AFS) (Integrated Compliance Information System) - ICIS-05-2001-0618, FORMAL ENFORCEMENT ACTION Business SIC classification: AUTOMOTIVE REPAIR SHOPS
FEISTER OIL (5635 NEWBURGH ROAD in WESTLAND, MI)
(Resource Conservation and Recovery Act (tracking hazardous waste)) Organizations: FEISTER ROBERT (CONTACT/OPERATOR)
Alternative names: FEISTER BULK OIL SITE/MDEQ
AUTO COLLSIION EXPERTS (33000 FORD RD in WESTLAND, MI)
Conditionally Exempt Small Quantity Generators, less than 100 kg/month of hazardous waste (Resource Conservation and Recovery Act (tracking hazardous waste)) Organizations: TODD BLEVINS (CONTACT/OPERATOR)
, DONALD & MICHAEL LIPTAK (CONTACT/OWNER)
, LIPTAK ENTERPRISES (CONTACT/OWNER)
, COLLISION SERVICES INC (CONTACT/OWNER)
Alternative names: FORD ROAD COLLISION
AM CAR (5871 HIX in WESTLAND, MI)
(Resource Conservation and Recovery Act (tracking hazardous waste)) Business NAICS classification: CAR WASHES. Organizations: LONG TERENCE J (CONTACT/OWNER)
DETROIT NEWSPAPERS (6330 COMMERCE DR in WESTLAND, MI)
AMOCO OIL CO 5475 (34901 ANN ARBOR TRAIL in WESTLAND, MI)
(Resource Conservation and Recovery Act (tracking hazardous waste)) Organizations: AMOCO OIL COMPANY (CONTACT/OWNER)
ARROW TOOL REPAIR (38148 EXECUTIVE DRIVE in WESTLAND, MI)
(Resource Conservation and Recovery Act (tracking hazardous waste)) Organizations: MARK BORWUNIEWICZ (CONTACT/OWNER)
ARTHURS MICHIGAN GROUP (38664 WEBB DR in WESTLAND, MI)
(Resource Conservation and Recovery Act (tracking hazardous waste))
ADVANCED UNDERGROUND INSPECTION LLC (38657 WEBB DRIVE in WESTLAND, MI)
Conditionally Exempt Small Quantity Generators, less than 100 kg/month of hazardous waste (Resource Conservation and Recovery Act (tracking hazardous waste)) TRANSPORTER (Resource Conservation and Recovery Act (tracking hazardous waste)) Organizations: JEANA L GARCIA MOIR (CONTACT/OPERATOR)
AMERICAN GEAR AND ENGINEERING (38200 ABRUZZI in WESTLAND, MI)
Conditionally Exempt Small Quantity Generators, less than 100 kg/month of hazardous waste (Resource Conservation and Recovery Act (tracking hazardous waste)) Organizations: EMERSON JEFF AND CINGOLANI LOUIS (CONTACT/OWNER)
, JEFF EMERSON (CONTACT/OWNER)
Housing units lacking complete plumbing facilities: 1.0% Housing units lacking complete kitchen facilities: 0.8%
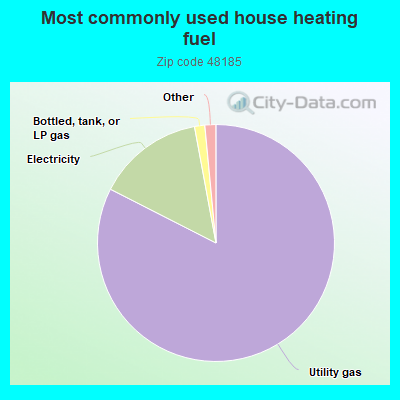
82.5%Utility gas
14.6%Electricity
1.4%Bottled, tank, or LP gas
0.8%Other fuel
0.6%No fuel used
Population in 1990: 84,712.
Place of birth for U.S.-born residents:
This state: 36,276
Northeast: 1,170
Midwest: 1,540
South: 2,824
West: 834
51% of the 48185 zip code residents lived in the same house 5 years ago. Out of people who lived in different houses, 74% lived in this county. Out of people who lived in different counties, 50% lived in Michigan.
90% of the 48185 zip code residents lived in the same house 1 year ago. Out of people who lived in different houses, 58% moved from this county. Out of people who lived in different houses, 28% moved from different county within same state. Out of people who lived in different houses, 10% moved from different state. Out of people who lived in different houses, 4% moved from abroad.
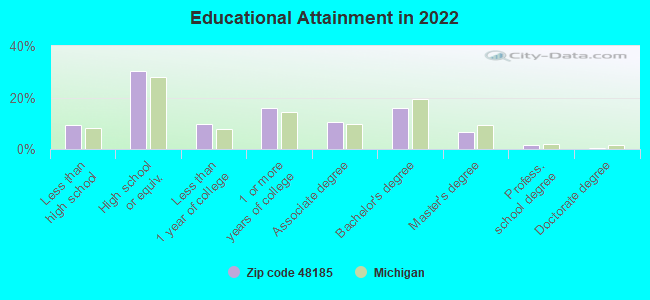
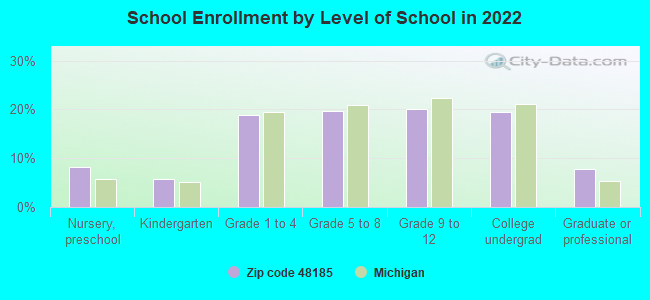
Private vs. public school enrollment:
Students in private schools in grades 1 to 8 (elementary and middle school): 98
Here:
2.9%
Michigan:
12.4%
Students in private schools in grades 9 to 12 (high school): 100
Here:
5.5%
Michigan:
9.8%
Students in private undergraduate colleges: 302
Here:
17.3%
Michigan:
14.9%
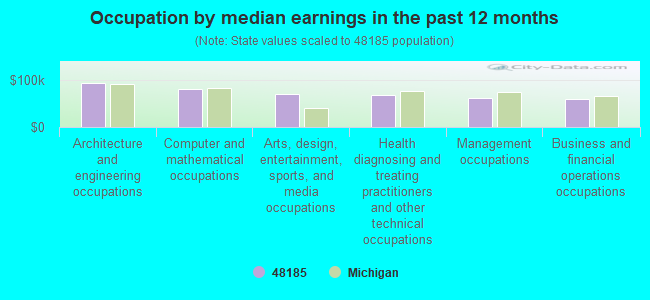
Occupation by median earnings in the past 12 months ($)
92,990Architecture and engineering occupations
80,518Computer and mathematical occupations
69,775Arts, design, entertainment, sports, and media occupations
67,146Health diagnosing and treating practitioners and other technical occupations
60,348Management occupations
59,236Business and financial operations occupations
Companies with federal contracts located in this zip code (WESTLAND, MI):
AERO MARINE INC (1517 N WAYNE RD; small business) : $708,665 in 7 contractsfrom 2000 to 2006
Contracts for Electrical Contact Brushes and Electrodes, Hand Tools, Edged, Nonpowered by Army Signed by year:2000: $262,690; 2001: $0; 2002: $0; 2003: $325,074; 2004: $6,400; 2005: -$384; 2006: $114,885.
Biggest contracts:
$164,510 with Army for Electrical Contact Brushes and Electrodes. Signed on 2003-07-30. Completion date: 2004-04-25.
$160,564 with Army for Hand Tools, Edged, Nonpowered. Signed on 2003-09-11. Completion date: 2004-10-07.
$154,240 with Army for Electrical Contact Brushes and Electrodes. Signed on 2000-08-17. Completion date: 2001-06-30.
$114,885, same as above.Signed on 2006-01-12. Completion date: 2006-10-18.
NEDERMAN INC (39115 W WARREN RD; small business) : $222,638 in 5 contractsfrom 2000 to 2003
Contracts for Gas Generating and Dispensing Systems, Fixed or Mobile, Safety and Rescue Equipment, Machine Tools, Portable, Maintenance, Repair or Alteration of Real Property -- Other Industrial Buildings by Air Force, Army Signed by year:2000: $211,673; 2001: $0; 2002: $0; 2003: $10,965; 2004: $0; 2005: $0; 2006: $0.
Biggest contracts:
$134,674 with Air Force for Gas Generating and Dispensing Systems, Fixed or Mobile. Signed on 2000-09-30. Completion date: 2000-11-10.
$71,999 with Air Force for Safety and Rescue Equipment. Taking place in FL. Signed on 2000-09-19. Completion date: 2000-09-18.
$11,058 with Army for Machine Tools, Portable. Signed on 2003-08-25. Completion date: 2003-09-22.
$5,000 with Army for Maintenance, Repair or Alteration of Real Property -- Other Industrial Buildings. Taking place in AK. Signed on 2000-08-14. Completion date: 2000-09-29.
HEALTH EMERGENCY MEDICAL (No data from D and B) 4 employees, $0 revenue
$99,000 with Office of Assistant Secretary for Health except national centers (disused code) for Other Professional Services. Signed on 2002-08-15. Completion date: 2003-07-15.
NC SERVO TECHNOLOGY (38422 WEBB DRIVE; small business)
$69,000 with Army for Aircraft Hydraulic, Vacuum, and De-icing System Components. Signed on 2003-02-04. Completion date: 1995-12-29.
J&K POWER SUPPLY LTD (38217 ABRUZZI DR; small business)
$58,500 with Navy for Converters, Electrical, Nonrotating. Signed on 2000-05-15. Completion date: 2000-08-21.
EFFECTIVE BUILDING SERVICES IN (34645 FORD RD; small business) : $46,288 in 7 contractsfrom 2003 to 2006
Contracts for Custodial Janitorial Services by Army Signed by year:2000: $0; 2001: $0; 2002: $0; 2003: $13,296; 2004: $13,824; 2005: $14,376; 2006: $4,792.
Biggest contracts:
$14,376 with Army for Custodial Janitorial Services. Signed on 2005-03-01. Completion date: 2006-02-28.
$13,824, same as above.Signed on 2004-03-01. Completion date: 2005-02-28.
$13,296, same as above.Signed on 2003-02-07. Completion date: 2003-02-28.
$3,594, same as above.Signed on 2006-02-02. Completion date: 2006-02-28.
DOWNRIVER REFRIGERATIONSUPPLY (38170 EXECUTIVE DR N; small business)
$2,747 with Army for Refrigeration Equipment. Signed on 2004-08-04. Completion date: 2004-08-16.
Top industries in this zip code by the number of employees in 2005:
2002 - 2018 National Fire Incident Reporting System (NFIRS) incidents
Based on the data from the years 2002 - 2018 the average number of fire incidents per year is 55. The highest number of fires - 160 took place in 2018, and the least - 0 in 2005. The data has a growing trend.
When looking into fire subcategories, the most incidents belonged to: Structure Fires (46.2%), and Outside Fires (32.2%).
Fire incident types reported to NFIRS in Zip Code 48185


 Nearest zip codes: 48150, 48186, 48135, 48184, 48154, 48141.


 Based on the data from the years 2002 - 2018 the average number of fire incidents per year is 55. The highest number of fires - 160 took place in 2018, and the least - 0 in 2005. The data has a growing trend.
 When looking into fire subcategories, the most incidents belonged to: Structure Fires (46.2%), and Outside Fires (32.2%).