Estimated zip code population in 2022: 36,098 Zip code population in 2010: 36,506 Zip code population in 2000: 37,995
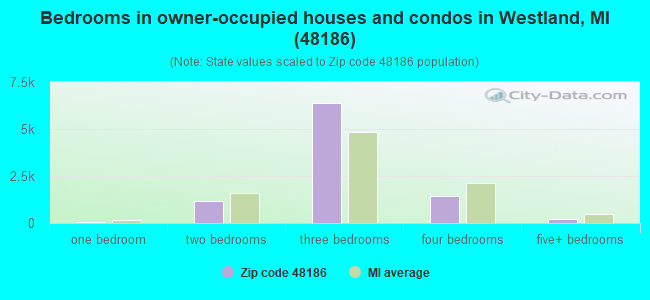
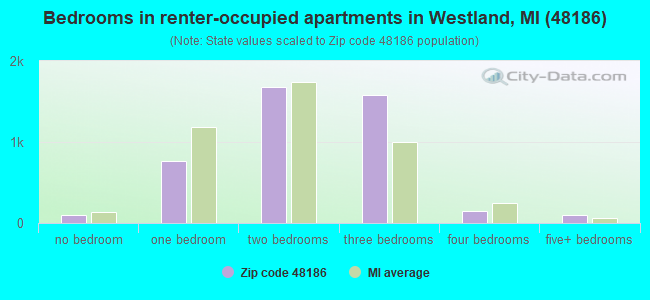
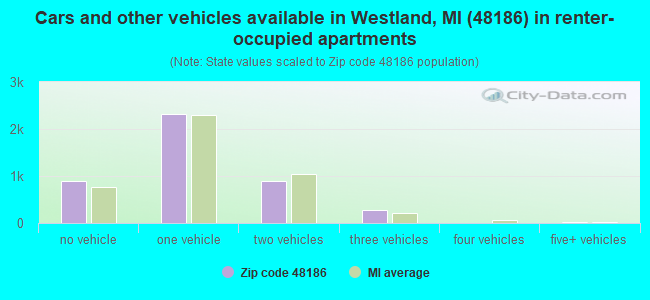
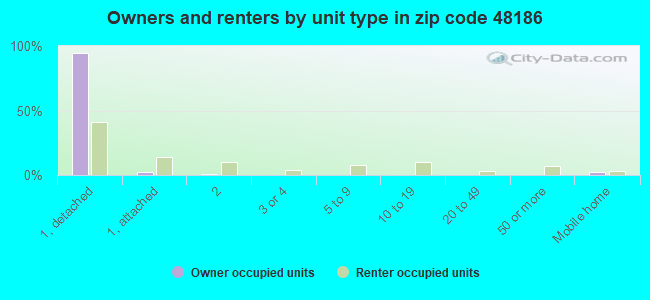
Houses and condos: 14,529 Renter-occupied apartments: 4,419
% of renters here:
32%
State:
27%
March 2022 cost of living index in zip code 48186: 95.3 (near average, U.S. average is 100)
Land area: 8.3 sq. mi. Water area: 0.0 sq. mi.
Population density: 4,371 people per square mile
(average).
OSM Map
General Map
Google Map
MSN Map
OSM Map
General Map
Google Map
MSN Map
OSM Map
General Map
Google Map
MSN Map
OSM Map
General Map
Google Map
MSN Map
Please wait while loading the map...
Real estate property taxes paid for housing units in 2022:
This zip code:
1.5% ($2,605)
Michigan:
1.2% ($2,746)
Median real estate property taxes paid for housing units with mortgages in 2022: $2,740 (1.5%) Median real estate property taxes paid for housing units with no mortgage in 2022: $2,374 (1.5%)
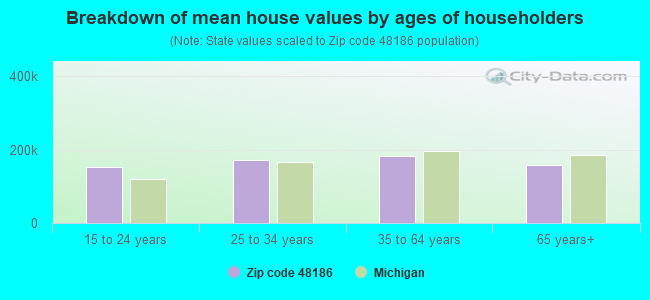
Estimated median house/condo value in 2022: $174,521
48186:
$174,521
Michigan:
$224,400
According to our research of Michigan and other state lists, there were 122 registered sex offenders living in 48186 zip code as of April 27, 2024. The ratio of all residents to sex offenders in zip code 48186 is 284 to 1. The ratio of registered sex offenders to all residents in this zip code is near the state average.
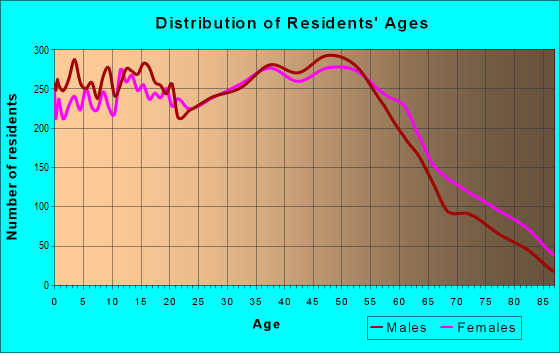
Median resident age:
This zip code:
37.8 years
Michigan median age:
40.3 years
Average household size:
This zip code:
2.6 people
Michigan:
2.4 people
Averages for the 2020 tax year for zip code 48186, filed in 2021:
Average Adjusted Gross Income (AGI) in 2020: $45,676 (Individual Income Tax Returns)
Here:
$45,676
State:
$68,945
Salary/wage: $42,966 (reported on 80.6% of returns)
Here:
$42,966
State:
$57,142
(% of AGI for various income ranges: 968.8% for AGIs below $25k, 3308.5% for AGIs $25k-50k, 6325.2% for AGIs $50k-75k, 9435.8% for AGIs $75k-100k, 16040.2% for AGIs $100k-200k, 46822.5% for AGIs over 200k)
Taxable interest for individuals: $571 (reported on 19.2% of returns)
This zip code:
$571
Michigan:
$1,630
(% of AGI for various income ranges: 7.5% for AGIs below $25k, 8.7% for AGIs $25k-50k, 18.5% for AGIs $50k-75k, 29.7% for AGIs $75k-100k, 33.2% for AGIs $100k-200k, 367.5% for AGIs over 200k)
Ordinary dividends: $1,652 (reported on 9.5% of returns)
Here:
$1,652
State:
$6,972
(% of AGI for various income ranges: 9.9% for AGIs below $25k, 11.9% for AGIs $25k-50k, 29.3% for AGIs $50k-75k, 37.6% for AGIs $75k-100k, 45.2% for AGIs $100k-200k, 745.0% for AGIs over 200k)
Net capital gain/loss in AGI: +$3,534 (reported on 8.3% of returns)
Here:
+$3,534
State:
+$20,064
(% of AGI for various income ranges: 3.7% for AGIs below $25k, 10.3% for AGIs $25k-50k, 41.6% for AGIs $50k-75k, 55.3% for AGIs $75k-100k, 195.5% for AGIs $100k-200k, 2780.0% for AGIs over 200k)
Profit/loss from business: +$4,129 (reported on 13.1% of returns)
Here:
+$4,129
State:
+$11,172
(% of AGI for various income ranges: 64.5% for AGIs below $25k, 42.4% for AGIs $25k-50k, 76.6% for AGIs $50k-75k, 117.9% for AGIs $75k-100k, 187.1% for AGIs $100k-200k)
Taxable individual retirement arrangement distribution: $12,723 (reported on 6.1% of returns)
48186:
$12,723
Michigan:
$19,803
(% of AGI for various income ranges: 35.2% for AGIs below $25k, 56.5% for AGIs $25k-50k, 115.0% for AGIs $50k-75k, 202.0% for AGIs $75k-100k, 494.5% for AGIs $100k-200k)
Total itemized deductions: $24,289 (reported on 4.0% of returns)
Here:
$24,289
State:
$34,117
(% of AGI for various income ranges: 20.9% for AGIs below $25k, 68.9% for AGIs $25k-50k, 164.9% for AGIs $50k-75k, 259.6% for AGIs $75k-100k, 471.6% for AGIs $100k-200k, 4527.5% for AGIs over 200k)
Charity contributions: $8,220 (reported on 3.2% of returns)
Here:
$8,220
State:
$13,548
(% of AGI for various income ranges: 1.8% for AGIs below $25k, 16.0% for AGIs $25k-50k, 42.4% for AGIs $50k-75k, 70.8% for AGIs $75k-100k, 150.9% for AGIs $100k-200k, 1485.0% for AGIs over 200k)
Taxes paid: $6,443 (reported on 4.0% of returns)
48186:
$6,443
State:
$7,972
(% of AGI for various income ranges: 3.6% for AGIs below $25k, 14.6% for AGIs $25k-50k, 49.8% for AGIs $50k-75k, 81.0% for AGIs $75k-100k, 142.7% for AGIs $100k-200k, 720.0% for AGIs over 200k)
Earned income credit: $2,198 (reported on 17.8% of returns)
Here:
$2,198
State:
$2,251
(% of AGI for various income ranges: 91.3% for AGIs below $25k, 64.0% for AGIs $25k-50k, 1.4% for AGIs $50k-75k)
Percentage of individuals using paid preparers for their 2020 taxes: 93.2%
Here:
93%
State:
93%
(% for various income ranges: 92.4% for AGIs below $25k, 94.2% for AGIs $25k-50k, 93.1% for AGIs $50k-75k, 93.6% for AGIs $75k-100k, 93.3% for AGIs $100k-200k, 90.9% for AGIs over 200k)
Averages for the 2012 tax year for zip code 48186, filed in 2013:
Average Adjusted Gross Income (AGI) in 2012: $38,349 (Individual Income Tax Returns)
Here:
$38,349
State:
$55,609
Salary/wage: $36,157 (reported on 83.9% of returns)
Here:
$36,157
State:
$46,782
(% of AGI for various income ranges: 69.2% for AGIs below $25k, 77.9% for AGIs $25k-50k, 79.3% for AGIs $50k-75k, 83.4% for AGIs $75k-100k, 85.4% for AGIs $100k-200k, 59.8% for AGIs over 200k)
Taxable interest for individuals: $538 (reported on 24.2% of returns)
This zip code:
$538
Michigan:
$1,491
(% of AGI for various income ranges: 0.7% for AGIs below $25k, 0.4% for AGIs $25k-50k, 0.3% for AGIs $50k-75k, 0.2% for AGIs $75k-100k, 0.2% for AGIs $100k-200k)
Ordinary dividends: $1,414 (reported on 11.1% of returns)
Here:
$1,414
State:
$6,225
(% of AGI for various income ranges: 0.8% for AGIs below $25k, 0.4% for AGIs $25k-50k, 0.3% for AGIs $50k-75k, 0.5% for AGIs $75k-100k, 0.2% for AGIs $100k-200k)
Net capital gain/loss in AGI: +$41 (reported on 7.0% of returns)
Here:
+$41
State:
+$9,326
(% of AGI for various income ranges: 0.2% for AGIs $75k-100k)
Profit/loss from business: +$6,532 (reported on 11.4% of returns)
Here:
+$6,532
State:
+$11,523
(% of AGI for various income ranges: 7.7% for AGIs below $25k, 1.2% for AGIs $25k-50k, 0.8% for AGIs $50k-75k, 1.3% for AGIs $75k-100k, 0.6% for AGIs $100k-200k)
Taxable individual retirement arrangement distribution: $10,830 (reported on 7.6% of returns)
48186:
$10,830
Michigan:
$15,298
(% of AGI for various income ranges: 2.1% for AGIs below $25k, 1.7% for AGIs $25k-50k, 2.0% for AGIs $50k-75k, 1.9% for AGIs $75k-100k, 3.3% for AGIs $100k-200k)
Total itemized deductions: $15,362 (22% of AGI, reported on 24.7% of returns)
Here:
$15,362
State:
$21,628
Here:
22.2% of AGI
State:
18.4% of AGI
(% of AGI for various income ranges: 5.9% for AGIs below $25k, 8.4% for AGIs $25k-50k, 10.0% for AGIs $50k-75k, 11.9% for AGIs $75k-100k, 12.5% for AGIs $100k-200k, 12.1% for AGIs over 200k)
Charity contributions: $2,620 (reported on 19.9% of returns)
Here:
$2,620
State:
$4,225
(% of AGI for various income ranges: 0.5% for AGIs below $25k, 1.2% for AGIs $25k-50k, 1.4% for AGIs $50k-75k, 1.7% for AGIs $75k-100k, 1.8% for AGIs $100k-200k, 1.4% for AGIs over 200k)
Taxes paid: $5,124 (reported on 24.6% of returns)
48186:
$5,124
State:
$8,327
(% of AGI for various income ranges: 1.4% for AGIs below $25k, 2.4% for AGIs $25k-50k, 3.2% for AGIs $50k-75k, 4.2% for AGIs $75k-100k, 5.0% for AGIs $100k-200k, 4.6% for AGIs over 200k)
Earned income credit: $2,287 (reported on 21.4% of returns)
Here:
$2,287
State:
$2,306
(% of AGI for various income ranges: 7.1% for AGIs below $25k, 1.0% for AGIs $25k-50k)
Percentage of individuals using paid preparers for their 2012 taxes: 53.1%
Here:
53%
State:
57%
(% for various income ranges: 51.1% for AGIs below $25k, 53.7% for AGIs $25k-50k, 55.0% for AGIs $50k-75k, 55.4% for AGIs $75k-100k, 58.8% for AGIs $100k-200k, 50.0% for AGIs over 200k)
Averages for the 2004 tax year for zip code 48186, filed in 2005:
Average Adjusted Gross Income (AGI) in 2004: $38,823 (Individual Income Tax Returns)
Here:
$38,823
State:
$48,204
Salary/wage: $37,859 (reported on 88.1% of returns)
Here:
$37,859
State:
$42,791
(% of AGI for various income ranges: 77.0% for AGIs below $10k, 71.0% for AGIs $10k-25k, 83.3% for AGIs $25k-50k, 88.7% for AGIs $50k-75k, 91.4% for AGIs $75k-100k, 89.1% for AGIs over 100k)
Taxable interest for individuals: $715 (reported on 38.8% of returns)
This zip code:
$715
Michigan:
$1,725
(% of AGI for various income ranges: 3.2% for AGIs below $10k, 1.5% for AGIs $10k-25k, 0.8% for AGIs $25k-50k, 0.5% for AGIs $50k-75k, 0.4% for AGIs $75k-100k, 0.4% for AGIs over 100k)
Taxable dividends: $964 (reported on 16.3% of returns)
Here:
$964
State:
$3,420
(% of AGI for various income ranges: 1.2% for AGIs below $10k, 0.8% for AGIs $10k-25k, 0.4% for AGIs $25k-50k, 0.3% for AGIs $50k-75k, 0.2% for AGIs $75k-100k, 0.4% for AGIs over 100k)
Net capital gain/loss: +$1,123 (reported on 9.6% of returns)
Here:
+$1,123
State:
+$8,532
(% of AGI for various income ranges: -1.0% for AGIs below $10k, -0.2% for AGIs $10k-25k, 0.1% for AGIs $25k-50k, 0.3% for AGIs $50k-75k, 0.4% for AGIs $75k-100k, 1.0% for AGIs over 100k)
Profit/loss from business: +$5,208 (reported on 9.4% of returns)
Here:
+$5,208
State:
+$9,547
(% of AGI for various income ranges: 5.7% for AGIs below $10k, 3.9% for AGIs $10k-25k, 1.5% for AGIs $25k-50k, 0.7% for AGIs $50k-75k, 0.7% for AGIs $75k-100k, 0.1% for AGIs over 100k)
IRA payment deduction: $2,432 (reported on 1.3% of returns)
48186:
$2,432
Michigan:
$2,875
(% of AGI for various income ranges: 0.1% for AGIs $10k-25k, 0.1% for AGIs $25k-50k, 0.1% for AGIs $50k-75k, 0.0% for AGIs $75k-100k, 0.1% for AGIs over 100k)
Self-employed pension: $3,091 (reported on 0.1% of returns)
Here:
$3,091
Michigan:
$13,826
Total itemized deductions: $15,043 (24% of AGI, reported on 38.5% of returns)
Here:
$15,043
State:
$18,509
Here:
24.2% of AGI
State:
20.7% of AGI
(% of AGI for various income ranges: 8.5% for AGIs below $10k, 9.4% for AGIs $10k-25k, 15.1% for AGIs $25k-50k, 16.6% for AGIs $50k-75k, 16.0% for AGIs $75k-100k, 15.1% for AGIs over 100k)
Charity contributions deductions: $2,092 (3% of AGI, reported on 34.0% of returns)
Here:
$2,092
State:
$3,365
Here:
3.3% of AGI
State:
3.6% of AGI
(% of AGI for various income ranges: 0.5% for AGIs below $10k, 1.1% for AGIs $10k-25k, 1.7% for AGIs $25k-50k, 2.0% for AGIs $50k-75k, 2.0% for AGIs $75k-100k, 2.3% for AGIs over 100k)
Total tax: $4,460 (reported on 76.0% of returns)
48186:
$4,460
State:
$7,691
(% of AGI for various income ranges: 1.9% for AGIs below $10k, 4.0% for AGIs $10k-25k, 6.8% for AGIs $25k-50k, 8.7% for AGIs $50k-75k, 10.3% for AGIs $75k-100k, 14.0% for AGIs over 100k)
Earned income credit: $1,639 (reported on 14.7% of returns)
Here:
$1,639
State:
$1,737
Percentage of individuals using paid preparers for their 2004 taxes: 59.8%
Here:
60%
State:
60%
(% for various income ranges: 53.6% for AGIs below $10k, 61.1% for AGIs $10k-25k, 61.2% for AGIs $25k-50k, 60.9% for AGIs $50k-75k, 61.4% for AGIs $75k-100k, 63.5% for AGIs over 100k)
Likely homosexual households (counted as self-reported same-sex unmarried-partner households)
Lesbian couples: 0.2% of all households
Gay men: 0.1% of all households
Household received Food Stamps/SNAP in the past 12 months: 2,864 Household did not receive Food Stamps/SNAP in the past 12 months: 10,918
Women who had a birth in the past 12 months: 473 (305 now married, 167 unmarried) Women who did not have a birth in the past 12 months: 8,235 (2,720 now married, 5,527 unmarried)
Housing units in zip code 48186 with a mortgage: 5,969 (666 second mortgage, 27 home equity loan, 601 both second mortgage and home equity loan) Houses without a mortgage: 254
Median monthly owner costs for units with a mortgage: $1,279 Median monthly owner costs for units without a mortgage: $540
Residents with income below the poverty level in 2022:
This zip code:
14.2%
Whole state:
13.4%
Residents with income below 50% of the poverty level in 2022:
This zip code:
7.1%
Whole state:
6.9%
Median number of rooms in houses and condos:
Here:
6.0
State:
6.5
Median number of rooms in apartments:
Here:
4.6
State:
4.3
Notable locations in this zip code not listed on our city pages
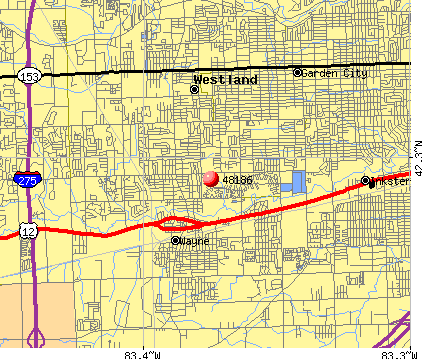
Notable locations in zip code 48186: Westland Municipal Golf Course (A), Oakwood Healthcare Center - Westland (B), Westland Fire Department Station 5 (C), Westland Fire Department Station 4 (D), Westland Fire Department Station 3 (E). Display/hide their locations on the map
Shopping Centers: Venoy Palmer Shopping Center (1), One Michigan Place Shopping Center (2), Birch Hill Plaza Shopping Center (3). Display/hide their locations on the map
Parks in zip code 48186 include: Cayley Park (1), Annapolis Park Historic District Historical Marker (2), Eloise Historical Marker (3), Hubbard Park (4), Curtis Woods Park (5). Display/hide their locations on the map
4,526 married couples with children.
2,674 single-parent households (777 men, 1,897 women).
87.6% of residents of 48186 zip code speak English at home.
3.5% of residents speak Spanish at home (72% very well, 12% well, 16% not well).
3.8% of residents speak other Indo-European language at home (75% very well, 15% well, 10% not well).
1.1% of residents speak Asian or Pacific Island language at home (88% very well, 7% well, 4% not well).
3.3% of residents speak other language at home (77% very well, 11% well, 12% not well).
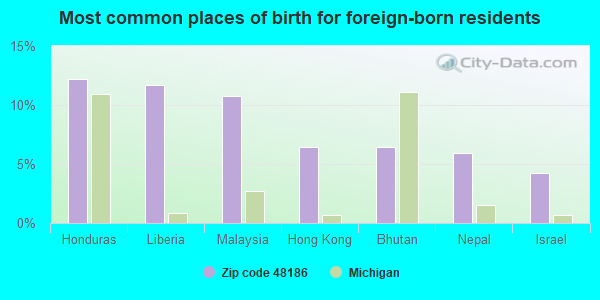
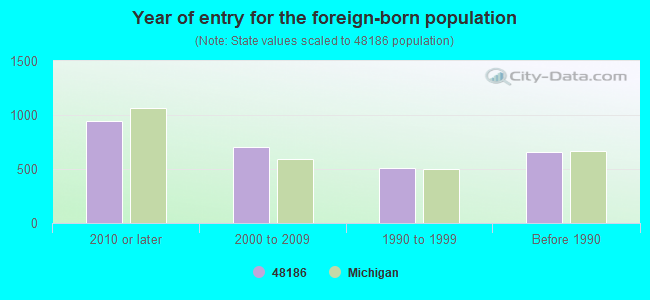
Foreign born population: 2,429 (6.7%) (71.8% of them are naturalized citizens)
Facilities with environmental interests located in this zip code:
ADLAI STEVENSON MIDDLE SCHOOL (38501 PALMER ROAD in WESTLAND, MI)
(National Center for Education Statistics) - STATE ID-04926 Conditionally Exempt Small Quantity Generators, less than 100 kg/month of hazardous waste (Resource Conservation and Recovery Act (tracking hazardous waste)) - notification Organizations: WAYNE WESTLAND COMMUNITY SCHOOLS (CONTACT/OPERATOR)
, WAYNE-WESTLAND COMMUNITY SCHOOL DISTRICT (SCHOOL DISTRICT)
Alternative names: STEVENSON JUNIOR HIGH SCHOOL
GRAHAM ELEMENTARY SCHOOL (1255 SOUTH JOHN HIX in WESTLAND, MI)
(National Center for Education Statistics) - STATE ID-05881 Conditionally Exempt Small Quantity Generators, less than 100 kg/month of hazardous waste (Resource Conservation and Recovery Act (tracking hazardous waste)) Organizations: WAYNE WESTLAND COMMTY SCHOOLS (CONTACT/OPERATOR)
, WAYNE-WESTLAND COMMUNITY SCHOOL DISTRICT (SCHOOL DISTRICT)
ACADEMY OF WESTLAND (300 S. HENRY RUFF ROAD in WESTLAND, MI)
(National Center for Education Statistics) - STATE ID-08334
EXZAK INC (1157 MANUFACTURERS DRIVE in WESTLAND, MI)
Conditionally Exempt Small Quantity Generators, less than 100 kg/month of hazardous waste (Resource Conservation and Recovery Act (tracking hazardous waste)) Business NAICS classification: MACHINE TOOL (METAL CUTTING TYPES) MANUFACTURING.; CUTTING TOOL AND MACHINE TOOL ACCESSORY MANUFACTURING. Organizations: DAVID ANDERZAK (CONTACT/OWNER)
, DONATO E PAOLUCCI (CONTACT/OWNER)
B & K COLLISION INC (1338 S WAYNE ROAD in WESTLAND, MI)
Conditionally Exempt Small Quantity Generators, less than 100 kg/month of hazardous waste (Resource Conservation and Recovery Act (tracking hazardous waste)) Business NAICS classification: AUTOMOTIVE BODY, PAINT, AND INTERIOR REPAIR AND MAINTENANCE. Organizations: MICHAEL BRENNAN (CONTACT/OWNER)
BADGER DAYLIGHTING (36000 OAKWOOD LANE in WESTLAND, MI)
(Resource Conservation and Recovery Act (tracking hazardous waste))
ADVANCE AUTO PARTS (31200 MICHIGAN AVE in WESTLAND, MI)
Small Quantity Generators, between 100 kg and 1000 kg of hazardous waste/month (Resource Conservation and Recovery Act (tracking hazardous waste)) Organizations: ADVANCE STORES COMPANY, INCORPORATED (CONTACT/OPERATOR)
ELECTRO-TECH INC (1313 S NEWBURGH RD in WESTLAND, MI)
Conditionally Exempt Small Quantity Generators, less than 100 kg/month of hazardous waste (Resource Conservation and Recovery Act (tracking hazardous waste)) Organizations: BEAUCHAMP JACK M (CONTACT/OPERATOR)
Housing units lacking complete plumbing facilities: 0.8% Housing units lacking complete kitchen facilities: 1.6%
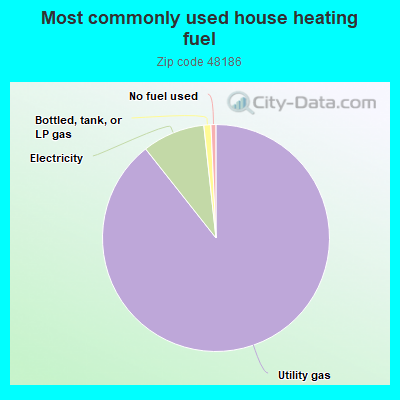
89.0%Utility gas
8.9%Electricity
1.0%Bottled, tank, or LP gas
0.7%No fuel used
Place of birth for U.S.-born residents:
This state: 28,715
Northeast: 655
Midwest: 1,730
South: 1,749
West: 344
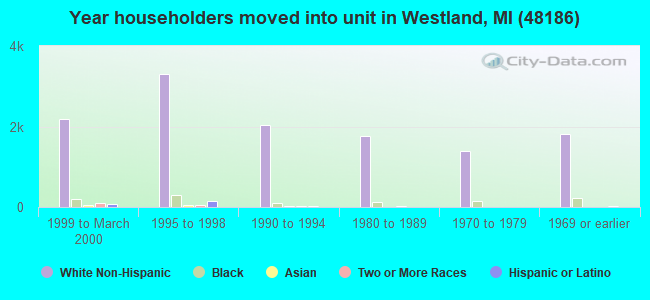
57% of the 48186 zip code residents lived in the same house 5 years ago. Out of people who lived in different houses, 76% lived in this county. Out of people who lived in different counties, 50% lived in Michigan.
91% of the 48186 zip code residents lived in the same house 1 year ago. Out of people who lived in different houses, 72% moved from this county. Out of people who lived in different houses, 18% moved from different county within same state. Out of people who lived in different houses, 5% moved from different state. Out of people who lived in different houses, 3% moved from abroad.
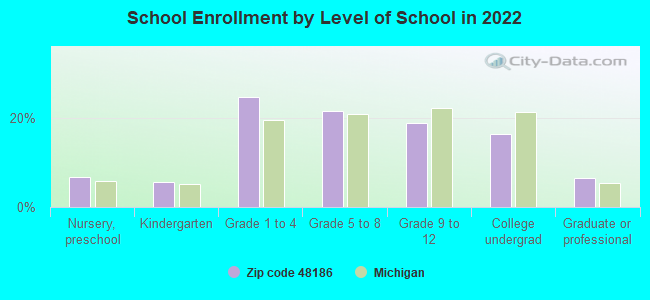
Private vs. public school enrollment:
Students in private schools in grades 1 to 8 (elementary and middle school): 451
Here:
11.8%
Michigan:
12.4%
Students in private schools in grades 9 to 12 (high school): 123
Here:
7.8%
Michigan:
9.8%
Students in private undergraduate colleges: 180
Here:
13.2%
Michigan:
14.9%
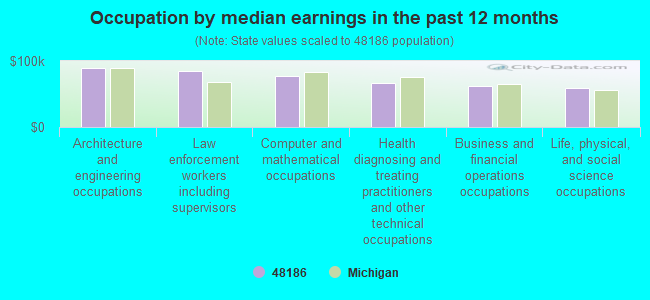
Occupation by median earnings in the past 12 months ($)
89,013Architecture and engineering occupations
84,768Law enforcement workers including supervisors
77,450Computer and mathematical occupations
65,932Health diagnosing and treating practitioners and other technical occupations
61,482Business and financial operations occupations
58,538Life, physical, and social science occupations
Companies with federal contracts located in this zip code (WESTLAND, MI):
ELECTRO-TECH INC (1313 S NEWBURGH RD; small business) 500 employees, $0 revenue. : $3,100,995 in 53 contractsfrom 2000 to 2006
Contracts for Electrical Control Equipment, Connectors, Electrical, Engine Electrical System Components, Nonaircraft, Relays and Solenoids, and moreby Defense Logistics Agency, Army Signed by year:2000: $305,980; 2001: $155,865; 2002: $187,584; 2003: $465,399; 2004: $868,097; 2005: $706,839; 2006: $411,231.
Biggest contracts:
$303,325 with Defense Logistics Agency for Electrical Control Equipment. Signed on 2004-02-17. Completion date: 2005-01-08.
$291,642, same as above.Signed on 2006-04-12. Completion date: 2006-10-24.
$216,929, same as above.Signed on 2005-05-31. Completion date: 2005-11-12.
$181,296 with Army for Electrical Control Equipment. Signed on 2003-10-22. Completion date: 2004-05-28.
RHM FLUID POWER, INC (375 MANUFACTURERS DRIVE; small business) : $123,155 in 3 contractsfrom 2004 to 2005
$119,254 with Army for Hose, Pipe, Tube, Lubrication, and Railing Fittings. Taking place in FL. Signed on 2005-04-05. Completion date: 2005-05-20.
$3,651 with Army for Valves, Nonpowered. Signed on 2004-07-01. Completion date: 2004-12-31.
$250, same as above.Signed on 2004-11-02. Completion date: 2004-12-31.
INTRA CORPORATION (885 MANUFACTURERS DR; small business)
$63,410 with Navy for Miscellaneous Aircraft Accessories and Components. Signed on 2006-03-03. Completion date: 2006-07-07.
DEBRA J JAMES, OWNER (38331 S JEAN CT; small business) : $62,820 in 3 contractsfrom 2003 to 2005
$22,946 with Navy for Operations Research and Quantitative Analysis Services. Signed on 2005-09-30. Completion date: 2006-09-30.
$22,946 with Navy for Specifications Development Services. Signed on 2004-12-01. Completion date: 2005-09-30.
$16,928 with Navy for Biomedical -- Basic Research (R&D). Signed on 2003-11-10. Completion date: 2003-11-10.
Top industries in this zip code by the number of employees in 2005:
Administrative and Support and Waste Management and Remediation Services: Professional Employer Organizations (250-499 employees: 1 establishment, 20-49 employees: 1 establishment)
Health Care and Social Assistance: Psychiatric and Substance Abuse Hospitals (250-499: 1)
Administrative and Support and Waste Management and Remediation Services: Temporary Help Services (250-499: 1)
2002 - 2018 National Fire Incident Reporting System (NFIRS) incidents
Based on the data from the years 2002 - 2018 the average number of fire incidents per year is 33. The highest number of fires - 81 took place in 2017, and the least - 1 in 2012. The data has a growing trend.
When looking into fire subcategories, the most incidents belonged to: Structure Fires (47.0%), and Outside Fires (34.0%).
Fire incident types reported to NFIRS in Zip Code 48186


 Nearest zip codes: 48184, 48185, 48135, 48141, 48174, 48242.
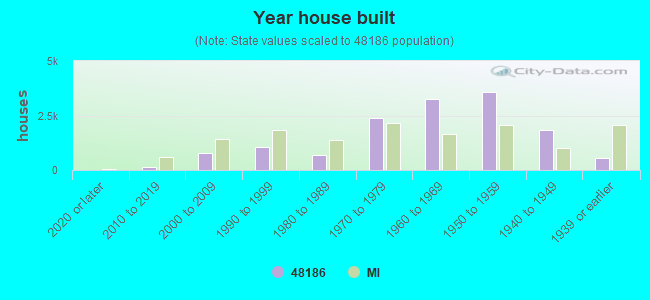


 Based on the data from the years 2002 - 2018 the average number of fire incidents per year is 33. The highest number of fires - 81 took place in 2017, and the least - 1 in 2012. The data has a growing trend.
 When looking into fire subcategories, the most incidents belonged to: Structure Fires (47.0%), and Outside Fires (34.0%).