Estimated zip code population in 2022: 27,138
Zip code population in 2010: 27,665
Zip code population in 2000: 29,416
Houses and condos: 11,385
Renter-occupied apartments: 2,114
% of renters here:
19%State:
27%
March 2022 cost of living index in zip code 48135: 94.8
(less than average, U.S. average is 100)
Land area: 5.9
sq. mi.
Water area: 0.0
sq. mi.
Population density: 4,625 people per square mile (average).
OSM Map
General Map
Google Map
MSN Map
OSM Map
General Map
Google Map
MSN Map
OSM Map
General Map
Google Map
MSN Map
OSM Map
General Map
Google Map
MSN Map
Please wait while loading the map...
Real estate property taxes paid for housing units in 2022:
This zip code:
1.6% ($2,813)Michigan:
1.2% ($2,746)
Median real estate property taxes paid for housing units with mortgages in 2022: $2,888 (1.7%)
Median real estate property taxes paid for housing units with no mortgage in 2022: $2,715 (1.6%)
Profiles of local businesses
Business Search - 14 Million verified businesses
Males: 13,372 Females: 13,765
For population 25 years and over in 48135:
High school or higher: 90.0%Bachelor's degree or higher: 14.4%Graduate or professional degree: 4.0%Unemployed: 6.1%Mean travel time to work (commute): 26.4 minutes
For population 15 years and over in 48135:
Never married: 33.9%Now married: 45.8%Separated: 1.0%Widowed: 7.0%Divorced: 12.3%
Zip code 48135 compared to state average:
Black race population percentage below state average. Foreign-born population percentage below state average. Length of stay since moving in above state average. Percentage of population with a bachelor's degree or higher below state average. 22,964 84.6% White 1,643 6.1% Black 1,292 4.8% Hispanic or Latino 914 3.4% Two or more races 233 0.9% Asian 82 0.3% American Indian 6 0.02% Some other race
Data:
Median household income ($)
Median household income (% change since 2000)
Household income diversity
Ratio of average income to average house value (%)
Ratio of average income to average rent
Median household income ($) - White
Median household income ($) - Black or African American
Median household income ($) - Asian
Median household income ($) - Hispanic or Latino
Median household income ($) - American Indian and Alaska Native
Median household income ($) - Multirace
Median household income ($) - Other Race
Median household income for houses/condos with a mortgage ($)
Median household income for apartments without a mortgage ($)
Races - White alone (%)
Races - White alone (% change since 2000)
Races - Black alone (%)
Races - Black alone (% change since 2000)
Races - American Indian alone (%)
Races - American Indian alone (% change since 2000)
Races - Asian alone (%)
Races - Asian alone (% change since 2000)
Races - Hispanic (%)
Races - Hispanic (% change since 2000)
Races - Native Hawaiian and Other Pacific Islander alone (%)
Races - Native Hawaiian and Other Pacific Islander alone (% change since 2000)
Races - Two or more races (%)
Races - Two or more races (% change since 2000)
Races - Other race alone (%)
Races - Other race alone (% change since 2000)
Racial diversity
Unemployment (%)
Unemployment (% change since 2000)
Unemployment (%) - White
Unemployment (%) - Black or African American
Unemployment (%) - Asian
Unemployment (%) - Hispanic or Latino
Unemployment (%) - American Indian and Alaska Native
Unemployment (%) - Multirace
Unemployment (%) - Other Race
Population density (people per square mile)
Population - Males (%)
Population - Females (%)
Population - Males (%) - White
Population - Males (%) - Black or African American
Population - Males (%) - Asian
Population - Males (%) - Hispanic or Latino
Population - Males (%) - American Indian and Alaska Native
Population - Males (%) - Multirace
Population - Males (%) - Other Race
Population - Females (%) - White
Population - Females (%) - Black or African American
Population - Females (%) - Asian
Population - Females (%) - Hispanic or Latino
Population - Females (%) - American Indian and Alaska Native
Population - Females (%) - Multirace
Population - Females (%) - Other Race
Coronavirus confirmed cases (Apr 27, 2024)
Deaths caused by coronavirus (Apr 27, 2024)
Coronavirus confirmed cases (per 100k population) (Apr 27, 2024)
Deaths caused by coronavirus (per 100k population) (Apr 27, 2024)
Daily increase in number of cases (Apr 27, 2024)
Weekly increase in number of cases (Apr 27, 2024)
Cases doubled (in days) (Apr 27, 2024)
Hospitalized patients (Apr 18, 2022)
Negative test results (Apr 18, 2022)
Total test results (Apr 18, 2022)
COVID Vaccine doses distributed (per 100k population) (Sep 19, 2023)
COVID Vaccine doses administered (per 100k population) (Sep 19, 2023)
COVID Vaccine doses distributed (Sep 19, 2023)
COVID Vaccine doses administered (Sep 19, 2023)
Likely homosexual households (%)
Likely homosexual households (% change since 2000)
Likely homosexual households - Lesbian couples (%)
Likely homosexual households - Lesbian couples (% change since 2000)
Likely homosexual households - Gay men (%)
Likely homosexual households - Gay men (% change since 2000)
Cost of living index
Median gross rent ($)
Median contract rent ($)
Median monthly housing costs ($)
Median house or condo value ($)
Median house or condo value ($ change since 2000)
Mean house or condo value by units in structure - 1, detached ($)
Mean house or condo value by units in structure - 1, attached ($)
Mean house or condo value by units in structure - 2 ($)
Mean house or condo value by units in structure by units in structure - 3 or 4 ($)
Mean house or condo value by units in structure - 5 or more ($)
Mean house or condo value by units in structure - Boat, RV, van, etc. ($)
Mean house or condo value by units in structure - Mobile home ($)
Median house or condo value ($) - White
Median house or condo value ($) - Black or African American
Median house or condo value ($) - Asian
Median house or condo value ($) - Hispanic or Latino
Median house or condo value ($) - American Indian and Alaska Native
Median house or condo value ($) - Multirace
Median house or condo value ($) - Other Race
Median resident age
Resident age diversity
Median resident age - Males
Median resident age - Females
Median resident age - White
Median resident age - Black or African American
Median resident age - Asian
Median resident age - Hispanic or Latino
Median resident age - American Indian and Alaska Native
Median resident age - Multirace
Median resident age - Other Race
Median resident age - Males - White
Median resident age - Males - Black or African American
Median resident age - Males - Asian
Median resident age - Males - Hispanic or Latino
Median resident age - Males - American Indian and Alaska Native
Median resident age - Males - Multirace
Median resident age - Males - Other Race
Median resident age - Females - White
Median resident age - Females - Black or African American
Median resident age - Females - Asian
Median resident age - Females - Hispanic or Latino
Median resident age - Females - American Indian and Alaska Native
Median resident age - Females - Multirace
Median resident age - Females - Other Race
Commute - mean travel time to work (minutes)
Travel time to work - Less than 5 minutes (%)
Travel time to work - Less than 5 minutes (% change since 2000)
Travel time to work - 5 to 9 minutes (%)
Travel time to work - 5 to 9 minutes (% change since 2000)
Travel time to work - 10 to 19 minutes (%)
Travel time to work - 10 to 19 minutes (% change since 2000)
Travel time to work - 20 to 29 minutes (%)
Travel time to work - 20 to 29 minutes (% change since 2000)
Travel time to work - 30 to 39 minutes (%)
Travel time to work - 30 to 39 minutes (% change since 2000)
Travel time to work - 40 to 59 minutes (%)
Travel time to work - 40 to 59 minutes (% change since 2000)
Travel time to work - 60 to 89 minutes (%)
Travel time to work - 60 to 89 minutes (% change since 2000)
Travel time to work - 90 or more minutes (%)
Travel time to work - 90 or more minutes (% change since 2000)
Marital status - Never married (%)
Marital status - Now married (%)
Marital status - Separated (%)
Marital status - Widowed (%)
Marital status - Divorced (%)
Median family income ($)
Median family income (% change since 2000)
Median non-family income ($)
Median non-family income (% change since 2000)
Median per capita income ($)
Median per capita income (% change since 2000)
Median family income ($) - White
Median family income ($) - Black or African American
Median family income ($) - Asian
Median family income ($) - Hispanic or Latino
Median family income ($) - American Indian and Alaska Native
Median family income ($) - Multirace
Median family income ($) - Other Race
Median year house/condo built
Median year apartment built
Year house built - Built 2005 or later (%)
Year house built - Built 2000 to 2004 (%)
Year house built - Built 1990 to 1999 (%)
Year house built - Built 1980 to 1989 (%)
Year house built - Built 1970 to 1979 (%)
Year house built - Built 1960 to 1969 (%)
Year house built - Built 1950 to 1959 (%)
Year house built - Built 1940 to 1949 (%)
Year house built - Built 1939 or earlier (%)
Average household size
Household density (households per square mile)
Average household size - White
Average household size - Black or African American
Average household size - Asian
Average household size - Hispanic or Latino
Average household size - American Indian and Alaska Native
Average household size - Multirace
Average household size - Other Race
Occupied housing units (%)
Vacant housing units (%)
Owner occupied housing units (%)
Renter occupied housing units (%)
Vacancy status - For rent (%)
Vacancy status - For sale only (%)
Vacancy status - Rented or sold, not occupied (%)
Vacancy status - For seasonal, recreational, or occasional use (%)
Vacancy status - For migrant workers (%)
Vacancy status - Other vacant (%)
Residents with income below the poverty level (%)
Residents with income below 50% of the poverty level (%)
Children below poverty level (%)
Poor families by family type - Married-couple family (%)
Poor families by family type - Male, no wife present (%)
Poor families by family type - Female, no husband present (%)
Poverty status for native-born residents (%)
Poverty status for foreign-born residents (%)
Poverty among high school graduates not in families (%)
Poverty among people who did not graduate high school not in families (%)
Residents with income below the poverty level (%) - White
Residents with income below the poverty level (%) - Black or African American
Residents with income below the poverty level (%) - Asian
Residents with income below the poverty level (%) - Hispanic or Latino
Residents with income below the poverty level (%) - American Indian and Alaska Native
Residents with income below the poverty level (%) - Multirace
Residents with income below the poverty level (%) - Other Race
Air pollution - Air Quality Index (AQI)
Air pollution - CO
Air pollution - NO2
Air pollution - SO2
Air pollution - Ozone
Air pollution - PM10
Air pollution - PM25
Air pollution - Pb
Crime - Murders per 100,000 population
Crime - Rapes per 100,000 population
Crime - Robberies per 100,000 population
Crime - Assaults per 100,000 population
Crime - Burglaries per 100,000 population
Crime - Thefts per 100,000 population
Crime - Auto thefts per 100,000 population
Crime - Arson per 100,000 population
Crime - City-data.com crime index
Crime - Violent crime index
Crime - Property crime index
Crime - Murders per 100,000 population (5 year average)
Crime - Rapes per 100,000 population (5 year average)
Crime - Robberies per 100,000 population (5 year average)
Crime - Assaults per 100,000 population (5 year average)
Crime - Burglaries per 100,000 population (5 year average)
Crime - Thefts per 100,000 population (5 year average)
Crime - Auto thefts per 100,000 population (5 year average)
Crime - Arson per 100,000 population (5 year average)
Crime - City-data.com crime index (5 year average)
Crime - Violent crime index (5 year average)
Crime - Property crime index (5 year average)
1996 Presidential Elections Results (%) - Democratic Party (Clinton)
1996 Presidential Elections Results (%) - Republican Party (Dole)
1996 Presidential Elections Results (%) - Other
2000 Presidential Elections Results (%) - Democratic Party (Gore)
2000 Presidential Elections Results (%) - Republican Party (Bush)
2000 Presidential Elections Results (%) - Other
2004 Presidential Elections Results (%) - Democratic Party (Kerry)
2004 Presidential Elections Results (%) - Republican Party (Bush)
2004 Presidential Elections Results (%) - Other
2008 Presidential Elections Results (%) - Democratic Party (Obama)
2008 Presidential Elections Results (%) - Republican Party (McCain)
2008 Presidential Elections Results (%) - Other
2012 Presidential Elections Results (%) - Democratic Party (Obama)
2012 Presidential Elections Results (%) - Republican Party (Romney)
2012 Presidential Elections Results (%) - Other
2016 Presidential Elections Results (%) - Democratic Party (Clinton)
2016 Presidential Elections Results (%) - Republican Party (Trump)
2016 Presidential Elections Results (%) - Other
2020 Presidential Elections Results (%) - Democratic Party (Biden)
2020 Presidential Elections Results (%) - Republican Party (Trump)
2020 Presidential Elections Results (%) - Other
Ancestries Reported - Arab (%)
Ancestries Reported - Czech (%)
Ancestries Reported - Danish (%)
Ancestries Reported - Dutch (%)
Ancestries Reported - English (%)
Ancestries Reported - French (%)
Ancestries Reported - French Canadian (%)
Ancestries Reported - German (%)
Ancestries Reported - Greek (%)
Ancestries Reported - Hungarian (%)
Ancestries Reported - Irish (%)
Ancestries Reported - Italian (%)
Ancestries Reported - Lithuanian (%)
Ancestries Reported - Norwegian (%)
Ancestries Reported - Polish (%)
Ancestries Reported - Portuguese (%)
Ancestries Reported - Russian (%)
Ancestries Reported - Scotch-Irish (%)
Ancestries Reported - Scottish (%)
Ancestries Reported - Slovak (%)
Ancestries Reported - Subsaharan African (%)
Ancestries Reported - Swedish (%)
Ancestries Reported - Swiss (%)
Ancestries Reported - Ukrainian (%)
Ancestries Reported - United States (%)
Ancestries Reported - Welsh (%)
Ancestries Reported - West Indian (%)
Ancestries Reported - Other (%)
Educational Attainment - No schooling completed (%)
Educational Attainment - Less than high school (%)
Educational Attainment - High school or equivalent (%)
Educational Attainment - Less than 1 year of college (%)
Educational Attainment - 1 or more years of college (%)
Educational Attainment - Associate degree (%)
Educational Attainment - Bachelor's degree (%)
Educational Attainment - Master's degree (%)
Educational Attainment - Professional school degree (%)
Educational Attainment - Doctorate degree (%)
School Enrollment - Nursery, preschool (%)
School Enrollment - Kindergarten (%)
School Enrollment - Grade 1 to 4 (%)
School Enrollment - Grade 5 to 8 (%)
School Enrollment - Grade 9 to 12 (%)
School Enrollment - College undergrad (%)
School Enrollment - Graduate or professional (%)
School Enrollment - Not enrolled in school (%)
School enrollment - Public schools (%)
School enrollment - Private schools (%)
School enrollment - Not enrolled (%)
Median number of rooms in houses and condos
Median number of rooms in apartments
Housing units lacking complete plumbing facilities (%)
Housing units lacking complete kitchen facilities (%)
Density of houses
Urban houses (%)
Rural houses (%)
Households with people 60 years and over (%)
Households with people 65 years and over (%)
Households with people 75 years and over (%)
Households with one or more nonrelatives (%)
Households with no nonrelatives (%)
Population in households (%)
Family households (%)
Nonfamily households (%)
Population in families (%)
Family households with own children (%)
Median number of bedrooms in owner occupied houses
Mean number of bedrooms in owner occupied houses
Median number of bedrooms in renter occupied houses
Mean number of bedrooms in renter occupied houses
Median number of vehichles in owner occupied houses
Mean number of vehichles in owner occupied houses
Median number of vehichles in renter occupied houses
Mean number of vehichles in renter occupied houses
Mortgage status - with mortgage (%)
Mortgage status - with second mortgage (%)
Mortgage status - with home equity loan (%)
Mortgage status - with both second mortgage and home equity loan (%)
Mortgage status - without a mortgage (%)
Average family size
Average family size - White
Average family size - Black or African American
Average family size - Asian
Average family size - Hispanic or Latino
Average family size - American Indian and Alaska Native
Average family size - Multirace
Average family size - Other Race
Geographical mobility - Same house 1 year ago (%)
Geographical mobility - Moved within same county (%)
Geographical mobility - Moved from different county within same state (%)
Geographical mobility - Moved from different state (%)
Geographical mobility - Moved from abroad (%)
Place of birth - Born in state of residence (%)
Place of birth - Born in other state (%)
Place of birth - Native, outside of US (%)
Place of birth - Foreign born (%)
Housing units in structures - 1, detached (%)
Housing units in structures - 1, attached (%)
Housing units in structures - 2 (%)
Housing units in structures - 3 or 4 (%)
Housing units in structures - 5 to 9 (%)
Housing units in structures - 10 to 19 (%)
Housing units in structures - 20 to 49 (%)
Housing units in structures - 50 or more (%)
Housing units in structures - Mobile home (%)
Housing units in structures - Boat, RV, van, etc. (%)
House/condo owner moved in on average (years ago)
Renter moved in on average (years ago)
Year householder moved into unit - Moved in 1999 to March 2000 (%)
Year householder moved into unit - Moved in 1995 to 1998 (%)
Year householder moved into unit - Moved in 1990 to 1994 (%)
Year householder moved into unit - Moved in 1980 to 1989 (%)
Year householder moved into unit - Moved in 1970 to 1979 (%)
Year householder moved into unit - Moved in 1969 or earlier (%)
Means of transportation to work - Drove car alone (%)
Means of transportation to work - Carpooled (%)
Means of transportation to work - Public transportation (%)
Means of transportation to work - Bus or trolley bus (%)
Means of transportation to work - Streetcar or trolley car (%)
Means of transportation to work - Subway or elevated (%)
Means of transportation to work - Railroad (%)
Means of transportation to work - Ferryboat (%)
Means of transportation to work - Taxicab (%)
Means of transportation to work - Motorcycle (%)
Means of transportation to work - Bicycle (%)
Means of transportation to work - Walked (%)
Means of transportation to work - Other means (%)
Working at home (%)
Industry diversity
Most Common Industries - Agriculture, forestry, fishing and hunting, and mining (%)
Most Common Industries - Agriculture, forestry, fishing and hunting (%)
Most Common Industries - Mining, quarrying, and oil and gas extraction (%)
Most Common Industries - Construction (%)
Most Common Industries - Manufacturing (%)
Most Common Industries - Wholesale trade (%)
Most Common Industries - Retail trade (%)
Most Common Industries - Transportation and warehousing, and utilities (%)
Most Common Industries - Transportation and warehousing (%)
Most Common Industries - Utilities (%)
Most Common Industries - Information (%)
Most Common Industries - Finance and insurance, and real estate and rental and leasing (%)
Most Common Industries - Finance and insurance (%)
Most Common Industries - Real estate and rental and leasing (%)
Most Common Industries - Professional, scientific, and management, and administrative and waste management services (%)
Most Common Industries - Professional, scientific, and technical services (%)
Most Common Industries - Management of companies and enterprises (%)
Most Common Industries - Administrative and support and waste management services (%)
Most Common Industries - Educational services, and health care and social assistance (%)
Most Common Industries - Educational services (%)
Most Common Industries - Health care and social assistance (%)
Most Common Industries - Arts, entertainment, and recreation, and accommodation and food services (%)
Most Common Industries - Arts, entertainment, and recreation (%)
Most Common Industries - Accommodation and food services (%)
Most Common Industries - Other services, except public administration (%)
Most Common Industries - Public administration (%)
Occupation diversity
Most Common Occupations - Management, business, science, and arts occupations (%)
Most Common Occupations - Management, business, and financial occupations (%)
Most Common Occupations - Management occupations (%)
Most Common Occupations - Business and financial operations occupations (%)
Most Common Occupations - Computer, engineering, and science occupations (%)
Most Common Occupations - Computer and mathematical occupations (%)
Most Common Occupations - Architecture and engineering occupations (%)
Most Common Occupations - Life, physical, and social science occupations (%)
Most Common Occupations - Education, legal, community service, arts, and media occupations (%)
Most Common Occupations - Community and social service occupations (%)
Most Common Occupations - Legal occupations (%)
Most Common Occupations - Education, training, and library occupations (%)
Most Common Occupations - Arts, design, entertainment, sports, and media occupations (%)
Most Common Occupations - Healthcare practitioners and technical occupations (%)
Most Common Occupations - Health diagnosing and treating practitioners and other technical occupations (%)
Most Common Occupations - Health technologists and technicians (%)
Most Common Occupations - Service occupations (%)
Most Common Occupations - Healthcare support occupations (%)
Most Common Occupations - Protective service occupations (%)
Most Common Occupations - Fire fighting and prevention, and other protective service workers including supervisors (%)
Most Common Occupations - Law enforcement workers including supervisors (%)
Most Common Occupations - Food preparation and serving related occupations (%)
Most Common Occupations - Building and grounds cleaning and maintenance occupations (%)
Most Common Occupations - Personal care and service occupations (%)
Most Common Occupations - Sales and office occupations (%)
Most Common Occupations - Sales and related occupations (%)
Most Common Occupations - Office and administrative support occupations (%)
Most Common Occupations - Natural resources, construction, and maintenance occupations (%)
Most Common Occupations - Farming, fishing, and forestry occupations (%)
Most Common Occupations - Construction and extraction occupations (%)
Most Common Occupations - Installation, maintenance, and repair occupations (%)
Most Common Occupations - Production, transportation, and material moving occupations (%)
Most Common Occupations - Production occupations (%)
Most Common Occupations - Transportation occupations (%)
Most Common Occupations - Material moving occupations (%)
People in Group quarters - Institutionalized population (%)
People in Group quarters - Correctional institutions (%)
People in Group quarters - Federal prisons and detention centers (%)
People in Group quarters - Halfway houses (%)
People in Group quarters - Local jails and other confinement facilities (including police lockups) (%)
People in Group quarters - Military disciplinary barracks (%)
People in Group quarters - State prisons (%)
People in Group quarters - Other types of correctional institutions (%)
People in Group quarters - Nursing homes (%)
People in Group quarters - Hospitals/wards, hospices, and schools for the handicapped (%)
People in Group quarters - Hospitals/wards and hospices for chronically ill (%)
People in Group quarters - Hospices or homes for chronically ill (%)
People in Group quarters - Military hospitals or wards for chronically ill (%)
People in Group quarters - Other hospitals or wards for chronically ill (%)
People in Group quarters - Hospitals or wards for drug/alcohol abuse (%)
People in Group quarters - Mental (Psychiatric) hospitals or wards (%)
People in Group quarters - Schools, hospitals, or wards for the mentally retarded (%)
People in Group quarters - Schools, hospitals, or wards for the physically handicapped (%)
People in Group quarters - Institutions for the deaf (%)
People in Group quarters - Institutions for the blind (%)
People in Group quarters - Orthopedic wards and institutions for the physically handicapped (%)
People in Group quarters - Wards in general hospitals for patients who have no usual home elsewhere (%)
People in Group quarters - Wards in military hospitals for patients who have no usual home elsewhere (%)
People in Group quarters - Juvenile institutions (%)
People in Group quarters - Long-term care (%)
People in Group quarters - Homes for abused, dependent, and neglected children (%)
People in Group quarters - Residential treatment centers for emotionally disturbed children (%)
People in Group quarters - Training schools for juvenile delinquents (%)
People in Group quarters - Short-term care, detention or diagnostic centers for delinquent children (%)
People in Group quarters - Type of juvenile institution unknown (%)
People in Group quarters - Noninstitutionalized population (%)
People in Group quarters - College dormitories (includes college quarters off campus) (%)
People in Group quarters - Military quarters (%)
People in Group quarters - On base (%)
People in Group quarters - Barracks, unaccompanied personnel housing (UPH), (Enlisted/Officer), ;and similar group living quarters for military personnel (%)
People in Group quarters - Transient quarters for temporary residents (%)
People in Group quarters - Military ships (%)
People in Group quarters - Group homes (%)
People in Group quarters - Homes or halfway houses for drug/alcohol abuse (%)
People in Group quarters - Homes for the mentally ill (%)
People in Group quarters - Homes for the mentally retarded (%)
People in Group quarters - Homes for the physically handicapped (%)
People in Group quarters - Other group homes (%)
People in Group quarters - Religious group quarters (%)
People in Group quarters - Dormitories (%)
People in Group quarters - Agriculture workers' dormitories on farms (%)
People in Group quarters - Job Corps and vocational training facilities (%)
People in Group quarters - Other workers' dormitories (%)
People in Group quarters - Crews of maritime vessels (%)
People in Group quarters - Other nonhousehold living situations (%)
People in Group quarters - Other noninstitutional group quarters (%)
Residents speaking English at home (%)
Residents speaking English at home - Born in the United States (%)
Residents speaking English at home - Native, born elsewhere (%)
Residents speaking English at home - Foreign born (%)
Residents speaking Spanish at home (%)
Residents speaking Spanish at home - Born in the United States (%)
Residents speaking Spanish at home - Native, born elsewhere (%)
Residents speaking Spanish at home - Foreign born (%)
Residents speaking other language at home (%)
Residents speaking other language at home - Born in the United States (%)
Residents speaking other language at home - Native, born elsewhere (%)
Residents speaking other language at home - Foreign born (%)
Class of Workers - Employee of private company (%)
Class of Workers - Self-employed in own incorporated business (%)
Class of Workers - Private not-for-profit wage and salary workers (%)
Class of Workers - Local government workers (%)
Class of Workers - State government workers (%)
Class of Workers - Federal government workers (%)
Class of Workers - Self-employed workers in own not incorporated business and Unpaid family workers (%)
House heating fuel used in houses and condos - Utility gas (%)
House heating fuel used in houses and condos - Bottled, tank, or LP gas (%)
House heating fuel used in houses and condos - Electricity (%)
House heating fuel used in houses and condos - Fuel oil, kerosene, etc. (%)
House heating fuel used in houses and condos - Coal or coke (%)
House heating fuel used in houses and condos - Wood (%)
House heating fuel used in houses and condos - Solar energy (%)
House heating fuel used in houses and condos - Other fuel (%)
House heating fuel used in houses and condos - No fuel used (%)
House heating fuel used in apartments - Utility gas (%)
House heating fuel used in apartments - Bottled, tank, or LP gas (%)
House heating fuel used in apartments - Electricity (%)
House heating fuel used in apartments - Fuel oil, kerosene, etc. (%)
House heating fuel used in apartments - Coal or coke (%)
House heating fuel used in apartments - Wood (%)
House heating fuel used in apartments - Solar energy (%)
House heating fuel used in apartments - Other fuel (%)
House heating fuel used in apartments - No fuel used (%)
Armed forces status - In Armed Forces (%)
Armed forces status - Civilian (%)
Armed forces status - Civilian - Veteran (%)
Armed forces status - Civilian - Nonveteran (%)
Fatal accidents locations in years 2005-2021
Fatal accidents locations in 2005
Fatal accidents locations in 2006
Fatal accidents locations in 2007
Fatal accidents locations in 2008
Fatal accidents locations in 2009
Fatal accidents locations in 2010
Fatal accidents locations in 2011
Fatal accidents locations in 2012
Fatal accidents locations in 2013
Fatal accidents locations in 2014
Fatal accidents locations in 2015
Fatal accidents locations in 2016
Fatal accidents locations in 2017
Fatal accidents locations in 2018
Fatal accidents locations in 2019
Fatal accidents locations in 2020
Fatal accidents locations in 2021
Alcohol use - People drinking some alcohol every month (%)
Alcohol use - People not drinking at all (%)
Alcohol use - Average days/month drinking alcohol
Alcohol use - Average drinks/week
Alcohol use - Average days/year people drink much
Audiometry - Average condition of hearing (%)
Audiometry - People that can hear a whisper from across a quiet room (%)
Audiometry - People that can hear normal voice from across a quiet room (%)
Audiometry - Ears ringing, roaring, buzzing (%)
Audiometry - Had a job exposure to loud noise (%)
Audiometry - Had off-work exposure to loud noise (%)
Blood Pressure & Cholesterol - Has high blood pressure (%)
Blood Pressure & Cholesterol - Checking blood pressure at home (%)
Blood Pressure & Cholesterol - Frequently checking blood cholesterol (%)
Blood Pressure & Cholesterol - Has high cholesterol level (%)
Consumer Behavior - Money monthly spent on food at supermarket/grocery store
Consumer Behavior - Money monthly spent on food at other stores
Consumer Behavior - Money monthly spent on eating out
Consumer Behavior - Money monthly spent on carryout/delivered foods
Consumer Behavior - Income spent on food at supermarket/grocery store (%)
Consumer Behavior - Income spent on food at other stores (%)
Consumer Behavior - Income spent on eating out (%)
Consumer Behavior - Income spent on carryout/delivered foods (%)
Current Health Status - General health condition (%)
Current Health Status - Blood donors (%)
Current Health Status - Has blood ever tested for HIV virus (%)
Current Health Status - Left-handed people (%)
Dermatology - People using sunscreen (%)
Diabetes - Diabetics (%)
Diabetes - Had a blood test for high blood sugar (%)
Diabetes - People taking insulin (%)
Diet Behavior & Nutrition - Diet health (%)
Diet Behavior & Nutrition - Milk product consumption (# of products/month)
Diet Behavior & Nutrition - Meals not home prepared (#/week)
Diet Behavior & Nutrition - Meals from fast food or pizza place (#/week)
Diet Behavior & Nutrition - Ready-to-eat foods (#/month)
Diet Behavior & Nutrition - Frozen meals/pizza (#/month)
Drug Use - People that ever used marijuana or hashish (%)
Drug Use - Ever used hard drugs (%)
Drug Use - Ever used any form of cocaine (%)
Drug Use - Ever used heroin (%)
Drug Use - Ever used methamphetamine (%)
Health Insurance - People covered by health insurance (%)
Kidney Conditions-Urology - Avg. # of times urinating at night
Medical Conditions - People with asthma (%)
Medical Conditions - People with anemia (%)
Medical Conditions - People with psoriasis (%)
Medical Conditions - People with overweight (%)
Medical Conditions - Elderly people having difficulties in thinking or remembering (%)
Medical Conditions - People who ever received blood transfusion (%)
Medical Conditions - People having trouble seeing even with glass/contacts (%)
Medical Conditions - People with arthritis (%)
Medical Conditions - People with gout (%)
Medical Conditions - People with congestive heart failure (%)
Medical Conditions - People with coronary heart disease (%)
Medical Conditions - People with angina pectoris (%)
Medical Conditions - People who ever had heart attack (%)
Medical Conditions - People who ever had stroke (%)
Medical Conditions - People with emphysema (%)
Medical Conditions - People with thyroid problem (%)
Medical Conditions - People with chronic bronchitis (%)
Medical Conditions - People with any liver condition (%)
Medical Conditions - People who ever had cancer or malignancy (%)
Mental Health - People who have little interest in doing things (%)
Mental Health - People feeling down, depressed, or hopeless (%)
Mental Health - People who have trouble sleeping or sleeping too much (%)
Mental Health - People feeling tired or having little energy (%)
Mental Health - People with poor appetite or overeating (%)
Mental Health - People feeling bad about themself (%)
Mental Health - People who have trouble concentrating on things (%)
Mental Health - People moving or speaking slowly or too fast (%)
Mental Health - People having thoughts they would be better off dead (%)
Oral Health - Average years since last visit a dentist
Oral Health - People embarrassed because of mouth (%)
Oral Health - People with gum disease (%)
Oral Health - General health of teeth and gums (%)
Oral Health - Average days a week using dental floss/device
Oral Health - Average days a week using mouthwash for dental problem
Oral Health - Average number of teeth
Pesticide Use - Households using pesticides to control insects (%)
Pesticide Use - Households using pesticides to kill weeds (%)
Physical Activity - People doing vigorous-intensity work activities (%)
Physical Activity - People doing moderate-intensity work activities (%)
Physical Activity - People walking or bicycling (%)
Physical Activity - People doing vigorous-intensity recreational activities (%)
Physical Activity - People doing moderate-intensity recreational activities (%)
Physical Activity - Average hours a day doing sedentary activities
Physical Activity - Average hours a day watching TV or videos
Physical Activity - Average hours a day using computer
Physical Functioning - People having limitations keeping them from working (%)
Physical Functioning - People limited in amount of work they can do (%)
Physical Functioning - People that need special equipment to walk (%)
Physical Functioning - People experiencing confusion/memory problems (%)
Physical Functioning - People requiring special healthcare equipment (%)
Prescription Medications - Average number of prescription medicines taking
Preventive Aspirin Use - Adults 40+ taking low-dose aspirin (%)
Reproductive Health - Vaginal deliveries (%)
Reproductive Health - Cesarean deliveries (%)
Reproductive Health - Deliveries resulted in a live birth (%)
Reproductive Health - Pregnancies resulted in a delivery (%)
Reproductive Health - Women breastfeeding newborns (%)
Reproductive Health - Women that had a hysterectomy (%)
Reproductive Health - Women that had both ovaries removed (%)
Reproductive Health - Women that have ever taken birth control pills (%)
Reproductive Health - Women taking birth control pills (%)
Reproductive Health - Women that have ever used Depo-Provera or injectables (%)
Reproductive Health - Women that have ever used female hormones (%)
Sexual Behavior - People 18+ that ever had sex (vaginal, anal, or oral) (%)
Sexual Behavior - Males 18+ that ever had vaginal sex with a woman (%)
Sexual Behavior - Males 18+ that ever performed oral sex on a woman (%)
Sexual Behavior - Males 18+ that ever had anal sex with a woman (%)
Sexual Behavior - Males 18+ that ever had any sex with a man (%)
Sexual Behavior - Females 18+ that ever had vaginal sex with a man (%)
Sexual Behavior - Females 18+ that ever performed oral sex on a man (%)
Sexual Behavior - Females 18+ that ever had anal sex with a man (%)
Sexual Behavior - Females 18+ that ever had any kind of sex with a woman (%)
Sexual Behavior - Average age people first had sex
Sexual Behavior - Average number of female sex partners in lifetime (males 18+)
Sexual Behavior - Average number of female vaginal sex partners in lifetime (males 18+)
Sexual Behavior - Average age people first performed oral sex on a woman (18+)
Sexual Behavior - Average number of woman performed oral sex on in lifetime (18+)
Sexual Behavior - Average number of male sex partners in lifetime (males 18+)
Sexual Behavior - Average number of male anal sex partners in lifetime (males 18+)
Sexual Behavior - Average age people first performed oral sex on a man (18+)
Sexual Behavior - Average number of male oral sex partners in lifetime (18+)
Sexual Behavior - People using protection when performing oral sex (%)
Sexual Behavior - Average number of times people have vaginal or anal sex a year
Sexual Behavior - People having sex without condom (%)
Sexual Behavior - Average number of male sex partners in lifetime (females 18+)
Sexual Behavior - Average number of male vaginal sex partners in lifetime (females 18+)
Sexual Behavior - Average number of female sex partners in lifetime (females 18+)
Sexual Behavior - Circumcised males 18+ (%)
Sleep Disorders - Average hours sleeping at night
Sleep Disorders - People that has trouble sleeping (%)
Smoking-Cigarette Use - People smoking cigarettes (%)
Taste & Smell - People 40+ having problems with smell (%)
Taste & Smell - People 40+ having problems with taste (%)
Taste & Smell - People 40+ that ever had wisdom teeth removed (%)
Taste & Smell - People 40+ that ever had tonsils teeth removed (%)
Taste & Smell - People 40+ that ever had a loss of consciousness because of a head injury (%)
Taste & Smell - People 40+ that ever had a broken nose or other serious injury to face or skull (%)
Taste & Smell - People 40+ that ever had two or more sinus infections (%)
Weight - Average height (inches)
Weight - Average weight (pounds)
Weight - Average BMI
Weight - People that are obese (%)
Weight - People that ever were obese (%)
Weight - People trying to lose weight (%)
100%
urban population.
Estimated median house/condo value in 2022: $170,504
48135:
$170,504Michigan:
$224,400
According to our research of Michigan and other state lists, there were 63 registered sex offenders living in 48135 zip code as of April 27, 2024 . The ratio of all residents to sex offenders in zip code 48135 is 435 to 1.The ratio of registered sex offenders to all residents in this zip code is lower than the state average.
Median resident age: This zip code:
41.3 yearsMichigan median age:
40.3 years
Average household size: This zip code:
2.4 peopleMichigan:
2.4 people
Averages for the 2020 tax year for zip code 48135, filed in 2021:
Average Adjusted Gross Income (AGI) in 2020: $47,874 (Individual Income Tax Returns) Here:
$47,874State:
$68,945
Salary/wage: $44,449 (reported on 79.2% of returns )Here:
$44,449State:
$57,142
(% of AGI for various income ranges: 915.1% for AGIs below $25k , 3288.8% for AGIs $25k-50k , 6246.8% for AGIs $50k-75k , 9013.7% for AGIs $75k-100k , 16258.2% for AGIs $100k-200k , 57283.3% for AGIs over 200k ) Taxable interest for individuals: $641 (reported on 24.5% of returns )This zip code:
$641Michigan:
$1,630
(% of AGI for various income ranges: 10.6% for AGIs below $25k , 11.8% for AGIs $25k-50k , 23.5% for AGIs $50k-75k , 32.2% for AGIs $75k-100k , 74.9% for AGIs $100k-200k , 373.3% for AGIs over 200k ) Ordinary dividends: $1,821 (reported on 11.5% of returns )(% of AGI for various income ranges: 14.8% for AGIs below $25k , 15.2% for AGIs $25k-50k , 35.6% for AGIs $50k-75k , 54.1% for AGIs $75k-100k , 70.7% for AGIs $100k-200k , 566.7% for AGIs over 200k ) Net capital gain/loss in AGI: +$3,328 (reported on 10.5% of returns )Here:
+$3,328State:
+$20,064
(% of AGI for various income ranges: 6.9% for AGIs below $25k , 10.7% for AGIs $25k-50k , 40.5% for AGIs $50k-75k , 109.7% for AGIs $75k-100k , 203.9% for AGIs $100k-200k , 2926.7% for AGIs over 200k ) Profit/loss from business: +$6,603 (reported on 12.1% of returns )Here:
+$6,603State:
+$11,172
(% of AGI for various income ranges: 87.7% for AGIs below $25k , 75.0% for AGIs $25k-50k , 75.3% for AGIs $50k-75k , 151.2% for AGIs $75k-100k , 365.9% for AGIs $100k-200k ) Taxable individual retirement arrangement distribution: $13,203 (reported on 7.5% of returns )48135:
$13,203Michigan:
$19,803
(% of AGI for various income ranges: 53.9% for AGIs below $25k , 72.6% for AGIs $25k-50k , 158.0% for AGIs $50k-75k , 213.1% for AGIs $75k-100k , 587.0% for AGIs $100k-200k ) Total itemized deductions: $23,111 (reported on 3.1% of returns )Here:
$23,111State:
$34,117
(% of AGI for various income ranges: 21.2% for AGIs below $25k , 44.5% for AGIs $25k-50k , 133.7% for AGIs $50k-75k , 175.1% for AGIs $75k-100k , 451.0% for AGIs $100k-200k ) Charity contributions: $6,791 (reported on 2.3% of returns )(% of AGI for various income ranges: 1.3% for AGIs below $25k , 8.2% for AGIs $25k-50k , 30.9% for AGIs $50k-75k , 39.3% for AGIs $75k-100k , 112.2% for AGIs $100k-200k ) Taxes paid: $6,507 (reported on 3.1% of returns )(% of AGI for various income ranges: 3.6% for AGIs below $25k , 11.7% for AGIs $25k-50k , 38.7% for AGIs $50k-75k , 61.6% for AGIs $75k-100k , 121.2% for AGIs $100k-200k ) Earned income credit: $2,042 (reported on 14.1% of returns )(% of AGI for various income ranges: 69.6% for AGIs below $25k , 52.2% for AGIs $25k-50k , 0.9% for AGIs $50k-75k ) Percentage of individuals using paid preparers for their 2020 taxes: 93.8%(% for various income ranges: 93.5% for AGIs below $25k , 94.3% for AGIs $25k-50k , 94.3% for AGIs $50k-75k , 93.2% for AGIs $75k-100k , 93.2% for AGIs $100k-200k , 90.0% for AGIs over 200k )
Averages for the 2012 tax year for zip code 48135, filed in 2013:
Average Adjusted Gross Income (AGI) in 2012: $39,827 (Individual Income Tax Returns) Here:
$39,827State:
$55,609
Salary/wage: $37,516 (reported on 82.3% of returns )Here:
$37,516State:
$46,782
(% of AGI for various income ranges: 66.0% for AGIs below $25k , 75.8% for AGIs $25k-50k , 80.0% for AGIs $50k-75k , 82.0% for AGIs $75k-100k , 83.2% for AGIs $100k-200k , 55.6% for AGIs over 200k ) Taxable interest for individuals: $596 (reported on 30.6% of returns )This zip code:
$596Michigan:
$1,491
(% of AGI for various income ranges: 1.0% for AGIs below $25k , 0.6% for AGIs $25k-50k , 0.4% for AGIs $50k-75k , 0.3% for AGIs $75k-100k , 0.2% for AGIs $100k-200k , 0.6% for AGIs over 200k ) Ordinary dividends: $1,494 (reported on 14.2% of returns )(% of AGI for various income ranges: 1.0% for AGIs below $25k , 0.6% for AGIs $25k-50k , 0.4% for AGIs $50k-75k , 0.4% for AGIs $75k-100k , 0.4% for AGIs $100k-200k , 0.9% for AGIs over 200k ) Net capital gain/loss in AGI: +$713 (reported on 9.1% of returns )(% of AGI for various income ranges: 0.2% for AGIs $50k-75k , 0.2% for AGIs $75k-100k , 0.7% for AGIs $100k-200k ) Profit/loss from business: +$7,871 (reported on 10.4% of returns )Here:
+$7,871State:
+$11,523
(% of AGI for various income ranges: 7.0% for AGIs below $25k , 1.8% for AGIs $25k-50k , 1.1% for AGIs $50k-75k , 0.9% for AGIs $75k-100k , 1.7% for AGIs $100k-200k ) Taxable individual retirement arrangement distribution: $10,447 (reported on 9.7% of returns )48135:
$10,447Michigan:
$15,298
(% of AGI for various income ranges: 2.9% for AGIs below $25k , 2.2% for AGIs $25k-50k , 2.2% for AGIs $50k-75k , 2.3% for AGIs $75k-100k , 3.8% for AGIs $100k-200k ) Total itemized deductions: $15,052 (22% of AGI, reported on 26.0% of returns )Here:
$15,052State:
$21,628
Here:
21.8% of AGIState:
18.4% of AGI
(% of AGI for various income ranges: 7.1% for AGIs below $25k , 8.7% for AGIs $25k-50k , 9.9% for AGIs $50k-75k , 11.2% for AGIs $75k-100k , 11.5% for AGIs $100k-200k , 11.3% for AGIs over 200k ) Charity contributions: $2,106 (reported on 20.7% of returns )(% of AGI for various income ranges: 0.6% for AGIs below $25k , 0.9% for AGIs $25k-50k , 1.0% for AGIs $50k-75k , 1.3% for AGIs $75k-100k , 1.6% for AGIs $100k-200k , 1.8% for AGIs over 200k ) Taxes paid: $5,370 (reported on 26.0% of returns )(% of AGI for various income ranges: 1.7% for AGIs below $25k , 2.7% for AGIs $25k-50k , 3.4% for AGIs $50k-75k , 4.3% for AGIs $75k-100k , 4.9% for AGIs $100k-200k , 5.1% for AGIs over 200k ) Earned income credit: $2,036 (reported on 17.4% of returns )(% of AGI for various income ranges: 5.3% for AGIs below $25k , 0.9% for AGIs $25k-50k ) Percentage of individuals using paid preparers for their 2012 taxes: 53.2%(% for various income ranges: 49.5% for AGIs below $25k , 54.2% for AGIs $25k-50k , 56.3% for AGIs $50k-75k , 57.4% for AGIs $75k-100k , 61.6% for AGIs $100k-200k , 60.0% for AGIs over 200k )
Averages for the 2004 tax year for zip code 48135, filed in 2005:
Average Adjusted Gross Income (AGI) in 2004: $40,534 (Individual Income Tax Returns) Here:
$40,534State:
$48,204
Salary/wage: $39,418 (reported on 85.7% of returns )Here:
$39,418State:
$42,791
(% of AGI for various income ranges: 79.3% for AGIs below $10k , 64.6% for AGIs $10k-25k , 80.3% for AGIs $25k-50k , 86.7% for AGIs $50k-75k , 89.7% for AGIs $75k-100k , 84.7% for AGIs over 100k ) Taxable interest for individuals: $837 (reported on 47.7% of returns )This zip code:
$837Michigan:
$1,725
(% of AGI for various income ranges: 3.9% for AGIs below $10k , 2.4% for AGIs $10k-25k , 1.1% for AGIs $25k-50k , 0.7% for AGIs $50k-75k , 0.5% for AGIs $75k-100k , 0.8% for AGIs over 100k ) Taxable dividends: $1,067 (reported on 21.0% of returns )(% of AGI for various income ranges: 2.2% for AGIs below $10k , 1.3% for AGIs $10k-25k , 0.6% for AGIs $25k-50k , 0.4% for AGIs $50k-75k , 0.4% for AGIs $75k-100k , 0.3% for AGIs over 100k ) Net capital gain/loss: +$1,644 (reported on 13.3% of returns )Here:
+$1,644State:
+$8,532
(% of AGI for various income ranges: -1.8% for AGIs below $10k , -0.1% for AGIs $10k-25k , 0.2% for AGIs $25k-50k , 0.4% for AGIs $50k-75k , 0.4% for AGIs $75k-100k , 2.1% for AGIs over 100k ) Profit/loss from business: +$6,056 (reported on 9.3% of returns )Here:
+$6,056State:
+$9,547
(% of AGI for various income ranges: 5.2% for AGIs below $10k , 4.1% for AGIs $10k-25k , 1.5% for AGIs $25k-50k , 0.9% for AGIs $50k-75k , 0.9% for AGIs $75k-100k , 0.7% for AGIs over 100k ) IRA payment deduction: $2,278 (reported on 1.6% of returns )48135:
$2,278Michigan:
$2,875
(% of AGI for various income ranges: 0.2% for AGIs $10k-25k , 0.1% for AGIs $25k-50k , 0.1% for AGIs $50k-75k , 0.0% for AGIs $75k-100k , 0.1% for AGIs over 100k ) Self-employed pension: $4,353 (reported on 0.1% of returns )Here:
$4,353Michigan:
$13,826
Total itemized deductions: $14,485 (23% of AGI, reported on 41.6% of returns )Here:
$14,485State:
$18,509
Here:
23.3% of AGIState:
20.7% of AGI
(% of AGI for various income ranges: 11.2% for AGIs below $10k , 11.3% for AGIs $10k-25k , 15.1% for AGIs $25k-50k , 16.5% for AGIs $50k-75k , 15.2% for AGIs $75k-100k , 13.9% for AGIs over 100k ) Charity contributions deductions: $1,769 (3% of AGI, reported on 37.1% of returns )Here:
2.8% of AGIState:
3.6% of AGI
(% of AGI for various income ranges: 0.5% for AGIs below $10k , 1.2% for AGIs $10k-25k , 1.5% for AGIs $25k-50k , 1.7% for AGIs $50k-75k , 1.8% for AGIs $75k-100k , 1.8% for AGIs over 100k ) Total tax: $4,611 (reported on 79.3% of returns )(% of AGI for various income ranges: 2.9% for AGIs below $10k , 4.3% for AGIs $10k-25k , 7.1% for AGIs $25k-50k , 8.7% for AGIs $50k-75k , 10.2% for AGIs $75k-100k , 14.4% for AGIs over 100k ) Earned income credit: $1,345 (reported on 9.7% of returns )Percentage of individuals using paid preparers for their 2004 taxes: 58.3%(% for various income ranges: 50.2% for AGIs below $10k , 58.5% for AGIs $10k-25k , 59.9% for AGIs $25k-50k , 61.7% for AGIs $50k-75k , 60.3% for AGIs $75k-100k , 62.0% for AGIs over 100k )
Estimated median household income in 2022: This zip code:
$62,219Michigan:
$66,986
Nearest zip codes: 48141 ,
48186 ,
48185 ,
48127 ,
48150 ,
48184 .
Garden City Zip Code Map
Percentage of family households: This zip code:
46.6%Michigan:
43.3%
Percentage of households with unmarried partners: This zip code:
6.7%Michigan:
45.7%
Likely homosexual households (counted as self-reported same-sex unmarried-partner households)
Lesbian couples: 0.2% of all households Gay men: 0.2% of all households
Household received Food Stamps/SNAP in the past 12 months: 1,136Household did not receive Food Stamps/SNAP in the past 12 months: 10,079
Women who had a birth in the past 12 months: 326 (182 now married , 141 unmarried) Women who did not have a birth in the past 12 months: 5,890 (2,541 now married , 3,343 unmarried)
Housing units in zip code 48135 with a mortgage: 5,811 (459
second mortgage , 42
home equity loan , 339
both second mortgage and home equity loan )
Houses without a mortgage: 549
Median monthly owner costs for units with a mortgage: $1,211
Median monthly owner costs for units without a mortgage: $556
Residents with income below the poverty level in 2022:
This zip code:
11.1%Whole state:
13.4%
Residents with income below 50% of the poverty level in 2022:
This zip code:
5.0%Whole state:
6.9%
Median number of rooms in houses and condos: Median number of rooms in apartments:
Year house built (houses)
0 2020 or later32 2010 to 2019194 2000 to 2009214 1990 to 1999325 1980 to 19891,194 1970 to 19791,415 1960 to 19696,127 1950 to 19591,084 1940 to 1949511 1939 or earlier
Zip code 48135 household income distribution in 2022 586 Less than $10,000207 $10,000 to $14,999352 $15,000 to $19,999457 $20,000 to $24,999325 $25,000 to $29,999712 $30,000 to $34,999517 $35,000 to $39,999557 $40,000 to $44,999702 $45,000 to $49,999833 $50,000 to $59,9991,331 $60,000 to $74,9991,750 $75,000 to $99,9991,195 $100,000 to $124,999945 $125,000 to $149,999539 $150,000 to $199,999236 $200,000 or moreEstimate of home value of owner-occupied houses/condos in 2022 in zip code 48135 93 Less than $10,00068 $10,000 to $14,99960 $15,000 to $19,9994 $20,000 to $24,99919 $30,000 to $34,99910 $35,000 to $39,99956 $40,000 to $49,99970 $50,000 to $59,99984 $60,000 to $69,999243 $70,000 to $79,999175 $80,000 to $89,999137 $90,000 to $99,9991,013 $100,000 to $124,9991,486 $125,000 to $149,9992,620 $150,000 to $174,9991,017 $175,000 to $199,999725 $200,000 to $249,999184 $250,000 to $299,999114 $300,000 to $399,9996 $400,000 to $499,99925 $500,000 to $749,99927 $1,000,000 to $1,499,99910 $2,000,000 or moreRent paid by renters in 2022 in zip code 48135 21 Less than $10047 $150 to $19987 $200 to $2498 $250 to $29936 $300 to $34919 $450 to $49911 $500 to $54914 $550 to $59954 $600 to $649244 $650 to $699257 $700 to $749153 $750 to $799144 $800 to $899121 $900 to $999386 $1,000 to $1,249244 $1,250 to $1,49981 $1,500 to $1,999216 No cash rent
Median gross rent in 2022: $964.
Median price asked for vacant for-sale houses and condos in 2022: $105,185.
Estimated median house (or condo) value in 2022 for: White Non-Hispanic householders: $170,349Black or African American householders: $224,769American Indian or Alaska Native householders: $187,924Asian householders: $142,908Native Hawaiian and other Pacific Islander householders: $131,038Some other race householders: $231,243Two or more races householders: $209,352Hispanic or Latino householders: $186,999Estimated median house or condo value in 2022: $170,504
48135:
$170,504Michigan:
$224,400
Lower value quartile - upper value quartile: $138,987 - $194,312
Mean price in 2022: Detached houses: $224,022Here:
$224,022State:
$280,038
Townhouses or other attached units: $216,234Here:
$216,234State:
$239,520
In 2-unit structures: $134,871Here:
$134,871State:
$219,481
In 3-to-4-unit structures: $285,054Here:
$285,054State:
$207,067
In 5-or-more-unit structures: $213,027Here:
$213,027State:
$192,733
Mobile homes: $53,538Here:
$53,538State:
$72,868
Occupied boats, RVs, vans, etc.: $38,621Here:
$38,621State:
$102,281
Housing units in structures:
One, detached: 10,257One, attached: 57Two: 83 or 4: 585 to 9: 35010 to 19: 33220 to 49: 10250 or more: 146Mobile homes: 42Unemployment : 6.1%
Means of transportation to work in zip code 48135 80.1% 10,709 Drove a car alone8.0% 1,074 Carpooled0.2% 26 Bus or trolley bus0.1% 20 Taxi0.2% 30 Bicycle0.3% 43 Walked1.2% 161 Other means8.5% 1,139 Worked at homeTravel time to work (commute) in zip code 48135 215 Less than 5 minutes1,500 5 to 9 minutes1,054 10 to 14 minutes1,620 15 to 19 minutes2,164 20 to 24 minutes945 25 to 29 minutes1,767 30 to 34 minutes471 35 to 39 minutes709 40 to 44 minutes777 45 to 59 minutes507 60 to 89 minutes309 90 or more minutes
Neighborhoods in zip code 48135: Percentage of zip code residents living and working in this county: 80.7%
Household type by relationship:
Households: 27,138
Male householders: 5,553 (1,678 living alone ), Female householders: 5,692 (1,692 living alone )4,733 spouses (4,706 opposite-sex spouses ), 966 unmarried partners , (944 opposite-sex unmarried partners ), 7,455 children (6,880 natural , 53 adopted , 527 stepchildren ), 743 grandchildren , 340 brothers or sisters , 526 parents , 28 foster children , 355 other relatives , 685 non-relatives In group quarters: 53 (-1 institutionalized population )
Size of family households: 3,103 2-persons , 1,969 3-persons , 1,245 4-persons , 646 5-persons , 160 6-persons , 31 7-or-more-persons
Size of nonfamily households: 3,368 1-person , 606 2-persons , 40 3-persons , 50 4-persons
3,076 married couples with children. single-parent households (583 men , 905 women ).
93.1% of residents of 48135 zip code speak English at home. of residents speak Spanish at home (92% very well, 3% well, 5% not well ).of residents speak other Indo-European language at home (78% very well, 10% well, 10% not well, 2% not at all ).of residents speak Asian or Pacific Island language at home (39% very well, 48% well, 13% not well ).of residents speak other language at home (85% very well, 6% well, 5% not well, 4% not at all ).
Foreign born population: 1,170 (4.3%)
(74.2%
of them are naturalized citizens )
This zip code:
4.3%Whole state:
6.9%
23% Georgia 7% Malaysia 5% Sweden 4% France 4% Croatia 4% North Macedonia (Macedonia) 3% Honduras 13% American 12% Polish 9% German 8% European 7% Irish 7% English 3% Italian
Year of entry for the foreign-born population
356 2010 or later 308 2000 to 2009 301 1990 to 1999 268 Before 1990
There are
301 Other Medical Specialists in Zip Code 48135.
Major facilities with environmental interests located in this zip code:
EXTRUSION PAINTING (32800 INDUSTRIAL BLVD in GARDEN, MI)
AIR MINOR (AIRS/AFS) (Integrated Compliance Information System) - ICIS-05-1985-0556, FORMAL ENFORCEMENT ACTION (Resource Conservation and Recovery Act (tracking hazardous waste)) Business SIC classification: PAINTING AND PAPER HANGING; COATING, ENGRAVING, AND ALLIED SERVICESOrganizations: EXTRUSION PAINTING INC (CONTACT/OWNER)
DOUGLAS SCHOOL (6400 HARTEL STREET in GARDEN CITY, MI)
(Geographic Names Information System) (National Center for Education Statistics) - STATE ID-00944 Organizations: GARDEN CITY SCHOOL DISTRICT (SCHOOL DISTRICT)
GARDEN CITY HIGH SCHOOL (6500 MIDDLEBELT ROAD in GARDEN CITY, MI)
(Geographic Names Information System) (National Center for Education Statistics) - STATE ID-01359 Organizations: GARDEN CITY SCHOOL DISTRICT (SCHOOL DISTRICT)
DYNAMIC POWER SYSTEMS (36206 INDUSTRIAL ROAD in GARDEN CITY, MI)
(Integrated Compliance Information System) - ICIS-05-1987-0447, FORMAL ENFORCEMENT ACTION COMPLIANCE ACTIVITY (Tracking inspections of insecticide, fungicide, and rodenticide, and toxic substances) Business SIC classification: ELECTRICAL APPARATUS AND EQUIPMENT, WIRING SUPPLIES, AND CONSTRUCTION MATERIALS; ARMATURE REWINDING SHOPS
MEMORIAL ELEMENTARY SCHOOL (30001 MARQUETTE STREET in GARDEN CITY, MI)
(National Center for Education Statistics) - STATE ID-02508 Organizations: GARDEN CITY SCHOOL DISTRICT (SCHOOL DISTRICT)
FARMINGTON ELEMENTARY SCHOOL (33411 MARQUETTE STREET in GARDEN CITY, MI)
(National Center for Education Statistics) - STATE ID-01205 Organizations: GARDEN CITY SCHOOL DISTRICT (SCHOOL DISTRICT)
GARDEN CITY MIDDLE SCHOOL (1851 RADCLIFF STREET in GARDEN CITY, MI)
(National Center for Education Statistics) - STATE ID-04463 Organizations: GARDEN CITY SCHOOL DISTRICT (SCHOOL DISTRICT)
MI DEPT/TRANSPORTATION (FORD RD FROM ARCOLA AVE TO VER in GARDEN CITY, MI)
(Resource Conservation and Recovery Act (tracking hazardous waste)) Organizations: MIDOT (CONTACT/OWNER)
AMOCO OIL CO 2318 (29435 FORD in GARDEN CITY, MI)
(Resource Conservation and Recovery Act (tracking hazardous waste)) Organizations: AMOCO OIL COMPANY (CONTACT/OWNER)
AMOCO OIL CO 7299 (6135 ELMWOOD in GARDEN CITY, MI)
(Resource Conservation and Recovery Act (tracking hazardous waste)) Organizations: AMOCO OIL COMPANY (CONTACT/OWNER)
MI DEPT/TRANSPORTATION (M-135 TO VERNON ST in GARDEN CITY, MI)
(Resource Conservation and Recovery Act (tracking hazardous waste))
Housing units lacking complete plumbing facilities: 0.3%
Housing units lacking complete kitchen facilities: 0.3%
91.3% Utility gas 6.9% Electricity 0.9% Bottled, tank, or LP gas 0.5% No fuel used
Population in 1990: 31,846.
Place of birth for U.S.-born residents:
This state: 22,928Northeast: 405Midwest: 668South: 1,214West: 634
69% of the 48135 zip code residents lived in the same house 5 years ago.
Out of people who lived in different houses, 82% lived in this county.
Out of people who lived in different counties, 50% lived in Michigan.
92% of the 48135 zip code residents lived in the same house 1 year ago.
Out of people who lived in different houses, 78% moved from this county.
Out of people who lived in different houses, 16% moved from different county within same state.
Out of people who lived in different houses, 4% moved from different state.
Private vs. public school enrollment:
Students in private schools in grades 1 to 8 (elementary and middle school): 285
Students in private schools in grades 9 to 12 (high school): 127
Students in private undergraduate colleges: 100
Occupation by median earnings in the past 12 months ($)
82,891 Life, physical, and social science occupations 79,129 Computer and mathematical occupations 73,766 Legal occupations 67,700 Architecture and engineering occupations 63,873 Health diagnosing and treating practitioners and other technical occupations 62,736 Arts, design, entertainment, sports, and media occupations
Companies with federal contracts located in this zip code (GARDEN CITY, MI):
HYTROL MANUFACTURING INC (32863 MANOR PARK; small business) in 2 contracts from 2001 to 2006
$56,016 with Defense Logistics Agency for Bearings, Antifriction, Unmounted. Signed on 2001-01-22. Completion date: 2001-05-22.
with Defense Logistics Agency for Coil, Flat, Leaf, and Wire Springs. Signed on 2006-04-21. Completion date: 2006-07-29.
SAF-AIR PRODUCTS, INC (32839 MANOR PARK DRIVE; small business)
$6,065 with Army for Valves, Powered. Signed on 2002-09-10. Completion date: 2002-10-25.
KENS LANDSCAPING (1011 HENRY RUFF; small business) in 2 contracts in 2003
$4,650 with Army for Landscaping/Groundskeeping Services. Signed on 2003-03-14. Completion date: 2004-03-31.
, same as above. Signed on 2003-03-14. Completion date: 2004-03-31.
DEARBORN GAGE COMPANY (32330 FORD ROAD; small business) in 3 contracts from 2000 to 2001
$96,462 with Air Force for Other Defense -- Management and Support (R&D). Signed on 2000-05-03. Completion date: 2000-12-02.
, same as above. Signed on 2000-09-12. Completion date: 2000-12-11.
with Air Force for Weapons -- Management and Support (R&D). Signed on 2001-04-27. Completion date: 2001-04-27.
Top industries in this zip code by the number of employees in 2005:
Health Care and Social Assistance: General Medical and Surgical Hospitals (over 1000 employees: 1 establishment)Accommodation and Food Services: Limited-Service Restaurants (50-99: 2, 20-49: 8, 10-19: 1, 5-9: 2, 1-4: 6)Health Care and Social Assistance: Offices of Physicians (except Mental Health Specialists) (20-49: 4, 10-19: 5, 5-9: 9, 1-4: 18)Administrative and Support and Waste Management and Remediation Services: Professional Employer Organizations (100-249: 1)Accommodation and Food Services: Full-Service Restaurants (20-49: 1, 10-19: 5, 5-9: 3, 1-4: 9)Health Care and Social Assistance: Offices of Dentists (20-49: 1, 10-19: 1, 5-9: 8, 1-4: 8)Health Care and Social Assistance: Residential Mental Retardation Facilities (10-19: 5, 5-9: 2, 1-4: 1)
People in group quarters in 2010:
31 people in group homes intended for adults
22 people in residential treatment centers for adults
People in group quarters in 2000:
6 people in other noninstitutional group quarters
5 people in homes for the mentally retarded
5 people in religious group quarters
Fatal accident statistics in 2014:
Fatal accident count: 2Vehicles involved in fatal accidents: 3Fatal accidents caused by drunken drivers: 0Fatalities: 2Persons involved in fatal accidents: 6Pedestrians involved in fatal accidents: 0
Fatal accident statistics in 2013:
Fatal accident count: 1Vehicles involved in fatal accidents: 2Fatal accidents caused by drunken drivers: 0Fatalities: 1Persons involved in fatal accidents: 2Pedestrians involved in fatal accidents: 0
Home Mortgage Disclosure Act Aggregated Statistics For Year 2009(Based on 18 full tracts) A) FHA, FSA/RHS & VA B) Conventional C) Refinancings D) Home Improvement Loans F) Non-occupant Loans on G) Loans On Manufactured Number Average Value Number Average Value Number Average Value Number Average Value Number Average Value Number Average Value
LOANS ORIGINATED 327 $72,279 87 $47,203 460 $106,717 34 $17,761 67 $53,515 2 $3,990 APPLICATIONS APPROVED, NOT ACCEPTED 38 $70,257 10 $88,183 53 $109,204 16 $9,662 6 $56,563 0 $0 APPLICATIONS DENIED 71 $62,068 32 $40,139 241 $109,558 65 $24,012 32 $59,972 2 $55,645 APPLICATIONS WITHDRAWN 33 $63,863 12 $59,195 83 $115,515 6 $53,663 2 $51,670 0 $0 FILES CLOSED FOR INCOMPLETENESS 12 $74,385 4 $52,000 30 $118,246 4 $34,938 6 $54,333 0 $0
Aggregated Statistics For Year 2008(Based on 18 full tracts) A) FHA, FSA/RHS & VA B) Conventional C) Refinancings D) Home Improvement Loans E) Loans on Dwellings For 5+ Families F) Non-occupant Loans on G) Loans On Manufactured Number Average Value Number Average Value Number Average Value Number Average Value Number Average Value Number Average Value Number Average Value
LOANS ORIGINATED 290 $90,560 156 $72,170 446 $103,746 63 $32,304 6 $388,818 87 $71,874 4 $20,918 APPLICATIONS APPROVED, NOT ACCEPTED 30 $86,605 28 $59,203 73 $119,503 18 $8,133 0 $0 14 $70,021 8 $28,154 APPLICATIONS DENIED 65 $93,454 55 $58,454 547 $119,689 108 $31,563 0 $0 73 $83,657 8 $28,492 APPLICATIONS WITHDRAWN 16 $101,052 14 $99,962 140 $118,152 2 $36,980 0 $0 12 $101,796 0 $0 FILES CLOSED FOR INCOMPLETENESS 6 $85,145 6 $94,135 57 $124,883 6 $37,275 0 $0 4 $111,925 0 $0
Aggregated Statistics For Year 2007(Based on 18 full tracts) A) FHA, FSA/RHS & VA B) Conventional C) Refinancings D) Home Improvement Loans E) Loans on Dwellings For 5+ Families F) Non-occupant Loans on G) Loans On Manufactured Number Average Value Number Average Value Number Average Value Number Average Value Number Average Value Number Average Value Number Average Value
LOANS ORIGINATED 101 $118,012 528 $93,472 968 $102,579 150 $35,742 4 $749,620 110 $81,492 4 $16,845 APPLICATIONS APPROVED, NOT ACCEPTED 4 $99,798 99 $97,016 239 $105,731 16 $34,491 0 $0 28 $106,890 2 $31,535 APPLICATIONS DENIED 20 $149,354 150 $99,686 1,002 $116,024 187 $46,820 0 $0 53 $71,003 4 $8,498 APPLICATIONS WITHDRAWN 2 $85,050 49 $102,174 315 $120,376 20 $56,323 0 $0 32 $110,117 0 $0 FILES CLOSED FOR INCOMPLETENESS 0 $0 20 $109,771 101 $123,766 2 $169,615 0 $0 8 $106,181 0 $0
Aggregated Statistics For Year 2006(Based on 18 full tracts) A) FHA, FSA/RHS & VA B) Conventional C) Refinancings D) Home Improvement Loans E) Loans on Dwellings For 5+ Families F) Non-occupant Loans on G) Loans On Manufactured Number Average Value Number Average Value Number Average Value Number Average Value Number Average Value Number Average Value Number Average Value
LOANS ORIGINATED 75 $129,810 969 $90,947 1,626 $92,822 209 $35,093 2 $341,180 179 $88,599 2 $24,370 APPLICATIONS APPROVED, NOT ACCEPTED 4 $144,858 128 $99,724 328 $107,207 28 $38,425 0 $0 41 $81,323 0 $0 APPLICATIONS DENIED 12 $142,752 312 $96,549 1,325 $115,544 247 $38,917 0 $0 105 $86,915 10 $55,778 APPLICATIONS WITHDRAWN 2 $104,980 124 $79,360 596 $123,870 44 $70,620 2 $206,585 36 $78,470 0 $0 FILES CLOSED FOR INCOMPLETENESS 2 $132,160 10 $116,030 267 $129,671 8 $62,191 0 $0 0 $0 0 $0
Aggregated Statistics For Year 2005(Based on 18 full tracts) A) FHA, FSA/RHS & VA B) Conventional C) Refinancings D) Home Improvement Loans E) Loans on Dwellings For 5+ Families F) Non-occupant Loans on G) Loans On Manufactured Number Average Value Number Average Value Number Average Value Number Average Value Number Average Value Number Average Value Number Average Value
LOANS ORIGINATED 89 $140,308 1,153 $95,413 2,144 $104,649 257 $35,391 0 $0 201 $97,496 2 $23,990 APPLICATIONS APPROVED, NOT ACCEPTED 4 $157,655 164 $93,023 355 $115,856 43 $63,187 4 $234,508 28 $91,827 0 $0 APPLICATIONS DENIED 16 $145,711 239 $90,541 1,471 $123,551 267 $34,651 0 $0 51 $104,252 24 $54,252 APPLICATIONS WITHDRAWN 16 $132,136 149 $95,056 778 $115,824 85 $103,428 0 $0 34 $129,907 0 $0 FILES CLOSED FOR INCOMPLETENESS 6 $143,728 49 $110,634 330 $126,237 12 $41,482 0 $0 2 $197,230 0 $0
Aggregated Statistics For Year 2004(Based on 18 full tracts) A) FHA, FSA/RHS & VA B) Conventional C) Refinancings D) Home Improvement Loans E) Loans on Dwellings For 5+ Families F) Non-occupant Loans on G) Loans On Manufactured Number Average Value Number Average Value Number Average Value Number Average Value Number Average Value Number Average Value Number Average Value
LOANS ORIGINATED 205 $138,211 991 $108,501 2,485 $108,705 242 $40,601 4 $320,290 162 $107,593 4 $115,868 APPLICATIONS APPROVED, NOT ACCEPTED 23 $132,503 99 $116,409 543 $114,857 39 $50,041 0 $0 32 $105,488 4 $148,612 APPLICATIONS DENIED 12 $123,981 172 $111,765 1,376 $117,192 220 $41,962 0 $0 38 $88,264 6 $91,015 APPLICATIONS WITHDRAWN 10 $129,675 85 $117,330 879 $121,511 32 $55,493 0 $0 23 $103,087 0 $0 FILES CLOSED FOR INCOMPLETENESS 2 $133,730 46 $107,512 205 $121,739 16 $71,985 0 $0 6 $99,582 0 $0
Aggregated Statistics For Year 2003(Based on 18 full tracts) A) FHA, FSA/RHS & VA B) Conventional C) Refinancings D) Home Improvement Loans E) Loans on Dwellings For 5+ Families F) Non-occupant Loans on Number Average Value Number Average Value Number Average Value Number Average Value Number Average Value Number Average Value
LOANS ORIGINATED 239 $133,898 728 $113,119 5,014 $100,335 205 $20,319 4 $841,690 160 $98,399 APPLICATIONS APPROVED, NOT ACCEPTED 10 $109,616 89 $105,420 696 $105,109 41 $17,050 4 $677,485 35 $100,673 APPLICATIONS DENIED 35 $128,976 164 $102,411 1,209 $105,288 264 $15,462 0 $0 44 $115,522 APPLICATIONS WITHDRAWN 14 $122,892 63 $109,947 1,052 $113,380 16 $27,578 2 $270,940 12 $77,382 FILES CLOSED FOR INCOMPLETENESS 8 $136,450 45 $117,487 209 $112,342 4 $55,770 0 $0 14 $92,441
Aggregated Statistics For Year 2002(Based on 18 full tracts) A) FHA, FSA/RHS & VA B) Conventional C) Refinancings D) Home Improvement Loans E) Loans on Dwellings For 5+ Families F) Non-occupant Loans on Number Average Value Number Average Value Number Average Value Number Average Value Number Average Value Number Average Value
LOANS ORIGINATED 391 $130,028 653 $110,262 3,891 $99,339 391 $18,375 4 $752,545 160 $89,668 APPLICATIONS APPROVED, NOT ACCEPTED 10 $120,992 53 $106,734 517 $100,285 65 $21,089 0 $0 28 $84,781 APPLICATIONS DENIED 33 $128,443 107 $82,500 873 $95,481 184 $8,672 0 $0 26 $79,424 APPLICATIONS WITHDRAWN 22 $119,089 53 $110,147 659 $106,380 12 $30,641 0 $0 16 $101,432 FILES CLOSED FOR INCOMPLETENESS 4 $123,920 20 $119,916 228 $109,175 4 $14,575 0 $0 4 $128,712
Aggregated Statistics For Year 2001(Based on 18 full tracts) A) FHA, FSA/RHS & VA B) Conventional C) Refinancings D) Home Improvement Loans F) Non-occupant Loans on Number Average Value Number Average Value Number Average Value Number Average Value Number Average Value
LOANS ORIGINATED 416 $120,758 681 $105,284 3,824 $92,985 444 $16,510 125 $88,808 APPLICATIONS APPROVED, NOT ACCEPTED 6 $96,795 57 $88,564 424 $75,157 93 $20,536 18 $99,319 APPLICATIONS DENIED 18 $113,283 118 $83,320 1,038 $92,282 239 $11,426 23 $78,768 APPLICATIONS WITHDRAWN 20 $129,780 63 $95,703 571 $96,849 37 $28,785 14 $98,080 FILES CLOSED FOR INCOMPLETENESS 4 $99,492 10 $124,759 202 $96,312 2 $25,000 2 $94,555
Aggregated Statistics For Year 2000(Based on 18 full tracts) A) FHA, FSA/RHS & VA B) Conventional C) Refinancings D) Home Improvement Loans F) Non-occupant Loans on Number Average Value Number Average Value Number Average Value Number Average Value Number Average Value
LOANS ORIGINATED 413 $117,890 683 $98,233 1,187 $73,975 502 $15,431 65 $72,870 APPLICATIONS APPROVED, NOT ACCEPTED 10 $111,785 53 $81,238 206 $75,741 142 $20,509 8 $39,326 APPLICATIONS DENIED 30 $120,871 145 $75,661 514 $69,388 255 $17,045 24 $74,323 APPLICATIONS WITHDRAWN 20 $107,158 57 $93,106 306 $71,629 28 $52,784 6 $78,152 FILES CLOSED FOR INCOMPLETENESS 6 $117,918 24 $97,887 95 $92,386 6 $59,685 2 $71,985
Aggregated Statistics For Year 1999(Based on 8 full and 1 partial tracts) A) FHA, FSA/RHS & VA B) Conventional C) Refinancings D) Home Improvement Loans E) Loans on Dwellings For 5+ Families F) Non-occupant Loans on Number Average Value Number Average Value Number Average Value Number Average Value Number Average Value Number Average Value
LOANS ORIGINATED 242 $106,668 277 $95,161 944 $77,800 183 $15,259 3 $84,760 34 $75,676 APPLICATIONS APPROVED, NOT ACCEPTED 6 $103,908 23 $75,243 177 $76,352 44 $16,179 0 $0 7 $55,749 APPLICATIONS DENIED 8 $92,920 54 $67,293 263 $73,634 118 $15,214 0 $0 10 $67,925 APPLICATIONS WITHDRAWN 22 $96,027 22 $85,101 221 $72,346 17 $46,381 0 $0 8 $72,764 FILES CLOSED FOR INCOMPLETENESS 1 $91,840 5 $75,668 84 $81,909 2 $41,495 0 $0 3 $70,797
Private Mortgage Insurance Companies Aggregated Statistics For Year 2009(Based on 14 full tracts) A) Conventional B) Refinancings C) Non-occupant Loans on Number Average Value Number Average Value Number Average Value
LOANS ORIGINATED 12 $63,940 10 $72,529 0 $0 APPLICATIONS APPROVED, NOT ACCEPTED 2 $58,630 6 $110,068 2 $136,725 APPLICATIONS DENIED 2 $39,730 2 $127,000 0 $0 APPLICATIONS WITHDRAWN 0 $0 0 $0 0 $0 FILES CLOSED FOR INCOMPLETENESS 4 $87,285 0 $0 0 $0
Aggregated Statistics For Year 2008(Based on 18 full tracts) A) Conventional B) Refinancings C) Non-occupant Loans on Number Average Value Number Average Value Number Average Value
LOANS ORIGINATED 75 $79,213 50 $120,468 14 $86,114 APPLICATIONS APPROVED, NOT ACCEPTED 34 $90,524 30 $127,259 14 $82,584 APPLICATIONS DENIED 4 $98,422 8 $98,666 2 $114,670 APPLICATIONS WITHDRAWN 4 $130,148 4 $123,322 0 $0 FILES CLOSED FOR INCOMPLETENESS 4 $105,990 4 $141,235 6 $138,982
Aggregated Statistics For Year 2007(Based on 18 full tracts) A) Conventional B) Refinancings C) Non-occupant Loans on Number Average Value Number Average Value Number Average Value
LOANS ORIGINATED 256 $111,337 144 $136,221 14 $82,982 APPLICATIONS APPROVED, NOT ACCEPTED 30 $123,932 38 $146,341 2 $95,950 APPLICATIONS DENIED 10 $129,354 4 $122,260 0 $0 APPLICATIONS WITHDRAWN 16 $122,506 16 $128,415 4 $133,608 FILES CLOSED FOR INCOMPLETENESS 2 $118,940 2 $169,615 0 $0
Aggregated Statistics For Year 2006(Based on 18 full tracts) A) Conventional B) Refinancings C) Non-occupant Loans on Number Average Value Number Average Value Number Average Value
LOANS ORIGINATED 170 $123,790 91 $136,851 14 $99,697 APPLICATIONS APPROVED, NOT ACCEPTED 16 $119,831 20 $142,596 0 $0 APPLICATIONS DENIED 6 $139,547 0 $0 0 $0 APPLICATIONS WITHDRAWN 2 $114,670 18 $138,865 4 $126,362 FILES CLOSED FOR INCOMPLETENESS 0 $0 0 $0 0 $0
Aggregated Statistics For Year 2005(Based on 18 full tracts) A) Conventional B) Refinancings C) Non-occupant Loans on Number Average Value Number Average Value Number Average Value
LOANS ORIGINATED 162 $127,786 156 $133,258 26 $103,541 APPLICATIONS APPROVED, NOT ACCEPTED 26 $131,558 51 $145,721 2 $66,285 APPLICATIONS DENIED 2 $138,720 2 $198,860 0 $0 APPLICATIONS WITHDRAWN 10 $125,567 10 $140,016 2 $112,775 FILES CLOSED FOR INCOMPLETENESS 2 $144,295 0 $0 0 $0
Aggregated Statistics For Year 2004(Based on 18 full tracts) A) Conventional B) Refinancings C) Non-occupant Loans on Number Average Value Number Average Value Number Average Value
LOANS ORIGINATED 211 $129,152 187 $132,900 32 $119,410 APPLICATIONS APPROVED, NOT ACCEPTED 39 $144,717 89 $135,490 6 $120,093 APPLICATIONS DENIED 4 $130,240 4 $137,930 2 $119,760 APPLICATIONS WITHDRAWN 14 $126,031 8 $120,012 0 $0 FILES CLOSED FOR INCOMPLETENESS 2 $79,495 2 $129,005 0 $0
Aggregated Statistics For Year 2003(Based on 18 full tracts) A) Conventional B) Refinancings C) Non-occupant Loans on Number Average Value Number Average Value Number Average Value
LOANS ORIGINATED 253 $129,983 530 $129,961 34 $100,524 APPLICATIONS APPROVED, NOT ACCEPTED 43 $128,463 136 $131,495 6 $123,017 APPLICATIONS DENIED 4 $148,038 22 $137,146 0 $0 APPLICATIONS WITHDRAWN 10 $124,743 39 $130,101 2 $67,985 FILES CLOSED FOR INCOMPLETENESS 0 $0 0 $0 0 $0
Aggregated Statistics For Year 2002(Based on 18 full tracts) A) Conventional B) Refinancings C) Non-occupant Loans on Number Average Value Number Average Value Number Average Value
LOANS ORIGINATED 268 $127,423 426 $131,179 28 $97,995 APPLICATIONS APPROVED, NOT ACCEPTED 39 $127,538 84 $125,353 14 $103,723 APPLICATIONS DENIED 10 $114,064 18 $120,171 0 $0 APPLICATIONS WITHDRAWN 8 $125,714 69 $135,420 6 $141,783 FILES CLOSED FOR INCOMPLETENESS 0 $0 2 $119,185 0 $0
Aggregated Statistics For Year 2001(Based on 18 full tracts) A) Conventional B) Refinancings C) Non-occupant Loans on Number Average Value Number Average Value Number Average Value
LOANS ORIGINATED 265 $116,226 481 $120,829 20 $98,628 APPLICATIONS APPROVED, NOT ACCEPTED 34 $111,500 81 $120,946 8 $94,051 APPLICATIONS DENIED 6 $128,122 18 $127,944 2 $98,425 APPLICATIONS WITHDRAWN 2 $116,000 12 $145,731 0 $0 FILES CLOSED FOR INCOMPLETENESS 0 $0 2 $133,935 0 $0
Aggregated Statistics For Year 2000(Based on 18 full tracts) A) Conventional B) Refinancings C) Non-occupant Loans on Number Average Value Number Average Value Number Average Value
LOANS ORIGINATED 298 $112,429 117 $110,420 6 $85,637 APPLICATIONS APPROVED, NOT ACCEPTED 34 $102,427 30 $112,758 4 $67,310 APPLICATIONS DENIED 8 $112,251 8 $108,090 2 $57,515 APPLICATIONS WITHDRAWN 0 $0 4 $112,322 0 $0 FILES CLOSED FOR INCOMPLETENESS 2 $157,000 2 $107,985 0 $0
Aggregated Statistics For Year 1999(Based on 8 full and 1 partial tracts) A) Conventional B) Refinancings C) Non-occupant Loans on Number Average Value Number Average Value Number Average Value
LOANS ORIGINATED 120 $107,622 84 $100,798 6 $93,187 APPLICATIONS APPROVED, NOT ACCEPTED 6 $108,643 19 $96,729 1 $73,970 APPLICATIONS DENIED 3 $98,577 7 $83,297 1 $58,420 APPLICATIONS WITHDRAWN 2 $106,980 1 $102,990 0 $0 FILES CLOSED FOR INCOMPLETENESS 1 $60,900 3 $128,497 1 $60,900
2002 - 2018 National Fire Incident Reporting System (NFIRS) incidents See full 2006 National Fire Incident Reporting System statistics for zip code 48135, Michigan
Most common first names in zip code 48135 among deceased individuals Name Count Lived (average)
John 266 71.3 years Mary 229 76.8 years William 189 71.0 years Robert 156 67.8 years James 148 68.2 years Joseph 129 72.2 years Helen 119 79.4 years George 111 73.0 years Edward 103 72.6 years Charles 96 70.4 years
Most common last names in zip code 48135 among deceased individuals Last name Count Lived (average)
Smith 76 70.7 years Miller 50 73.8 years Johnson 38 70.9 years Brown 33 70.6 years Davis 31 74.0 years Williams 25 69.2 years Jones 24 76.3 years Thomas 23 69.5 years Anderson 21 72.0 years Wilson 20 72.2 years
Businesses in zip code 48135
Name Count Name Count
7-Eleven 3 Little Caesars Pizza 1 AT&T 1 MasterBrand Cabinets 2 Ace Hardware 1 McDonald's 1 Arby's 1 New Balance 1 AutoZone 1 Payless 1 Burger King 1 Rite Aid 1 Chevrolet 1 SAS Shoes 1 Dairy Queen 1 Sprint Nextel 1 FedEx 1 Taco Bell 1 GNC 1 Tim Hortons 1 H&R Block 2 True Value 1 Jones New York 1 UPS 2 KFC 1 Walgreens 1 Kmart 1 Wendy's 1 Kroger 1
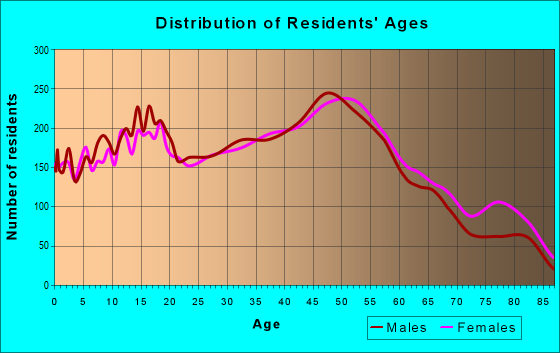


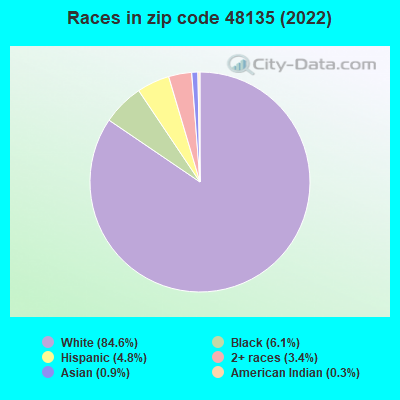


 Nearest zip codes: 48141, 48186, 48185, 48127, 48150, 48184.
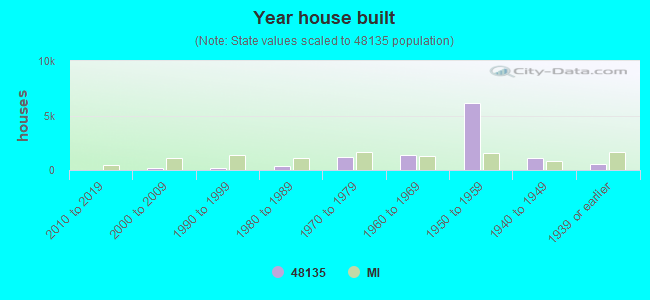
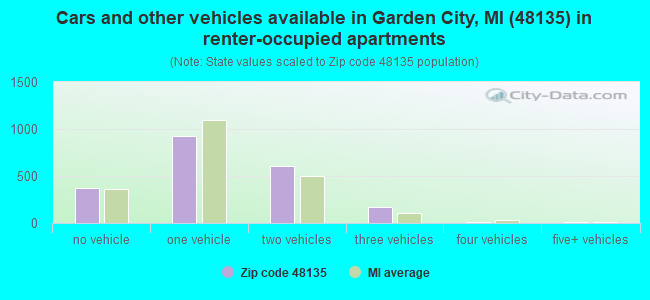


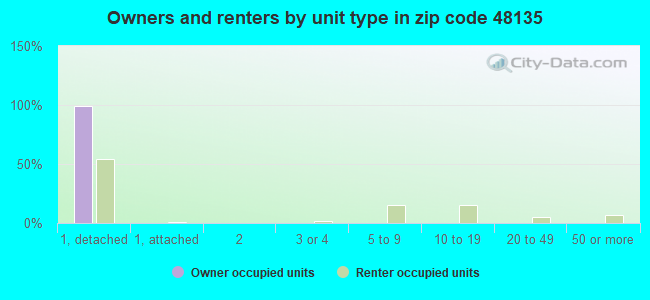
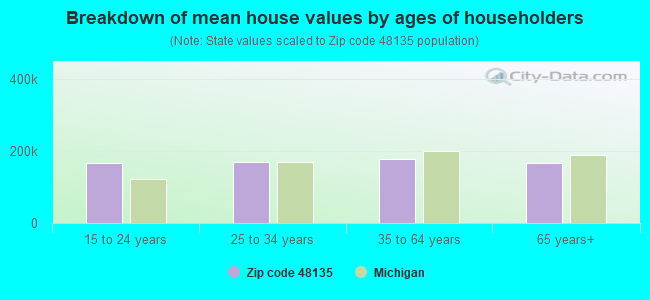


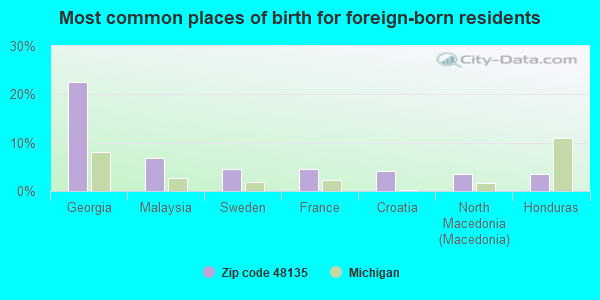
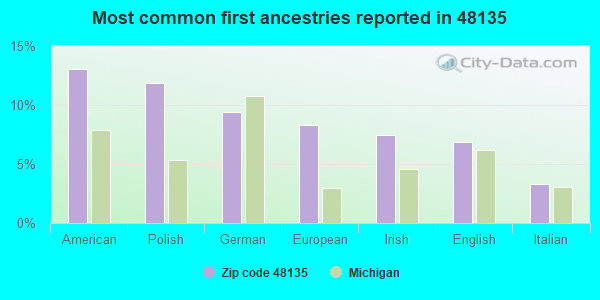
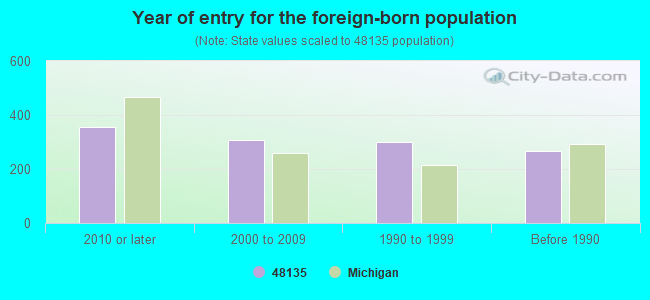
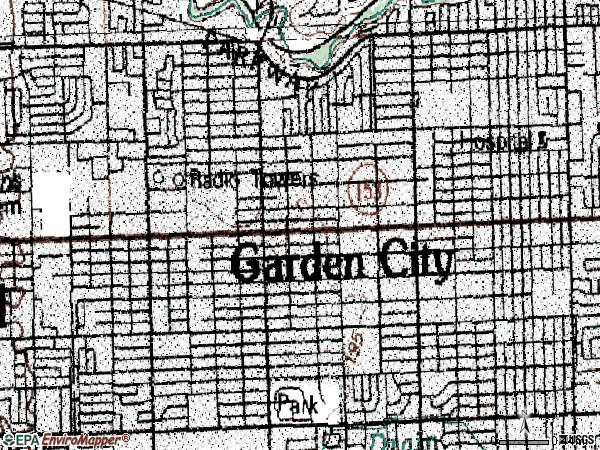

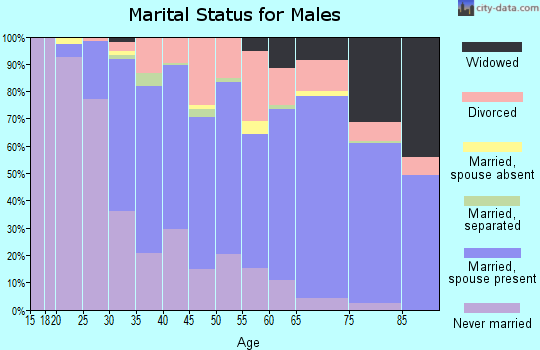
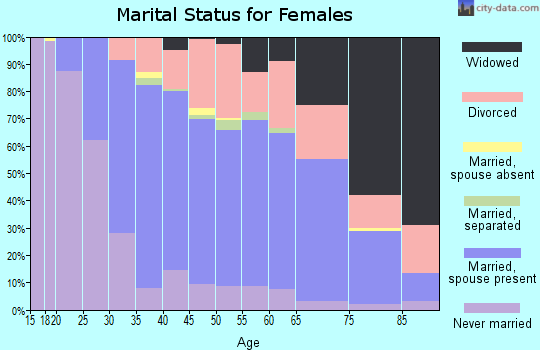
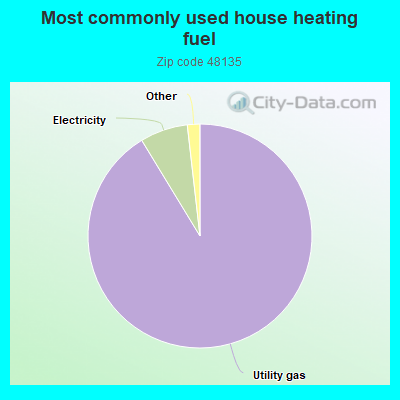
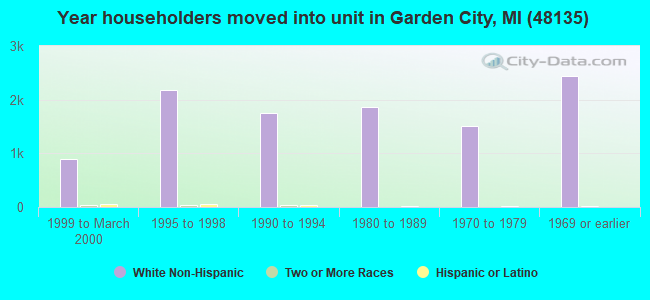
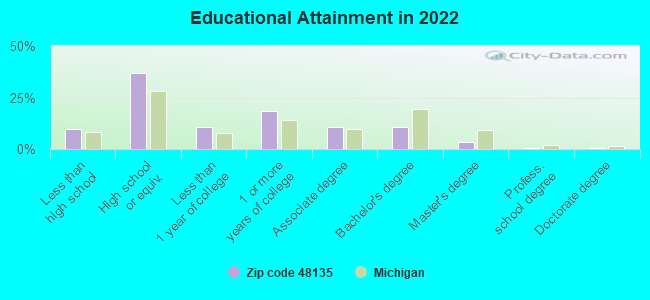
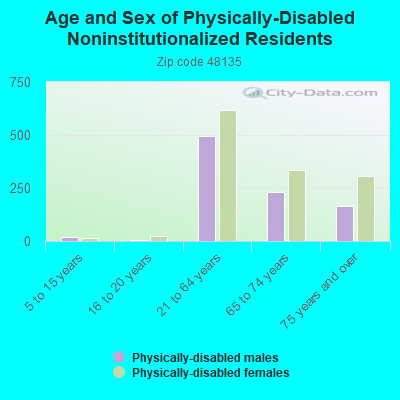
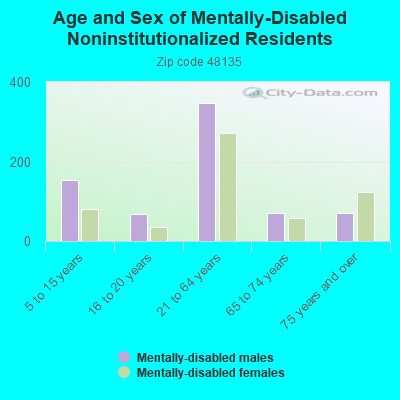
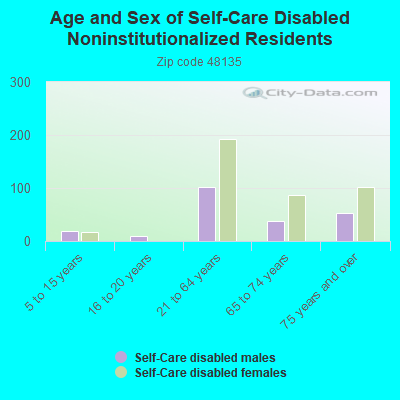
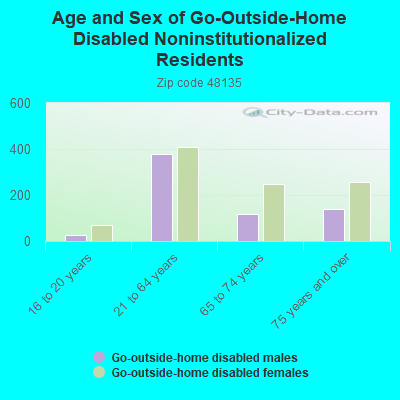
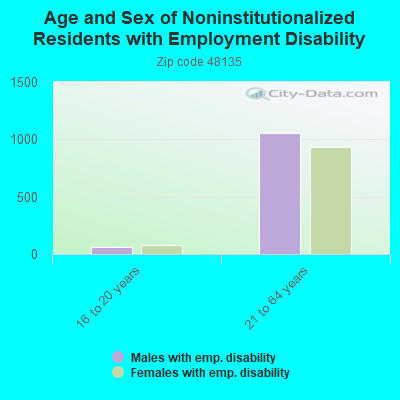
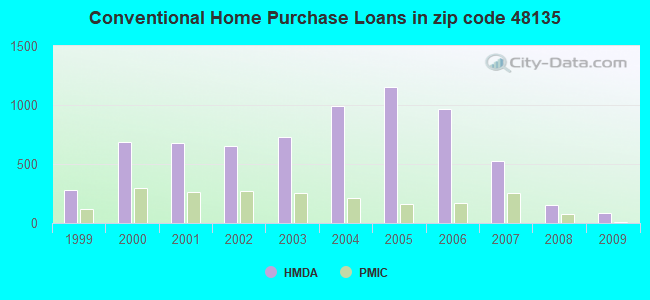
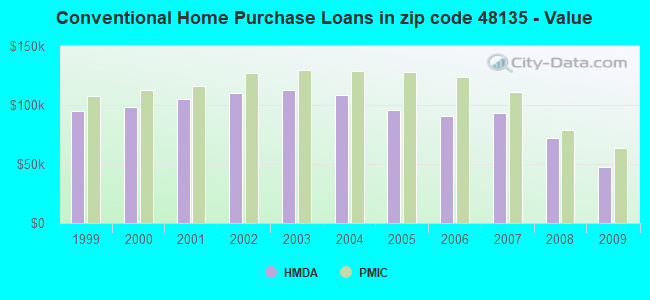
 Based on the data from the years 2002 - 2018 the average number of fires per year is 58. The highest number of reported fire incidents - 95 took place in 2005, and the least - 20 in 2008. The data has a rising trend.
 When looking into fire subcategories, the most incidents belonged to: Structure Fires (52.0%), and Outside Fires (24.9%).