Estimated zip code population in 2022: 40,296
Zip code population in 2010: 36,501
Zip code population in 2000: 35,600
Houses and condos: 14,718
Renter-occupied apartments: 3,722
% of renters here:
26%State:
27%
March 2022 cost of living index in zip code 48127: 96.9
(near average, U.S. average is 100)
Land area: 7.7
sq. mi.
Water area: 0.0
sq. mi.
Population density: 5,238 people per square mile (average).
OSM Map
General Map
Google Map
MSN Map
OSM Map
General Map
Google Map
MSN Map
OSM Map
General Map
Google Map
MSN Map
OSM Map
General Map
Google Map
MSN Map
Please wait while loading the map...
Real estate property taxes paid for housing units in 2022:
This zip code:
1.6% ($3,474)Michigan:
1.2% ($2,746)
Median real estate property taxes paid for housing units with mortgages in 2022: $3,839 (1.6%)
Median real estate property taxes paid for housing units with no mortgage in 2022: $3,133 (1.6%)
Profiles of local businesses
Business Search - 14 Million verified businesses
Males: 19,442 Females: 20,854
For population 25 years and over in 48127:
High school or higher: 88.6%Bachelor's degree or higher: 29.6%Graduate or professional degree: 11.9%Unemployed: 6.6%Mean travel time to work (commute): 22.6 minutes
For population 15 years and over in 48127:
Never married: 34.2%Now married: 50.6%Separated: 1.2%Widowed: 6.2%Divorced: 7.8%
Zip code 48127 compared to state average:
Black race population percentage below state average. Hispanic race population percentage below state average. Median age below state average. Foreign-born population percentage significantly above state average. Length of stay since moving in significantly above state average. 34,094 84.6% White 3,150 7.8% Black 1,195 3.0% Hispanic or Latino 976 2.4% Two or more races 806 2.0% Asian 66 0.2% Some other race 6 0.01% American Indian
Data:
Median household income ($)
Median household income (% change since 2000)
Household income diversity
Ratio of average income to average house value (%)
Ratio of average income to average rent
Median household income ($) - White
Median household income ($) - Black or African American
Median household income ($) - Asian
Median household income ($) - Hispanic or Latino
Median household income ($) - American Indian and Alaska Native
Median household income ($) - Multirace
Median household income ($) - Other Race
Median household income for houses/condos with a mortgage ($)
Median household income for apartments without a mortgage ($)
Races - White alone (%)
Races - White alone (% change since 2000)
Races - Black alone (%)
Races - Black alone (% change since 2000)
Races - American Indian alone (%)
Races - American Indian alone (% change since 2000)
Races - Asian alone (%)
Races - Asian alone (% change since 2000)
Races - Hispanic (%)
Races - Hispanic (% change since 2000)
Races - Native Hawaiian and Other Pacific Islander alone (%)
Races - Native Hawaiian and Other Pacific Islander alone (% change since 2000)
Races - Two or more races (%)
Races - Two or more races (% change since 2000)
Races - Other race alone (%)
Races - Other race alone (% change since 2000)
Racial diversity
Unemployment (%)
Unemployment (% change since 2000)
Unemployment (%) - White
Unemployment (%) - Black or African American
Unemployment (%) - Asian
Unemployment (%) - Hispanic or Latino
Unemployment (%) - American Indian and Alaska Native
Unemployment (%) - Multirace
Unemployment (%) - Other Race
Population density (people per square mile)
Population - Males (%)
Population - Females (%)
Population - Males (%) - White
Population - Males (%) - Black or African American
Population - Males (%) - Asian
Population - Males (%) - Hispanic or Latino
Population - Males (%) - American Indian and Alaska Native
Population - Males (%) - Multirace
Population - Males (%) - Other Race
Population - Females (%) - White
Population - Females (%) - Black or African American
Population - Females (%) - Asian
Population - Females (%) - Hispanic or Latino
Population - Females (%) - American Indian and Alaska Native
Population - Females (%) - Multirace
Population - Females (%) - Other Race
Coronavirus confirmed cases (Apr 27, 2024)
Deaths caused by coronavirus (Apr 27, 2024)
Coronavirus confirmed cases (per 100k population) (Apr 27, 2024)
Deaths caused by coronavirus (per 100k population) (Apr 27, 2024)
Daily increase in number of cases (Apr 27, 2024)
Weekly increase in number of cases (Apr 27, 2024)
Cases doubled (in days) (Apr 27, 2024)
Hospitalized patients (Apr 18, 2022)
Negative test results (Apr 18, 2022)
Total test results (Apr 18, 2022)
COVID Vaccine doses distributed (per 100k population) (Sep 19, 2023)
COVID Vaccine doses administered (per 100k population) (Sep 19, 2023)
COVID Vaccine doses distributed (Sep 19, 2023)
COVID Vaccine doses administered (Sep 19, 2023)
Likely homosexual households (%)
Likely homosexual households (% change since 2000)
Likely homosexual households - Lesbian couples (%)
Likely homosexual households - Lesbian couples (% change since 2000)
Likely homosexual households - Gay men (%)
Likely homosexual households - Gay men (% change since 2000)
Cost of living index
Median gross rent ($)
Median contract rent ($)
Median monthly housing costs ($)
Median house or condo value ($)
Median house or condo value ($ change since 2000)
Mean house or condo value by units in structure - 1, detached ($)
Mean house or condo value by units in structure - 1, attached ($)
Mean house or condo value by units in structure - 2 ($)
Mean house or condo value by units in structure by units in structure - 3 or 4 ($)
Mean house or condo value by units in structure - 5 or more ($)
Mean house or condo value by units in structure - Boat, RV, van, etc. ($)
Mean house or condo value by units in structure - Mobile home ($)
Median house or condo value ($) - White
Median house or condo value ($) - Black or African American
Median house or condo value ($) - Asian
Median house or condo value ($) - Hispanic or Latino
Median house or condo value ($) - American Indian and Alaska Native
Median house or condo value ($) - Multirace
Median house or condo value ($) - Other Race
Median resident age
Resident age diversity
Median resident age - Males
Median resident age - Females
Median resident age - White
Median resident age - Black or African American
Median resident age - Asian
Median resident age - Hispanic or Latino
Median resident age - American Indian and Alaska Native
Median resident age - Multirace
Median resident age - Other Race
Median resident age - Males - White
Median resident age - Males - Black or African American
Median resident age - Males - Asian
Median resident age - Males - Hispanic or Latino
Median resident age - Males - American Indian and Alaska Native
Median resident age - Males - Multirace
Median resident age - Males - Other Race
Median resident age - Females - White
Median resident age - Females - Black or African American
Median resident age - Females - Asian
Median resident age - Females - Hispanic or Latino
Median resident age - Females - American Indian and Alaska Native
Median resident age - Females - Multirace
Median resident age - Females - Other Race
Commute - mean travel time to work (minutes)
Travel time to work - Less than 5 minutes (%)
Travel time to work - Less than 5 minutes (% change since 2000)
Travel time to work - 5 to 9 minutes (%)
Travel time to work - 5 to 9 minutes (% change since 2000)
Travel time to work - 10 to 19 minutes (%)
Travel time to work - 10 to 19 minutes (% change since 2000)
Travel time to work - 20 to 29 minutes (%)
Travel time to work - 20 to 29 minutes (% change since 2000)
Travel time to work - 30 to 39 minutes (%)
Travel time to work - 30 to 39 minutes (% change since 2000)
Travel time to work - 40 to 59 minutes (%)
Travel time to work - 40 to 59 minutes (% change since 2000)
Travel time to work - 60 to 89 minutes (%)
Travel time to work - 60 to 89 minutes (% change since 2000)
Travel time to work - 90 or more minutes (%)
Travel time to work - 90 or more minutes (% change since 2000)
Marital status - Never married (%)
Marital status - Now married (%)
Marital status - Separated (%)
Marital status - Widowed (%)
Marital status - Divorced (%)
Median family income ($)
Median family income (% change since 2000)
Median non-family income ($)
Median non-family income (% change since 2000)
Median per capita income ($)
Median per capita income (% change since 2000)
Median family income ($) - White
Median family income ($) - Black or African American
Median family income ($) - Asian
Median family income ($) - Hispanic or Latino
Median family income ($) - American Indian and Alaska Native
Median family income ($) - Multirace
Median family income ($) - Other Race
Median year house/condo built
Median year apartment built
Year house built - Built 2005 or later (%)
Year house built - Built 2000 to 2004 (%)
Year house built - Built 1990 to 1999 (%)
Year house built - Built 1980 to 1989 (%)
Year house built - Built 1970 to 1979 (%)
Year house built - Built 1960 to 1969 (%)
Year house built - Built 1950 to 1959 (%)
Year house built - Built 1940 to 1949 (%)
Year house built - Built 1939 or earlier (%)
Average household size
Household density (households per square mile)
Average household size - White
Average household size - Black or African American
Average household size - Asian
Average household size - Hispanic or Latino
Average household size - American Indian and Alaska Native
Average household size - Multirace
Average household size - Other Race
Occupied housing units (%)
Vacant housing units (%)
Owner occupied housing units (%)
Renter occupied housing units (%)
Vacancy status - For rent (%)
Vacancy status - For sale only (%)
Vacancy status - Rented or sold, not occupied (%)
Vacancy status - For seasonal, recreational, or occasional use (%)
Vacancy status - For migrant workers (%)
Vacancy status - Other vacant (%)
Residents with income below the poverty level (%)
Residents with income below 50% of the poverty level (%)
Children below poverty level (%)
Poor families by family type - Married-couple family (%)
Poor families by family type - Male, no wife present (%)
Poor families by family type - Female, no husband present (%)
Poverty status for native-born residents (%)
Poverty status for foreign-born residents (%)
Poverty among high school graduates not in families (%)
Poverty among people who did not graduate high school not in families (%)
Residents with income below the poverty level (%) - White
Residents with income below the poverty level (%) - Black or African American
Residents with income below the poverty level (%) - Asian
Residents with income below the poverty level (%) - Hispanic or Latino
Residents with income below the poverty level (%) - American Indian and Alaska Native
Residents with income below the poverty level (%) - Multirace
Residents with income below the poverty level (%) - Other Race
Air pollution - Air Quality Index (AQI)
Air pollution - CO
Air pollution - NO2
Air pollution - SO2
Air pollution - Ozone
Air pollution - PM10
Air pollution - PM25
Air pollution - Pb
Crime - Murders per 100,000 population
Crime - Rapes per 100,000 population
Crime - Robberies per 100,000 population
Crime - Assaults per 100,000 population
Crime - Burglaries per 100,000 population
Crime - Thefts per 100,000 population
Crime - Auto thefts per 100,000 population
Crime - Arson per 100,000 population
Crime - City-data.com crime index
Crime - Violent crime index
Crime - Property crime index
Crime - Murders per 100,000 population (5 year average)
Crime - Rapes per 100,000 population (5 year average)
Crime - Robberies per 100,000 population (5 year average)
Crime - Assaults per 100,000 population (5 year average)
Crime - Burglaries per 100,000 population (5 year average)
Crime - Thefts per 100,000 population (5 year average)
Crime - Auto thefts per 100,000 population (5 year average)
Crime - Arson per 100,000 population (5 year average)
Crime - City-data.com crime index (5 year average)
Crime - Violent crime index (5 year average)
Crime - Property crime index (5 year average)
1996 Presidential Elections Results (%) - Democratic Party (Clinton)
1996 Presidential Elections Results (%) - Republican Party (Dole)
1996 Presidential Elections Results (%) - Other
2000 Presidential Elections Results (%) - Democratic Party (Gore)
2000 Presidential Elections Results (%) - Republican Party (Bush)
2000 Presidential Elections Results (%) - Other
2004 Presidential Elections Results (%) - Democratic Party (Kerry)
2004 Presidential Elections Results (%) - Republican Party (Bush)
2004 Presidential Elections Results (%) - Other
2008 Presidential Elections Results (%) - Democratic Party (Obama)
2008 Presidential Elections Results (%) - Republican Party (McCain)
2008 Presidential Elections Results (%) - Other
2012 Presidential Elections Results (%) - Democratic Party (Obama)
2012 Presidential Elections Results (%) - Republican Party (Romney)
2012 Presidential Elections Results (%) - Other
2016 Presidential Elections Results (%) - Democratic Party (Clinton)
2016 Presidential Elections Results (%) - Republican Party (Trump)
2016 Presidential Elections Results (%) - Other
2020 Presidential Elections Results (%) - Democratic Party (Biden)
2020 Presidential Elections Results (%) - Republican Party (Trump)
2020 Presidential Elections Results (%) - Other
Ancestries Reported - Arab (%)
Ancestries Reported - Czech (%)
Ancestries Reported - Danish (%)
Ancestries Reported - Dutch (%)
Ancestries Reported - English (%)
Ancestries Reported - French (%)
Ancestries Reported - French Canadian (%)
Ancestries Reported - German (%)
Ancestries Reported - Greek (%)
Ancestries Reported - Hungarian (%)
Ancestries Reported - Irish (%)
Ancestries Reported - Italian (%)
Ancestries Reported - Lithuanian (%)
Ancestries Reported - Norwegian (%)
Ancestries Reported - Polish (%)
Ancestries Reported - Portuguese (%)
Ancestries Reported - Russian (%)
Ancestries Reported - Scotch-Irish (%)
Ancestries Reported - Scottish (%)
Ancestries Reported - Slovak (%)
Ancestries Reported - Subsaharan African (%)
Ancestries Reported - Swedish (%)
Ancestries Reported - Swiss (%)
Ancestries Reported - Ukrainian (%)
Ancestries Reported - United States (%)
Ancestries Reported - Welsh (%)
Ancestries Reported - West Indian (%)
Ancestries Reported - Other (%)
Educational Attainment - No schooling completed (%)
Educational Attainment - Less than high school (%)
Educational Attainment - High school or equivalent (%)
Educational Attainment - Less than 1 year of college (%)
Educational Attainment - 1 or more years of college (%)
Educational Attainment - Associate degree (%)
Educational Attainment - Bachelor's degree (%)
Educational Attainment - Master's degree (%)
Educational Attainment - Professional school degree (%)
Educational Attainment - Doctorate degree (%)
School Enrollment - Nursery, preschool (%)
School Enrollment - Kindergarten (%)
School Enrollment - Grade 1 to 4 (%)
School Enrollment - Grade 5 to 8 (%)
School Enrollment - Grade 9 to 12 (%)
School Enrollment - College undergrad (%)
School Enrollment - Graduate or professional (%)
School Enrollment - Not enrolled in school (%)
School enrollment - Public schools (%)
School enrollment - Private schools (%)
School enrollment - Not enrolled (%)
Median number of rooms in houses and condos
Median number of rooms in apartments
Housing units lacking complete plumbing facilities (%)
Housing units lacking complete kitchen facilities (%)
Density of houses
Urban houses (%)
Rural houses (%)
Households with people 60 years and over (%)
Households with people 65 years and over (%)
Households with people 75 years and over (%)
Households with one or more nonrelatives (%)
Households with no nonrelatives (%)
Population in households (%)
Family households (%)
Nonfamily households (%)
Population in families (%)
Family households with own children (%)
Median number of bedrooms in owner occupied houses
Mean number of bedrooms in owner occupied houses
Median number of bedrooms in renter occupied houses
Mean number of bedrooms in renter occupied houses
Median number of vehichles in owner occupied houses
Mean number of vehichles in owner occupied houses
Median number of vehichles in renter occupied houses
Mean number of vehichles in renter occupied houses
Mortgage status - with mortgage (%)
Mortgage status - with second mortgage (%)
Mortgage status - with home equity loan (%)
Mortgage status - with both second mortgage and home equity loan (%)
Mortgage status - without a mortgage (%)
Average family size
Average family size - White
Average family size - Black or African American
Average family size - Asian
Average family size - Hispanic or Latino
Average family size - American Indian and Alaska Native
Average family size - Multirace
Average family size - Other Race
Geographical mobility - Same house 1 year ago (%)
Geographical mobility - Moved within same county (%)
Geographical mobility - Moved from different county within same state (%)
Geographical mobility - Moved from different state (%)
Geographical mobility - Moved from abroad (%)
Place of birth - Born in state of residence (%)
Place of birth - Born in other state (%)
Place of birth - Native, outside of US (%)
Place of birth - Foreign born (%)
Housing units in structures - 1, detached (%)
Housing units in structures - 1, attached (%)
Housing units in structures - 2 (%)
Housing units in structures - 3 or 4 (%)
Housing units in structures - 5 to 9 (%)
Housing units in structures - 10 to 19 (%)
Housing units in structures - 20 to 49 (%)
Housing units in structures - 50 or more (%)
Housing units in structures - Mobile home (%)
Housing units in structures - Boat, RV, van, etc. (%)
House/condo owner moved in on average (years ago)
Renter moved in on average (years ago)
Year householder moved into unit - Moved in 1999 to March 2000 (%)
Year householder moved into unit - Moved in 1995 to 1998 (%)
Year householder moved into unit - Moved in 1990 to 1994 (%)
Year householder moved into unit - Moved in 1980 to 1989 (%)
Year householder moved into unit - Moved in 1970 to 1979 (%)
Year householder moved into unit - Moved in 1969 or earlier (%)
Means of transportation to work - Drove car alone (%)
Means of transportation to work - Carpooled (%)
Means of transportation to work - Public transportation (%)
Means of transportation to work - Bus or trolley bus (%)
Means of transportation to work - Streetcar or trolley car (%)
Means of transportation to work - Subway or elevated (%)
Means of transportation to work - Railroad (%)
Means of transportation to work - Ferryboat (%)
Means of transportation to work - Taxicab (%)
Means of transportation to work - Motorcycle (%)
Means of transportation to work - Bicycle (%)
Means of transportation to work - Walked (%)
Means of transportation to work - Other means (%)
Working at home (%)
Industry diversity
Most Common Industries - Agriculture, forestry, fishing and hunting, and mining (%)
Most Common Industries - Agriculture, forestry, fishing and hunting (%)
Most Common Industries - Mining, quarrying, and oil and gas extraction (%)
Most Common Industries - Construction (%)
Most Common Industries - Manufacturing (%)
Most Common Industries - Wholesale trade (%)
Most Common Industries - Retail trade (%)
Most Common Industries - Transportation and warehousing, and utilities (%)
Most Common Industries - Transportation and warehousing (%)
Most Common Industries - Utilities (%)
Most Common Industries - Information (%)
Most Common Industries - Finance and insurance, and real estate and rental and leasing (%)
Most Common Industries - Finance and insurance (%)
Most Common Industries - Real estate and rental and leasing (%)
Most Common Industries - Professional, scientific, and management, and administrative and waste management services (%)
Most Common Industries - Professional, scientific, and technical services (%)
Most Common Industries - Management of companies and enterprises (%)
Most Common Industries - Administrative and support and waste management services (%)
Most Common Industries - Educational services, and health care and social assistance (%)
Most Common Industries - Educational services (%)
Most Common Industries - Health care and social assistance (%)
Most Common Industries - Arts, entertainment, and recreation, and accommodation and food services (%)
Most Common Industries - Arts, entertainment, and recreation (%)
Most Common Industries - Accommodation and food services (%)
Most Common Industries - Other services, except public administration (%)
Most Common Industries - Public administration (%)
Occupation diversity
Most Common Occupations - Management, business, science, and arts occupations (%)
Most Common Occupations - Management, business, and financial occupations (%)
Most Common Occupations - Management occupations (%)
Most Common Occupations - Business and financial operations occupations (%)
Most Common Occupations - Computer, engineering, and science occupations (%)
Most Common Occupations - Computer and mathematical occupations (%)
Most Common Occupations - Architecture and engineering occupations (%)
Most Common Occupations - Life, physical, and social science occupations (%)
Most Common Occupations - Education, legal, community service, arts, and media occupations (%)
Most Common Occupations - Community and social service occupations (%)
Most Common Occupations - Legal occupations (%)
Most Common Occupations - Education, training, and library occupations (%)
Most Common Occupations - Arts, design, entertainment, sports, and media occupations (%)
Most Common Occupations - Healthcare practitioners and technical occupations (%)
Most Common Occupations - Health diagnosing and treating practitioners and other technical occupations (%)
Most Common Occupations - Health technologists and technicians (%)
Most Common Occupations - Service occupations (%)
Most Common Occupations - Healthcare support occupations (%)
Most Common Occupations - Protective service occupations (%)
Most Common Occupations - Fire fighting and prevention, and other protective service workers including supervisors (%)
Most Common Occupations - Law enforcement workers including supervisors (%)
Most Common Occupations - Food preparation and serving related occupations (%)
Most Common Occupations - Building and grounds cleaning and maintenance occupations (%)
Most Common Occupations - Personal care and service occupations (%)
Most Common Occupations - Sales and office occupations (%)
Most Common Occupations - Sales and related occupations (%)
Most Common Occupations - Office and administrative support occupations (%)
Most Common Occupations - Natural resources, construction, and maintenance occupations (%)
Most Common Occupations - Farming, fishing, and forestry occupations (%)
Most Common Occupations - Construction and extraction occupations (%)
Most Common Occupations - Installation, maintenance, and repair occupations (%)
Most Common Occupations - Production, transportation, and material moving occupations (%)
Most Common Occupations - Production occupations (%)
Most Common Occupations - Transportation occupations (%)
Most Common Occupations - Material moving occupations (%)
People in Group quarters - Institutionalized population (%)
People in Group quarters - Correctional institutions (%)
People in Group quarters - Federal prisons and detention centers (%)
People in Group quarters - Halfway houses (%)
People in Group quarters - Local jails and other confinement facilities (including police lockups) (%)
People in Group quarters - Military disciplinary barracks (%)
People in Group quarters - State prisons (%)
People in Group quarters - Other types of correctional institutions (%)
People in Group quarters - Nursing homes (%)
People in Group quarters - Hospitals/wards, hospices, and schools for the handicapped (%)
People in Group quarters - Hospitals/wards and hospices for chronically ill (%)
People in Group quarters - Hospices or homes for chronically ill (%)
People in Group quarters - Military hospitals or wards for chronically ill (%)
People in Group quarters - Other hospitals or wards for chronically ill (%)
People in Group quarters - Hospitals or wards for drug/alcohol abuse (%)
People in Group quarters - Mental (Psychiatric) hospitals or wards (%)
People in Group quarters - Schools, hospitals, or wards for the mentally retarded (%)
People in Group quarters - Schools, hospitals, or wards for the physically handicapped (%)
People in Group quarters - Institutions for the deaf (%)
People in Group quarters - Institutions for the blind (%)
People in Group quarters - Orthopedic wards and institutions for the physically handicapped (%)
People in Group quarters - Wards in general hospitals for patients who have no usual home elsewhere (%)
People in Group quarters - Wards in military hospitals for patients who have no usual home elsewhere (%)
People in Group quarters - Juvenile institutions (%)
People in Group quarters - Long-term care (%)
People in Group quarters - Homes for abused, dependent, and neglected children (%)
People in Group quarters - Residential treatment centers for emotionally disturbed children (%)
People in Group quarters - Training schools for juvenile delinquents (%)
People in Group quarters - Short-term care, detention or diagnostic centers for delinquent children (%)
People in Group quarters - Type of juvenile institution unknown (%)
People in Group quarters - Noninstitutionalized population (%)
People in Group quarters - College dormitories (includes college quarters off campus) (%)
People in Group quarters - Military quarters (%)
People in Group quarters - On base (%)
People in Group quarters - Barracks, unaccompanied personnel housing (UPH), (Enlisted/Officer), ;and similar group living quarters for military personnel (%)
People in Group quarters - Transient quarters for temporary residents (%)
People in Group quarters - Military ships (%)
People in Group quarters - Group homes (%)
People in Group quarters - Homes or halfway houses for drug/alcohol abuse (%)
People in Group quarters - Homes for the mentally ill (%)
People in Group quarters - Homes for the mentally retarded (%)
People in Group quarters - Homes for the physically handicapped (%)
People in Group quarters - Other group homes (%)
People in Group quarters - Religious group quarters (%)
People in Group quarters - Dormitories (%)
People in Group quarters - Agriculture workers' dormitories on farms (%)
People in Group quarters - Job Corps and vocational training facilities (%)
People in Group quarters - Other workers' dormitories (%)
People in Group quarters - Crews of maritime vessels (%)
People in Group quarters - Other nonhousehold living situations (%)
People in Group quarters - Other noninstitutional group quarters (%)
Residents speaking English at home (%)
Residents speaking English at home - Born in the United States (%)
Residents speaking English at home - Native, born elsewhere (%)
Residents speaking English at home - Foreign born (%)
Residents speaking Spanish at home (%)
Residents speaking Spanish at home - Born in the United States (%)
Residents speaking Spanish at home - Native, born elsewhere (%)
Residents speaking Spanish at home - Foreign born (%)
Residents speaking other language at home (%)
Residents speaking other language at home - Born in the United States (%)
Residents speaking other language at home - Native, born elsewhere (%)
Residents speaking other language at home - Foreign born (%)
Class of Workers - Employee of private company (%)
Class of Workers - Self-employed in own incorporated business (%)
Class of Workers - Private not-for-profit wage and salary workers (%)
Class of Workers - Local government workers (%)
Class of Workers - State government workers (%)
Class of Workers - Federal government workers (%)
Class of Workers - Self-employed workers in own not incorporated business and Unpaid family workers (%)
House heating fuel used in houses and condos - Utility gas (%)
House heating fuel used in houses and condos - Bottled, tank, or LP gas (%)
House heating fuel used in houses and condos - Electricity (%)
House heating fuel used in houses and condos - Fuel oil, kerosene, etc. (%)
House heating fuel used in houses and condos - Coal or coke (%)
House heating fuel used in houses and condos - Wood (%)
House heating fuel used in houses and condos - Solar energy (%)
House heating fuel used in houses and condos - Other fuel (%)
House heating fuel used in houses and condos - No fuel used (%)
House heating fuel used in apartments - Utility gas (%)
House heating fuel used in apartments - Bottled, tank, or LP gas (%)
House heating fuel used in apartments - Electricity (%)
House heating fuel used in apartments - Fuel oil, kerosene, etc. (%)
House heating fuel used in apartments - Coal or coke (%)
House heating fuel used in apartments - Wood (%)
House heating fuel used in apartments - Solar energy (%)
House heating fuel used in apartments - Other fuel (%)
House heating fuel used in apartments - No fuel used (%)
Armed forces status - In Armed Forces (%)
Armed forces status - Civilian (%)
Armed forces status - Civilian - Veteran (%)
Armed forces status - Civilian - Nonveteran (%)
Fatal accidents locations in years 2005-2021
Fatal accidents locations in 2005
Fatal accidents locations in 2006
Fatal accidents locations in 2007
Fatal accidents locations in 2008
Fatal accidents locations in 2009
Fatal accidents locations in 2010
Fatal accidents locations in 2011
Fatal accidents locations in 2012
Fatal accidents locations in 2013
Fatal accidents locations in 2014
Fatal accidents locations in 2015
Fatal accidents locations in 2016
Fatal accidents locations in 2017
Fatal accidents locations in 2018
Fatal accidents locations in 2019
Fatal accidents locations in 2020
Fatal accidents locations in 2021
Alcohol use - People drinking some alcohol every month (%)
Alcohol use - People not drinking at all (%)
Alcohol use - Average days/month drinking alcohol
Alcohol use - Average drinks/week
Alcohol use - Average days/year people drink much
Audiometry - Average condition of hearing (%)
Audiometry - People that can hear a whisper from across a quiet room (%)
Audiometry - People that can hear normal voice from across a quiet room (%)
Audiometry - Ears ringing, roaring, buzzing (%)
Audiometry - Had a job exposure to loud noise (%)
Audiometry - Had off-work exposure to loud noise (%)
Blood Pressure & Cholesterol - Has high blood pressure (%)
Blood Pressure & Cholesterol - Checking blood pressure at home (%)
Blood Pressure & Cholesterol - Frequently checking blood cholesterol (%)
Blood Pressure & Cholesterol - Has high cholesterol level (%)
Consumer Behavior - Money monthly spent on food at supermarket/grocery store
Consumer Behavior - Money monthly spent on food at other stores
Consumer Behavior - Money monthly spent on eating out
Consumer Behavior - Money monthly spent on carryout/delivered foods
Consumer Behavior - Income spent on food at supermarket/grocery store (%)
Consumer Behavior - Income spent on food at other stores (%)
Consumer Behavior - Income spent on eating out (%)
Consumer Behavior - Income spent on carryout/delivered foods (%)
Current Health Status - General health condition (%)
Current Health Status - Blood donors (%)
Current Health Status - Has blood ever tested for HIV virus (%)
Current Health Status - Left-handed people (%)
Dermatology - People using sunscreen (%)
Diabetes - Diabetics (%)
Diabetes - Had a blood test for high blood sugar (%)
Diabetes - People taking insulin (%)
Diet Behavior & Nutrition - Diet health (%)
Diet Behavior & Nutrition - Milk product consumption (# of products/month)
Diet Behavior & Nutrition - Meals not home prepared (#/week)
Diet Behavior & Nutrition - Meals from fast food or pizza place (#/week)
Diet Behavior & Nutrition - Ready-to-eat foods (#/month)
Diet Behavior & Nutrition - Frozen meals/pizza (#/month)
Drug Use - People that ever used marijuana or hashish (%)
Drug Use - Ever used hard drugs (%)
Drug Use - Ever used any form of cocaine (%)
Drug Use - Ever used heroin (%)
Drug Use - Ever used methamphetamine (%)
Health Insurance - People covered by health insurance (%)
Kidney Conditions-Urology - Avg. # of times urinating at night
Medical Conditions - People with asthma (%)
Medical Conditions - People with anemia (%)
Medical Conditions - People with psoriasis (%)
Medical Conditions - People with overweight (%)
Medical Conditions - Elderly people having difficulties in thinking or remembering (%)
Medical Conditions - People who ever received blood transfusion (%)
Medical Conditions - People having trouble seeing even with glass/contacts (%)
Medical Conditions - People with arthritis (%)
Medical Conditions - People with gout (%)
Medical Conditions - People with congestive heart failure (%)
Medical Conditions - People with coronary heart disease (%)
Medical Conditions - People with angina pectoris (%)
Medical Conditions - People who ever had heart attack (%)
Medical Conditions - People who ever had stroke (%)
Medical Conditions - People with emphysema (%)
Medical Conditions - People with thyroid problem (%)
Medical Conditions - People with chronic bronchitis (%)
Medical Conditions - People with any liver condition (%)
Medical Conditions - People who ever had cancer or malignancy (%)
Mental Health - People who have little interest in doing things (%)
Mental Health - People feeling down, depressed, or hopeless (%)
Mental Health - People who have trouble sleeping or sleeping too much (%)
Mental Health - People feeling tired or having little energy (%)
Mental Health - People with poor appetite or overeating (%)
Mental Health - People feeling bad about themself (%)
Mental Health - People who have trouble concentrating on things (%)
Mental Health - People moving or speaking slowly or too fast (%)
Mental Health - People having thoughts they would be better off dead (%)
Oral Health - Average years since last visit a dentist
Oral Health - People embarrassed because of mouth (%)
Oral Health - People with gum disease (%)
Oral Health - General health of teeth and gums (%)
Oral Health - Average days a week using dental floss/device
Oral Health - Average days a week using mouthwash for dental problem
Oral Health - Average number of teeth
Pesticide Use - Households using pesticides to control insects (%)
Pesticide Use - Households using pesticides to kill weeds (%)
Physical Activity - People doing vigorous-intensity work activities (%)
Physical Activity - People doing moderate-intensity work activities (%)
Physical Activity - People walking or bicycling (%)
Physical Activity - People doing vigorous-intensity recreational activities (%)
Physical Activity - People doing moderate-intensity recreational activities (%)
Physical Activity - Average hours a day doing sedentary activities
Physical Activity - Average hours a day watching TV or videos
Physical Activity - Average hours a day using computer
Physical Functioning - People having limitations keeping them from working (%)
Physical Functioning - People limited in amount of work they can do (%)
Physical Functioning - People that need special equipment to walk (%)
Physical Functioning - People experiencing confusion/memory problems (%)
Physical Functioning - People requiring special healthcare equipment (%)
Prescription Medications - Average number of prescription medicines taking
Preventive Aspirin Use - Adults 40+ taking low-dose aspirin (%)
Reproductive Health - Vaginal deliveries (%)
Reproductive Health - Cesarean deliveries (%)
Reproductive Health - Deliveries resulted in a live birth (%)
Reproductive Health - Pregnancies resulted in a delivery (%)
Reproductive Health - Women breastfeeding newborns (%)
Reproductive Health - Women that had a hysterectomy (%)
Reproductive Health - Women that had both ovaries removed (%)
Reproductive Health - Women that have ever taken birth control pills (%)
Reproductive Health - Women taking birth control pills (%)
Reproductive Health - Women that have ever used Depo-Provera or injectables (%)
Reproductive Health - Women that have ever used female hormones (%)
Sexual Behavior - People 18+ that ever had sex (vaginal, anal, or oral) (%)
Sexual Behavior - Males 18+ that ever had vaginal sex with a woman (%)
Sexual Behavior - Males 18+ that ever performed oral sex on a woman (%)
Sexual Behavior - Males 18+ that ever had anal sex with a woman (%)
Sexual Behavior - Males 18+ that ever had any sex with a man (%)
Sexual Behavior - Females 18+ that ever had vaginal sex with a man (%)
Sexual Behavior - Females 18+ that ever performed oral sex on a man (%)
Sexual Behavior - Females 18+ that ever had anal sex with a man (%)
Sexual Behavior - Females 18+ that ever had any kind of sex with a woman (%)
Sexual Behavior - Average age people first had sex
Sexual Behavior - Average number of female sex partners in lifetime (males 18+)
Sexual Behavior - Average number of female vaginal sex partners in lifetime (males 18+)
Sexual Behavior - Average age people first performed oral sex on a woman (18+)
Sexual Behavior - Average number of woman performed oral sex on in lifetime (18+)
Sexual Behavior - Average number of male sex partners in lifetime (males 18+)
Sexual Behavior - Average number of male anal sex partners in lifetime (males 18+)
Sexual Behavior - Average age people first performed oral sex on a man (18+)
Sexual Behavior - Average number of male oral sex partners in lifetime (18+)
Sexual Behavior - People using protection when performing oral sex (%)
Sexual Behavior - Average number of times people have vaginal or anal sex a year
Sexual Behavior - People having sex without condom (%)
Sexual Behavior - Average number of male sex partners in lifetime (females 18+)
Sexual Behavior - Average number of male vaginal sex partners in lifetime (females 18+)
Sexual Behavior - Average number of female sex partners in lifetime (females 18+)
Sexual Behavior - Circumcised males 18+ (%)
Sleep Disorders - Average hours sleeping at night
Sleep Disorders - People that has trouble sleeping (%)
Smoking-Cigarette Use - People smoking cigarettes (%)
Taste & Smell - People 40+ having problems with smell (%)
Taste & Smell - People 40+ having problems with taste (%)
Taste & Smell - People 40+ that ever had wisdom teeth removed (%)
Taste & Smell - People 40+ that ever had tonsils teeth removed (%)
Taste & Smell - People 40+ that ever had a loss of consciousness because of a head injury (%)
Taste & Smell - People 40+ that ever had a broken nose or other serious injury to face or skull (%)
Taste & Smell - People 40+ that ever had two or more sinus infections (%)
Weight - Average height (inches)
Weight - Average weight (pounds)
Weight - Average BMI
Weight - People that are obese (%)
Weight - People that ever were obese (%)
Weight - People trying to lose weight (%)
100%
urban population.
Estimated median house/condo value in 2022: $221,834
48127:
$221,834Michigan:
$224,400
According to our research of Michigan and other state lists, there were 41 registered sex offenders living in 48127 zip code as of April 27, 2024 . The ratio of all residents to sex offenders in zip code 48127 is 890 to 1.The ratio of registered sex offenders to all residents in this zip code is much lower than the state average.
Median resident age: This zip code:
35.2 yearsMichigan median age:
40.3 years
Average household size: This zip code:
2.8 peopleMichigan:
2.4 people
Averages for the 2020 tax year for zip code 48127, filed in 2021:
Average Adjusted Gross Income (AGI) in 2020: $50,500 (Individual Income Tax Returns) Here:
$50,500State:
$68,945
Salary/wage: $43,253 (reported on 70.4% of returns )Here:
$43,253State:
$57,142
(% of AGI for various income ranges: 856.2% for AGIs below $25k , 2911.4% for AGIs $25k-50k , 6164.1% for AGIs $50k-75k , 9418.7% for AGIs $75k-100k , 17523.6% for AGIs $100k-200k , 75382.3% for AGIs over 200k ) Taxable interest for individuals: $1,596 (reported on 23.1% of returns )This zip code:
$1,596Michigan:
$1,630
(% of AGI for various income ranges: 15.7% for AGIs below $25k , 26.9% for AGIs $25k-50k , 55.3% for AGIs $50k-75k , 99.6% for AGIs $75k-100k , 164.5% for AGIs $100k-200k , 1600.0% for AGIs over 200k ) Ordinary dividends: $3,917 (reported on 12.8% of returns )(% of AGI for various income ranges: 15.5% for AGIs below $25k , 30.1% for AGIs $25k-50k , 75.1% for AGIs $50k-75k , 144.0% for AGIs $75k-100k , 290.7% for AGIs $100k-200k , 2113.8% for AGIs over 200k ) Net capital gain/loss in AGI: +$11,806 (reported on 15.1% of returns )Here:
+$11,806State:
+$20,064
(% of AGI for various income ranges: 5.9% for AGIs below $25k , 41.2% for AGIs $25k-50k , 125.1% for AGIs $50k-75k , 174.6% for AGIs $75k-100k , 759.3% for AGIs $100k-200k , 17722.3% for AGIs over 200k ) Profit/loss from business: +$6,748 (reported on 20.5% of returns )Here:
+$6,748State:
+$11,172
(% of AGI for various income ranges: 146.1% for AGIs below $25k , 194.6% for AGIs $25k-50k , 201.5% for AGIs $50k-75k , 163.2% for AGIs $75k-100k , 340.2% for AGIs $100k-200k , 3081.5% for AGIs over 200k ) Taxable individual retirement arrangement distribution: $15,223 (reported on 6.3% of returns )48127:
$15,223Michigan:
$19,803
(% of AGI for various income ranges: 33.5% for AGIs below $25k , 71.8% for AGIs $25k-50k , 188.0% for AGIs $50k-75k , 289.8% for AGIs $75k-100k , 542.4% for AGIs $100k-200k , 2962.3% for AGIs over 200k ) Total itemized deductions: $36,497 (reported on 4.5% of returns )Here:
$36,497State:
$34,117
(% of AGI for various income ranges: 18.0% for AGIs below $25k , 83.0% for AGIs $25k-50k , 209.2% for AGIs $50k-75k , 342.3% for AGIs $75k-100k , 738.3% for AGIs $100k-200k , 11532.3% for AGIs over 200k ) Charity contributions: $11,778 (reported on 3.7% of returns )Here:
$11,778State:
$13,548
(% of AGI for various income ranges: 1.8% for AGIs below $25k , 13.5% for AGIs $25k-50k , 43.8% for AGIs $50k-75k , 57.0% for AGIs $75k-100k , 193.9% for AGIs $100k-200k , 3845.4% for AGIs over 200k ) Taxes paid: $7,678 (reported on 4.5% of returns )(% of AGI for various income ranges: 3.8% for AGIs below $25k , 19.8% for AGIs $25k-50k , 56.7% for AGIs $50k-75k , 109.0% for AGIs $75k-100k , 229.2% for AGIs $100k-200k , 1389.2% for AGIs over 200k ) Earned income credit: $2,659 (reported on 20.9% of returns )(% of AGI for various income ranges: 112.8% for AGIs below $25k , 121.7% for AGIs $25k-50k , 3.6% for AGIs $50k-75k ) Percentage of individuals using paid preparers for their 2020 taxes: 95.0%(% for various income ranges: 95.6% for AGIs below $25k , 94.8% for AGIs $25k-50k , 94.6% for AGIs $50k-75k , 93.7% for AGIs $75k-100k , 94.5% for AGIs $100k-200k , 94.4% for AGIs over 200k )
Averages for the 2012 tax year for zip code 48127, filed in 2013:
Average Adjusted Gross Income (AGI) in 2012: $44,414 (Individual Income Tax Returns) Here:
$44,414State:
$55,609
Salary/wage: $38,925 (reported on 75.4% of returns )Here:
$38,925State:
$46,782
(% of AGI for various income ranges: 61.3% for AGIs below $25k , 70.3% for AGIs $25k-50k , 71.2% for AGIs $50k-75k , 73.1% for AGIs $75k-100k , 70.3% for AGIs $100k-200k , 45.9% for AGIs over 200k ) Taxable interest for individuals: $1,343 (reported on 35.6% of returns )This zip code:
$1,343Michigan:
$1,491
(% of AGI for various income ranges: 1.5% for AGIs below $25k , 1.1% for AGIs $25k-50k , 1.0% for AGIs $50k-75k , 0.9% for AGIs $75k-100k , 1.1% for AGIs $100k-200k , 0.9% for AGIs over 200k ) Ordinary dividends: $3,774 (reported on 19.1% of returns )(% of AGI for various income ranges: 1.6% for AGIs below $25k , 1.5% for AGIs $25k-50k , 1.5% for AGIs $50k-75k , 1.6% for AGIs $75k-100k , 1.7% for AGIs $100k-200k , 1.8% for AGIs over 200k ) Net capital gain/loss in AGI: +$2,690 (reported on 15.1% of returns )Here:
+$2,690State:
+$9,326
(% of AGI for various income ranges: 0.4% for AGIs $50k-75k , 0.5% for AGIs $75k-100k , 0.9% for AGIs $100k-200k , 4.1% for AGIs over 200k ) Profit/loss from business: +$9,587 (reported on 14.6% of returns )Here:
+$9,587State:
+$11,523
(% of AGI for various income ranges: 14.3% for AGIs below $25k , 3.1% for AGIs $25k-50k , 1.5% for AGIs $50k-75k , 1.1% for AGIs $75k-100k , 1.1% for AGIs $100k-200k , 0.8% for AGIs over 200k ) Taxable individual retirement arrangement distribution: $12,435 (reported on 11.4% of returns )48127:
$12,435Michigan:
$15,298
(% of AGI for various income ranges: 3.1% for AGIs below $25k , 2.9% for AGIs $25k-50k , 3.2% for AGIs $50k-75k , 3.1% for AGIs $75k-100k , 3.9% for AGIs $100k-200k , 2.8% for AGIs over 200k ) Total itemized deductions: $18,736 (20% of AGI, reported on 25.5% of returns )Here:
$18,736State:
$21,628
Here:
20.2% of AGIState:
18.4% of AGI
(% of AGI for various income ranges: 7.4% for AGIs below $25k , 9.5% for AGIs $25k-50k , 11.2% for AGIs $50k-75k , 11.3% for AGIs $75k-100k , 12.6% for AGIs $100k-200k , 11.3% for AGIs over 200k ) Charity contributions: $3,116 (reported on 21.6% of returns )(% of AGI for various income ranges: 0.6% for AGIs below $25k , 1.1% for AGIs $25k-50k , 1.5% for AGIs $50k-75k , 1.5% for AGIs $75k-100k , 2.0% for AGIs $100k-200k , 2.2% for AGIs over 200k ) Taxes paid: $7,093 (reported on 25.3% of returns )(% of AGI for various income ranges: 1.9% for AGIs below $25k , 2.8% for AGIs $25k-50k , 3.8% for AGIs $50k-75k , 4.4% for AGIs $75k-100k , 5.5% for AGIs $100k-200k , 5.2% for AGIs over 200k ) Earned income credit: $2,797 (reported on 22.4% of returns )(% of AGI for various income ranges: 9.3% for AGIs below $25k , 1.3% for AGIs $25k-50k ) Percentage of individuals using paid preparers for their 2012 taxes: 70.4%(% for various income ranges: 70.5% for AGIs below $25k , 69.6% for AGIs $25k-50k , 67.9% for AGIs $50k-75k , 70.5% for AGIs $75k-100k , 72.6% for AGIs $100k-200k , 88.5% for AGIs over 200k )
Averages for the 2004 tax year for zip code 48127, filed in 2005:
Average Adjusted Gross Income (AGI) in 2004: $43,491 (Individual Income Tax Returns) Here:
$43,491State:
$48,204
Salary/wage: $39,602 (reported on 77.5% of returns )Here:
$39,602State:
$42,791
(% of AGI for various income ranges: 85.2% for AGIs below $10k , 56.5% for AGIs $10k-25k , 70.9% for AGIs $25k-50k , 75.6% for AGIs $50k-75k , 77.8% for AGIs $75k-100k , 64.9% for AGIs over 100k ) Taxable interest for individuals: $2,107 (reported on 56.1% of returns )This zip code:
$2,107Michigan:
$1,725
(% of AGI for various income ranges: 8.5% for AGIs below $10k , 5.0% for AGIs $10k-25k , 2.8% for AGIs $25k-50k , 2.1% for AGIs $50k-75k , 1.6% for AGIs $75k-100k , 2.8% for AGIs over 100k ) Taxable dividends: $2,824 (reported on 30.6% of returns )(% of AGI for various income ranges: 5.0% for AGIs below $10k , 2.6% for AGIs $10k-25k , 1.9% for AGIs $25k-50k , 1.7% for AGIs $50k-75k , 1.6% for AGIs $75k-100k , 2.2% for AGIs over 100k ) Net capital gain/loss: +$3,917 (reported on 22.5% of returns )Here:
+$3,917State:
+$8,532
(% of AGI for various income ranges: -2.0% for AGIs below $10k , -0.1% for AGIs $10k-25k , 0.3% for AGIs $25k-50k , 1.0% for AGIs $50k-75k , 1.2% for AGIs $75k-100k , 5.6% for AGIs over 100k ) Profit/loss from business: +$9,398 (reported on 10.8% of returns )Here:
+$9,398State:
+$9,547
(% of AGI for various income ranges: 8.1% for AGIs below $10k , 6.9% for AGIs $10k-25k , 2.2% for AGIs $25k-50k , 1.5% for AGIs $50k-75k , 1.4% for AGIs $75k-100k , 2.0% for AGIs over 100k ) IRA payment deduction: $2,915 (reported on 2.1% of returns )48127:
$2,915Michigan:
$2,875
(% of AGI for various income ranges: 0.3% for AGIs below $10k , 0.2% for AGIs $10k-25k , 0.2% for AGIs $25k-50k , 0.1% for AGIs $50k-75k , 0.1% for AGIs $75k-100k , 0.1% for AGIs over 100k ) Self-employed pension: $12,211 (reported on 0.2% of returns )Here:
$12,211Michigan:
$13,826
Total itemized deductions: $16,732 (23% of AGI, reported on 39.4% of returns )Here:
$16,732State:
$18,509
Here:
23.5% of AGIState:
20.7% of AGI
(% of AGI for various income ranges: 15.3% for AGIs below $10k , 12.6% for AGIs $10k-25k , 15.0% for AGIs $25k-50k , 15.9% for AGIs $50k-75k , 15.9% for AGIs $75k-100k , 14.9% for AGIs over 100k ) Charity contributions deductions: $2,503 (3% of AGI, reported on 35.2% of returns )Here:
3.4% of AGIState:
3.6% of AGI
(% of AGI for various income ranges: 1.0% for AGIs below $10k , 1.1% for AGIs $10k-25k , 1.6% for AGIs $25k-50k , 2.0% for AGIs $50k-75k , 2.2% for AGIs $75k-100k , 2.6% for AGIs over 100k ) Total tax: $5,840 (reported on 76.5% of returns )(% of AGI for various income ranges: 3.2% for AGIs below $10k , 4.0% for AGIs $10k-25k , 6.9% for AGIs $25k-50k , 9.2% for AGIs $50k-75k , 10.2% for AGIs $75k-100k , 16.0% for AGIs over 100k ) Earned income credit: $1,842 (reported on 11.3% of returns )Percentage of individuals using paid preparers for their 2004 taxes: 67.9%(% for various income ranges: 64.5% for AGIs below $10k , 70.4% for AGIs $10k-25k , 68.0% for AGIs $25k-50k , 66.4% for AGIs $50k-75k , 69.8% for AGIs $75k-100k , 70.2% for AGIs over 100k )
Estimated median household income in 2022: This zip code:
$58,215Michigan:
$66,986
Nearest zip codes: 48128 ,
48239 ,
48124 ,
48141 ,
48135 ,
48125 .
Dearborn Heights Zip Code Map
Percentage of family households: This zip code:
48.1%Michigan:
43.3%
Percentage of households with unmarried partners: This zip code:
3.8%Michigan:
45.7%
Likely homosexual households (counted as self-reported same-sex unmarried-partner households)
Lesbian couples: 0.1% of all households Gay men: 0.1% of all households
Household received Food Stamps/SNAP in the past 12 months: 2,961Household did not receive Food Stamps/SNAP in the past 12 months: 11,259
Women who had a birth in the past 12 months: 557 (488 now married , 77 unmarried) Women who did not have a birth in the past 12 months: 9,068 (4,236 now married , 4,817 unmarried)
Housing units in zip code 48127 with a mortgage: 5,163 (439
second mortgage , 14
home equity loan , 315
both second mortgage and home equity loan )
Houses without a mortgage: 284
Median monthly owner costs for units with a mortgage: $1,540
Median monthly owner costs for units without a mortgage: $654
Residents with income below the poverty level in 2022:
This zip code:
21.9%Whole state:
13.4%
Residents with income below 50% of the poverty level in 2022:
This zip code:
12.8%Whole state:
6.9%
Median number of rooms in houses and condos: Median number of rooms in apartments: Notable locations in this zip code not listed on our city pages
Click to draw/clear zip code borders Notable locations in zip code 48127: (A) , Dearborn Heights Chamber of Commerce (B) , Dearborn Heights City Hall (C) , Dearborn Heights Fire Station (D) , Dearborn Heights Library (E) , Dearborn Heights Police Station (F) , Oakwood Healthcare Center - Dearborn Heights (G) , Dearborn Heights Fire Department Station 2 Headquarters (H) . Display/hide their locations on the map
Shopping Centers: (1) , Tele-Joy Shopping Center (2) . Display/hide their locations on the map
Churches in zip code 48127 include: (A) , Saint Thomas Aquinas Parish Center (B) . Display/hide their locations on the map
Cemeteries: (1) , Wallaceville Cemetery (2) . Display/hide their locations on the map
River: (A) . Display/hide its location on the map
Parks in zip code 48127 include: (1) , Wallaceville School Historical Marker (2) , Parkland Community Park (3) , Dearborn Heights Municipal Park (4) , Warrendale Park (5) . Display/hide their locations on the map
Year house built (houses)
0 2020 or later193 2010 to 2019738 2000 to 2009208 1990 to 1999619 1980 to 19891,978 1970 to 19793,449 1960 to 19695,733 1950 to 1959878 1940 to 1949620 1939 or earlier
Zip code 48127 household income distribution in 2022 1,349 Less than $10,000517 $10,000 to $14,999755 $15,000 to $19,999729 $20,000 to $24,999846 $25,000 to $29,999641 $30,000 to $34,999508 $35,000 to $39,999555 $40,000 to $44,999446 $45,000 to $49,999861 $50,000 to $59,9991,448 $60,000 to $74,9991,813 $75,000 to $99,9991,003 $100,000 to $124,999988 $125,000 to $149,9991,006 $150,000 to $199,999721 $200,000 or moreEstimate of home value of owner-occupied houses/condos in 2022 in zip code 48127 133 Less than $10,00051 $10,000 to $14,999124 $15,000 to $19,99913 $20,000 to $24,99919 $25,000 to $29,99918 $30,000 to $34,99913 $35,000 to $39,99964 $40,000 to $49,999101 $50,000 to $59,99920 $60,000 to $69,99956 $70,000 to $79,999187 $80,000 to $89,999133 $90,000 to $99,999549 $100,000 to $124,999780 $125,000 to $149,9991,409 $150,000 to $174,999960 $175,000 to $199,9992,083 $200,000 to $249,9991,084 $250,000 to $299,999993 $300,000 to $399,999889 $400,000 to $499,999337 $500,000 to $749,999117 $750,000 to $999,99943 $1,000,000 to $1,499,9999 $1,500,000 to $1,999,999Rent paid by renters in 2022 in zip code 48127 20 $150 to $19927 $200 to $249142 $250 to $29930 $300 to $3494 $350 to $39945 $400 to $44928 $450 to $49920 $500 to $549217 $550 to $59944 $600 to $64920 $650 to $69960 $700 to $749213 $750 to $799333 $800 to $899493 $900 to $9991,062 $1,000 to $1,249407 $1,250 to $1,499219 $1,500 to $1,99936 $2,500 to $2,999239 No cash rent
Median gross rent in 2022: $1,174.
Median price asked for vacant for-sale houses and condos in 2022: $268,242.
Estimated median house (or condo) value in 2022 for: White Non-Hispanic householders: $222,343Black or African American householders: $228,127American Indian or Alaska Native householders: $438,393Asian householders: $259,429Some other race householders: $190,531Two or more races householders: $272,698Hispanic or Latino householders: $199,037Estimated median house or condo value in 2022: $221,834
48127:
$221,834Michigan:
$224,400
Lower value quartile - upper value quartile: $162,097 - $300,150
Mean price in 2022: Detached houses: $212,220Here:
$212,220State:
$280,038
Townhouses or other attached units: $116,502Here:
$116,502State:
$239,520
In 2-unit structures: $407,943Here:
$407,943State:
$219,481
In 3-to-4-unit structures: $267,245Here:
$267,245State:
$207,067
In 5-or-more-unit structures: $26,503Here:
$26,503State:
$192,733
Mobile homes: $45,525Here:
$45,525State:
$72,868
Housing units in structures:
One, detached: 11,689One, attached: 347Two: 203 or 4: 8965 to 9: 66110 to 19: 14420 to 49: 13350 or more: 579Mobile homes: 224Unemployment : 6.6%
Means of transportation to work in zip code 48127 74.5% 11,816 Drove a car alone9.7% 1,541 Carpooled0.4% 60 Bus or trolley bus0.5% 78 Taxi0.3% 40 Motorcycle0.4% 57 Walked1.6% 246 Other means12.8% 2,023 Worked at homeTravel time to work (commute) in zip code 48127 206 Less than 5 minutes819 5 to 9 minutes1,560 10 to 14 minutes2,580 15 to 19 minutes3,536 20 to 24 minutes1,288 25 to 29 minutes1,877 30 to 34 minutes423 35 to 39 minutes422 40 to 44 minutes673 45 to 59 minutes329 60 to 89 minutes80 90 or more minutes
Neighborhoods in zip code 48127: Percentage of zip code residents living and working in this county: 87.6%
Household type by relationship:
Households: 40,296
Male householders: 7,811 (1,846 living alone ), Female householders: 6,301 (2,252 living alone )7,569 spouses (7,535 opposite-sex spouses ), 417 unmarried partners , (405 opposite-sex unmarried partners ), 14,811 children (14,454 natural , 145 adopted , 220 stepchildren ), 408 grandchildren , 744 brothers or sisters , 904 parents , 83 foster children , 348 other relatives , 488 non-relatives In group quarters: 162 (-1 institutionalized population )
Size of family households: 3,580 2-persons , 1,894 3-persons , 1,852 4-persons , 1,319 5-persons , 737 6-persons , 281 7-or-more-persons
Size of nonfamily households: 4,099 1-person , 280 2-persons , 17 7-or-more-persons
8,120 married couples with children. single-parent households (271 men , 1,186 women ).
46.5% of residents of 48127 zip code speak English at home. of residents speak Spanish at home (49% very well, 35% well, 16% not well ).of residents speak other Indo-European language at home (62% very well, 29% well, 7% not well, 3% not at all ).of residents speak Asian or Pacific Island language at home (90% very well, 8% well, 2% not well ).of residents speak other language at home (60% very well, 22% well, 14% not well, 4% not at all ).
Foreign born population: 12,553 (31.2%)
(78.7%
of them are naturalized citizens )
This zip code:
31.2%Whole state:
6.9%
50% Kuwait 16% Georgia 3% Sudan 2% Honduras 2% Bhutan 2% Moldova 2% Senegal 44% Lebanese 10% Iraqi 6% Polish 5% American 3% Arab 2% Italian 2% Irish
Year of entry for the foreign-born population
4,465 2010 or later 2,585 2000 to 2009 3,473 1990 to 1999 2,572 Before 1990
Facilities with environmental interests located in this zip code:
AMOCO OIL CO 0143 SAMS (25415 FORD in DEARBORN HEIGHTS, MI)
(Resource Conservation and Recovery Act (tracking hazardous waste)) Organizations: BEYDOUN BROS ENTERPRISES (CONTACT/OPERATOR)
AMOCO OIL CO 0196 (25412 MICHIGAN in DEARBORN HEIGHTS, MI)
(Resource Conservation and Recovery Act (tracking hazardous waste)) Organizations: AMOCO OIL COMPANY (CONTACT/OWNER)
AMOCO OIL CO 5796 LLOYDS STANDARD SVC (27000 CHERRY HILL RD in DEARBORN HEIGHTS, MI)
(Resource Conservation and Recovery Act (tracking hazardous waste)) Organizations: AMOCO OIL COMPANY (CONTACT/OWNER)
AMOCO OIL CO 9732 (24035 JOY RD in DEARBORN HEIGHTS, MI)
(Resource Conservation and Recovery Act (tracking hazardous waste)) Organizations: AMOCO OIL COMPANY (CONTACT/OWNER)
ALEXANDER CLEANERS (24551 W WARREN in DEARBORN HEIGHTS, MI)
(Resource Conservation and Recovery Act (tracking hazardous waste))
BELLE TIRE DISTRIBUTORS INC (8470 N TELEGRAPH in DEARBORN HEIGHTS, MI)
Small Quantity Generators, between 100 kg and 1000 kg of hazardous waste/month (Resource Conservation and Recovery Act (tracking hazardous waste)) Organizations: DON BARNES (CONTACT/OWNER)
DETROIT WORLD OUTREACH CHRISTIAN ACADEMY (24425 HASS in DEARBORN HEIGHTS, MI)
(Resource Conservation and Recovery Act (tracking hazardous waste))
AMERICAN SERVICE STATION (25830 FORD RD in DEARBORN HEIGHTS, MI)
Small Quantity Generators, between 100 kg and 1000 kg of hazardous waste/month (Resource Conservation and Recovery Act (tracking hazardous waste)) - notification Organizations: BAZZY MICHAEL (CONTACT/OWNER)
EQUILON ENTERPRISES LLC (5624 N TELEGRAPH RD in DEARBORN HEIGHTS, MI)
Small Quantity Generators, between 100 kg and 1000 kg of hazardous waste/month (Resource Conservation and Recovery Act (tracking hazardous waste)) Alternative names: SHELL OIL CO
Housing units lacking complete plumbing facilities: 0.4%
Housing units lacking complete kitchen facilities: 1.6%
83.4% Utility gas 14.8% Electricity 0.6% No fuel used 0.5% Bottled, tank, or LP gas
Population in 1990: 36,123.
Place of birth for U.S.-born residents:
This state: 25,122Northeast: 405Midwest: 539South: 660West: 247
68% of the 48127 zip code residents lived in the same house 5 years ago.
Out of people who lived in different houses, 80% lived in this county.
Out of people who lived in different counties, 50% lived in Michigan.
90% of the 48127 zip code residents lived in the same house 1 year ago.
Out of people who lived in different houses, 72% moved from this county.
Out of people who lived in different houses, 1% moved from different county within same state.
Out of people who lived in different houses, 9% moved from different state.
Out of people who lived in different houses, 19% moved from abroad.
Private vs. public school enrollment:
Students in private schools in grades 1 to 8 (elementary and middle school): 655
Students in private schools in grades 9 to 12 (high school): 240
Students in private undergraduate colleges: 455
Occupation by median earnings in the past 12 months ($)
94,520 Computer and mathematical occupations 89,783 Business and financial operations occupations 85,621 Architecture and engineering occupations 72,947 Legal occupations 70,515 Law enforcement workers including supervisors 68,101 Health diagnosing and treating practitioners and other technical occupations
Companies with federal contracts located in this zip code:
ULTIMATE SUPPORT AND SERVICES (6995 DACOSTA in DEARBORN HEIGH, MI; small business) in 5 contracts from 2001 to 2004
Contracts for Program Management/Support Services by ArmySigned by year: 2000: $0; 2001: $548,267; 2002: $0; 2003: $191,557; 2004: $125,348; 2005: $0; 2006: $0.
Biggest contracts: with Army for Program Management/Support Services. Signed on 2001-07-05. Completion date: 2003-06-30.
, same as above. Signed on 2004-02-27. Completion date: 2004-07-31.
, same as above. Signed on 2003-06-27. Completion date: 2004-07-31.
, same as above. Signed on 2003-10-29. Completion date: 2004-07-31.
Top industries in this zip code by the number of employees in 2005:
Accommodation and Food Services: Full-Service Restaurants (100-249 employees: 1 establishment, 50-99 employees: 4 establishments, 20-49 employees: 5 establishments, 10-19 employees: 6 establishments, 5-9 employees: 3 establishments, 1-4 employees: 6 establishments)Accommodation and Food Services: Limited-Service Restaurants (50-99: 2, 20-49: 8, 10-19: 7, 1-4: 10)Educational Services: Elementary and Secondary Schools (250-499: 1, 5-9: 1)Other Services (except Public Administration): Religious Organizations (20-49: 3, 10-19: 5, 5-9: 2, 1-4: 10)Health Care and Social Assistance: Offices of Dentists (20-49: 1, 10-19: 4, 5-9: 7, 1-4: 11)Health Care and Social Assistance: Nursing Care Facilities (100-249: 1)Health Care and Social Assistance: Offices of Physicians (except Mental Health Specialists) (10-19: 4, 5-9: 8, 1-4: 14)
People in group quarters in 2010:
160 people in residential treatment centers for juveniles (non-correctional)
120 people in nursing facilities/skilled-nursing facilities
58 people in group homes intended for adults
16 people in other noninstitutional facilities
People in group quarters in 2000:
152 people in homes for abused, dependent, and neglected children
128 people in nursing homes
64 people in other noninstitutional group quarters
35 people in homes for the mentally retarded
29 people in religious group quarters
16 people in homes for the mentally ill
8 people in local jails and other confinement facilities (including police lockups)
6 people in homes for the physically handicapped
6 people in other group homes
Fatal accident statistics in 2014:
Fatal accident count: 1Vehicles involved in fatal accidents: 4Fatal accidents caused by drunken drivers: 0Fatalities: 1Persons involved in fatal accidents: 4Pedestrians involved in fatal accidents: 0
Fatal accident statistics in 2013:
Fatal accident count: 1Vehicles involved in fatal accidents: 1Fatal accidents caused by drunken drivers: 0Fatalities: 1Persons involved in fatal accidents: 1Pedestrians involved in fatal accidents: 1
Home Mortgage Disclosure Act Aggregated Statistics For Year 2009(Based on 17 full tracts) A) FHA, FSA/RHS & VA B) Conventional C) Refinancings D) Home Improvement Loans F) Non-occupant Loans on G) Loans On Manufactured Number Average Value Number Average Value Number Average Value Number Average Value Number Average Value Number Average Value
LOANS ORIGINATED 356 $99,991 206 $94,336 386 $135,387 24 $27,653 71 $68,318 0 $0 APPLICATIONS APPROVED, NOT ACCEPTED 16 $91,388 41 $70,615 52 $171,537 2 $3,500 18 $69,264 2 $37,960 APPLICATIONS DENIED 117 $107,374 105 $128,882 252 $142,164 64 $32,534 36 $77,081 2 $57,850 APPLICATIONS WITHDRAWN 81 $100,342 39 $102,287 124 $150,842 10 $61,308 23 $101,742 0 $0 FILES CLOSED FOR INCOMPLETENESS 6 $130,500 15 $100,929 29 $136,265 0 $0 6 $63,972 0 $0
Aggregated Statistics For Year 2008(Based on 17 full tracts) A) FHA, FSA/RHS & VA B) Conventional C) Refinancings D) Home Improvement Loans E) Loans on Dwellings For 5+ Families F) Non-occupant Loans on G) Loans On Manufactured Number Average Value Number Average Value Number Average Value Number Average Value Number Average Value Number Average Value Number Average Value
LOANS ORIGINATED 221 $117,168 417 $123,653 441 $137,132 54 $30,766 2 $1,653,180 101 $76,247 1 $20,000 APPLICATIONS APPROVED, NOT ACCEPTED 22 $119,184 45 $157,687 107 $136,964 19 $53,901 0 $0 17 $98,570 2 $70,920 APPLICATIONS DENIED 45 $118,952 257 $170,381 475 $158,407 90 $51,363 0 $0 68 $102,691 7 $30,000 APPLICATIONS WITHDRAWN 23 $127,353 97 $136,974 133 $176,399 1 $75,000 0 $0 23 $63,095 2 $37,960 FILES CLOSED FOR INCOMPLETENESS 2 $59,000 36 $186,646 57 $145,169 2 $10,000 0 $0 8 $137,444 0 $0
Aggregated Statistics For Year 2007(Based on 17 full tracts) A) FHA, FSA/RHS & VA B) Conventional C) Refinancings D) Home Improvement Loans F) Non-occupant Loans on G) Loans On Manufactured Number Average Value Number Average Value Number Average Value Number Average Value Number Average Value Number Average Value
LOANS ORIGINATED 59 $131,394 999 $134,953 940 $130,592 100 $47,112 131 $105,360 6 $38,293 APPLICATIONS APPROVED, NOT ACCEPTED 1 $127,000 261 $171,671 256 $148,072 13 $73,105 30 $166,929 0 $0 APPLICATIONS DENIED 7 $132,623 594 $182,612 949 $155,756 170 $34,736 100 $118,673 4 $55,210 APPLICATIONS WITHDRAWN 10 $117,659 204 $140,524 340 $151,218 16 $140,587 28 $146,682 0 $0 FILES CLOSED FOR INCOMPLETENESS 2 $149,355 44 $213,409 100 $153,499 5 $171,846 7 $115,791 0 $0
Aggregated Statistics For Year 2006(Based on 17 full tracts) A) FHA, FSA/RHS & VA B) Conventional C) Refinancings D) Home Improvement Loans E) Loans on Dwellings For 5+ Families F) Non-occupant Loans on G) Loans On Manufactured Number Average Value Number Average Value Number Average Value Number Average Value Number Average Value Number Average Value Number Average Value
LOANS ORIGINATED 74 $139,717 1,590 $129,126 1,390 $130,554 130 $73,243 3 $4,492,420 193 $122,870 1 $36,000 APPLICATIONS APPROVED, NOT ACCEPTED 0 $0 456 $147,162 401 $145,787 41 $65,215 0 $0 74 $128,804 0 $0 APPLICATIONS DENIED 10 $145,128 849 $155,498 1,145 $154,337 152 $42,224 0 $0 127 $138,699 8 $39,645 APPLICATIONS WITHDRAWN 11 $129,057 300 $164,300 545 $151,589 21 $51,834 0 $0 41 $146,941 0 $0 FILES CLOSED FOR INCOMPLETENESS 2 $64,290 67 $187,425 166 $161,208 8 $45,012 0 $0 7 $266,926 0 $0
Aggregated Statistics For Year 2005(Based on 17 full tracts) A) FHA, FSA/RHS & VA B) Conventional C) Refinancings D) Home Improvement Loans F) Non-occupant Loans on G) Loans On Manufactured Number Average Value Number Average Value Number Average Value Number Average Value Number Average Value Number Average Value
LOANS ORIGINATED 87 $154,244 1,547 $124,527 1,676 $135,320 137 $55,845 151 $108,736 4 $28,448 APPLICATIONS APPROVED, NOT ACCEPTED 11 $148,455 319 $135,756 385 $141,972 34 $92,113 41 $166,142 6 $28,635 APPLICATIONS DENIED 15 $130,961 605 $154,758 1,130 $191,111 141 $43,283 84 $106,550 20 $32,129 APPLICATIONS WITHDRAWN 6 $160,815 266 $157,988 637 $147,125 66 $140,890 23 $135,703 2 $74,805 FILES CLOSED FOR INCOMPLETENESS 1 $229,000 51 $100,495 299 $160,685 8 $66,692 6 $112,207 0 $0
Aggregated Statistics For Year 2004(Based on 17 full tracts) A) FHA, FSA/RHS & VA B) Conventional C) Refinancings D) Home Improvement Loans E) Loans on Dwellings For 5+ Families F) Non-occupant Loans on G) Loans On Manufactured Number Average Value Number Average Value Number Average Value Number Average Value Number Average Value Number Average Value Number Average Value
LOANS ORIGINATED 128 $143,875 1,293 $129,884 1,916 $134,242 116 $75,752 2 $99,900 143 $107,344 4 $29,468 APPLICATIONS APPROVED, NOT ACCEPTED 15 $131,658 300 $139,354 376 $144,285 27 $47,586 0 $0 34 $138,241 1 $152,000 APPLICATIONS DENIED 17 $151,176 329 $146,135 936 $150,536 155 $66,867 0 $0 53 $133,030 3 $20,313 APPLICATIONS WITHDRAWN 11 $124,612 155 $124,282 566 $143,296 26 $44,568 0 $0 19 $85,879 0 $0 FILES CLOSED FOR INCOMPLETENESS 7 $133,137 51 $150,515 165 $147,580 8 $69,508 0 $0 11 $142,323 0 $0
Aggregated Statistics For Year 2003(Based on 17 full tracts) A) FHA, FSA/RHS & VA B) Conventional C) Refinancings D) Home Improvement Loans F) Non-occupant Loans on Number Average Value Number Average Value Number Average Value Number Average Value Number Average Value
LOANS ORIGINATED 150 $133,799 944 $142,708 4,298 $128,195 105 $33,099 156 $100,488 APPLICATIONS APPROVED, NOT ACCEPTED 14 $115,650 124 $126,049 593 $130,416 44 $42,830 23 $81,328 APPLICATIONS DENIED 27 $143,996 187 $175,617 925 $144,132 151 $14,370 21 $401,770 APPLICATIONS WITHDRAWN 7 $137,167 104 $164,009 720 $139,568 17 $46,875 23 $102,720 FILES CLOSED FOR INCOMPLETENESS 16 $136,546 55 $156,530 182 $139,465 7 $42,106 6 $78,952
Aggregated Statistics For Year 2002(Based on 14 full tracts) A) FHA, FSA/RHS & VA B) Conventional C) Refinancings D) Home Improvement Loans F) Non-occupant Loans on Number Average Value Number Average Value Number Average Value Number Average Value Number Average Value
LOANS ORIGINATED 233 $137,024 796 $125,806 2,449 $114,878 128 $24,691 99 $86,302 APPLICATIONS APPROVED, NOT ACCEPTED 1 $131,000 88 $117,720 308 $119,608 36 $9,546 14 $98,246 APPLICATIONS DENIED 17 $146,927 134 $119,650 583 $102,706 106 $16,529 19 $67,917 APPLICATIONS WITHDRAWN 34 $121,688 81 $125,307 437 $112,801 17 $42,291 14 $68,701 FILES CLOSED FOR INCOMPLETENESS 2 $74,185 31 $126,013 156 $135,684 2 $24,935 6 $75,360
Aggregated Statistics For Year 2001(Based on 14 full tracts) A) FHA, FSA/RHS & VA B) Conventional C) Refinancings D) Home Improvement Loans F) Non-occupant Loans on Number Average Value Number Average Value Number Average Value Number Average Value Number Average Value
LOANS ORIGINATED 263 $130,279 740 $119,181 2,318 $109,390 187 $22,991 104 $85,323 APPLICATIONS APPROVED, NOT ACCEPTED 0 $0 61 $112,277 263 $101,487 62 $19,201 13 $74,825 APPLICATIONS DENIED 13 $110,048 84 $130,966 663 $99,386 201 $17,330 20 $106,024 APPLICATIONS WITHDRAWN 25 $130,126 49 $106,010 431 $93,085 22 $39,293 6 $100,948 FILES CLOSED FOR INCOMPLETENESS 12 $112,960 20 $152,780 146 $108,880 2 $54,400 7 $96,481
Aggregated Statistics For Year 2000(Based on 14 full tracts) A) FHA, FSA/RHS & VA B) Conventional C) Refinancings D) Home Improvement Loans E) Loans on Dwellings For 5+ Families F) Non-occupant Loans on Number Average Value Number Average Value Number Average Value Number Average Value Number Average Value Number Average Value
LOANS ORIGINATED 216 $118,207 727 $105,337 571 $87,059 181 $14,670 2 $472,955 75 $75,111 APPLICATIONS APPROVED, NOT ACCEPTED 8 $108,004 74 $96,715 119 $86,348 97 $24,715 0 $0 13 $78,800 APPLICATIONS DENIED 24 $127,056 140 $91,877 315 $70,418 140 $19,856 0 $0 8 $84,565 APPLICATIONS WITHDRAWN 19 $111,590 79 $99,701 192 $85,796 27 $42,847 0 $0 13 $88,725 FILES CLOSED FOR INCOMPLETENESS 2 $132,540 20 $101,874 69 $100,489 0 $0 0 $0 0 $0
Aggregated Statistics For Year 1999(Based on 9 full tracts) A) FHA, FSA/RHS & VA B) Conventional C) Refinancings D) Home Improvement Loans F) Non-occupant Loans on Number Average Value Number Average Value Number Average Value Number Average Value Number Average Value
LOANS ORIGINATED 142 $104,161 484 $111,840 784 $94,073 157 $20,849 63 $63,530 APPLICATIONS APPROVED, NOT ACCEPTED 2 $91,810 40 $97,315 105 $97,954 55 $15,688 4 $78,228 APPLICATIONS DENIED 6 $86,315 75 $125,126 200 $99,916 62 $23,805 8 $69,518 APPLICATIONS WITHDRAWN 12 $105,578 41 $109,415 186 $94,180 16 $56,652 6 $51,077 FILES CLOSED FOR INCOMPLETENESS 2 $111,000 12 $102,606 57 $89,918 1 $69,780 2 $48,915
Private Mortgage Insurance Companies Aggregated Statistics For Year 2009(Based on 17 full tracts) A) Conventional B) Refinancings C) Non-occupant Loans on Number Average Value Number Average Value Number Average Value
LOANS ORIGINATED 19 $98,044 7 $118,149 1 $144,000 APPLICATIONS APPROVED, NOT ACCEPTED 18 $188,582 3 $113,817 0 $0 APPLICATIONS DENIED 10 $111,759 2 $199,800 0 $0 APPLICATIONS WITHDRAWN 4 $124,255 0 $0 0 $0 FILES CLOSED FOR INCOMPLETENESS 0 $0 0 $0 0 $0
Aggregated Statistics For Year 2008(Based on 17 full tracts) A) Conventional B) Refinancings C) Non-occupant Loans on Number Average Value Number Average Value Number Average Value
LOANS ORIGINATED 168 $149,996 37 $176,184 12 $110,046 APPLICATIONS APPROVED, NOT ACCEPTED 121 $205,453 54 $186,341 4 $174,808 APPLICATIONS DENIED 17 $144,550 0 $0 1 $124,000 APPLICATIONS WITHDRAWN 9 $167,407 2 $142,855 2 $206,770 FILES CLOSED FOR INCOMPLETENESS 6 $121,328 3 $198,453 2 $161,985
Aggregated Statistics For Year 2007(Based on 17 full tracts) A) Conventional B) Refinancings C) Non-occupant Loans on Number Average Value Number Average Value Number Average Value
LOANS ORIGINATED 383 $162,736 95 $166,451 32 $122,731 APPLICATIONS APPROVED, NOT ACCEPTED 49 $190,113 41 $176,341 3 $72,667 APPLICATIONS DENIED 13 $228,215 3 $245,803 2 $144,000 APPLICATIONS WITHDRAWN 24 $215,117 7 $208,683 2 $160,235 FILES CLOSED FOR INCOMPLETENESS 6 $242,102 2 $268,500 2 $125,860
Aggregated Statistics For Year 2006(Based on 17 full tracts) A) Conventional B) Refinancings C) Non-occupant Loans on Number Average Value Number Average Value Number Average Value
LOANS ORIGINATED 143 $153,615 65 $171,043 20 $128,920 APPLICATIONS APPROVED, NOT ACCEPTED 26 $213,876 28 $185,835 1 $275,000 APPLICATIONS DENIED 3 $160,867 1 $854,000 0 $0 APPLICATIONS WITHDRAWN 6 $120,577 7 $230,486 4 $109,215 FILES CLOSED FOR INCOMPLETENESS 3 $147,990 0 $0 0 $0
Aggregated Statistics For Year 2005(Based on 17 full tracts) A) Conventional B) Refinancings C) Non-occupant Loans on Number Average Value Number Average Value Number Average Value
LOANS ORIGINATED 195 $157,531 116 $171,496 14 $137,231 APPLICATIONS APPROVED, NOT ACCEPTED 51 $172,308 33 $156,868 1 $240,000 APPLICATIONS DENIED 1 $279,000 3 $236,823 0 $0 APPLICATIONS WITHDRAWN 10 $173,798 16 $180,859 3 $141,860 FILES CLOSED FOR INCOMPLETENESS 2 $278,720 4 $147,985 0 $0
Aggregated Statistics For Year 2004(Based on 17 full tracts) A) Conventional B) Refinancings C) Non-occupant Loans on Number Average Value Number Average Value Number Average Value
LOANS ORIGINATED 290 $153,630 129 $152,200 23 $105,251 APPLICATIONS APPROVED, NOT ACCEPTED 69 $162,404 60 $170,924 4 $90,890 APPLICATIONS DENIED 7 $189,786 5 $167,320 1 $152,000 APPLICATIONS WITHDRAWN 21 $136,066 8 $139,898 0 $0 FILES CLOSED FOR INCOMPLETENESS 6 $130,120 0 $0 0 $0
Aggregated Statistics For Year 2003(Based on 17 full tracts) A) Conventional B) Refinancings C) Non-occupant Loans on Number Average Value Number Average Value Number Average Value
LOANS ORIGINATED 382 $158,189 314 $150,307 25 $122,280 APPLICATIONS APPROVED, NOT ACCEPTED 51 $157,408 89 $172,658 5 $113,888 APPLICATIONS DENIED 5 $151,594 9 $167,997 2 $95,000 APPLICATIONS WITHDRAWN 17 $151,102 26 $151,157 6 $145,790 FILES CLOSED FOR INCOMPLETENESS 2 $149,610 6 $182,948 0 $0
Aggregated Statistics For Year 2002(Based on 14 full tracts) A) Conventional B) Refinancings C) Non-occupant Loans on Number Average Value Number Average Value Number Average Value
LOANS ORIGINATED 288 $141,335 234 $141,456 23 $100,987 APPLICATIONS APPROVED, NOT ACCEPTED 46 $147,844 51 $126,608 6 $138,282 APPLICATIONS DENIED 8 $159,996 15 $142,145 3 $109,163 APPLICATIONS WITHDRAWN 12 $165,722 28 $138,587 2 $128,985 FILES CLOSED FOR INCOMPLETENESS 0 $0 2 $169,985 0 $0
Aggregated Statistics For Year 2001(Based on 14 full tracts) A) Conventional B) Refinancings C) Non-occupant Loans on Number Average Value Number Average Value Number Average Value
LOANS ORIGINATED 254 $129,733 271 $128,783 10 $85,224 APPLICATIONS APPROVED, NOT ACCEPTED 38 $147,293 52 $133,262 4 $131,328 APPLICATIONS DENIED 15 $116,223 15 $126,579 2 $124,860 APPLICATIONS WITHDRAWN 10 $170,083 6 $151,038 2 $265,705 FILES CLOSED FOR INCOMPLETENESS 0 $0 2 $130,985 0 $0
Aggregated Statistics For Year 2000(Based on 14 full tracts) A) Conventional B) Refinancings C) Non-occupant Loans on Number Average Value Number Average Value Number Average Value
LOANS ORIGINATED 272 $120,197 32 $111,161 14 $78,264 APPLICATIONS APPROVED, NOT ACCEPTED 27 $120,879 6 $81,397 6 $88,475 APPLICATIONS DENIED 12 $117,179 1 $91,000 4 $94,948 APPLICATIONS WITHDRAWN 7 $121,846 3 $140,333 0 $0 FILES CLOSED FOR INCOMPLETENESS 0 $0 0 $0 0 $0
Aggregated Statistics For Year 1999(Based on 9 full tracts) A) Conventional B) Refinancings C) Non-occupant Loans on Number Average Value Number Average Value Number Average Value
LOANS ORIGINATED 178 $121,972 49 $111,769 9 $75,962 APPLICATIONS APPROVED, NOT ACCEPTED 13 $111,829 11 $114,027 0 $0 APPLICATIONS DENIED 7 $140,341 4 $135,692 0 $0 APPLICATIONS WITHDRAWN 6 $130,245 3 $118,667 0 $0 FILES CLOSED FOR INCOMPLETENESS 0 $0 1 $123,000 0 $0
2002 - 2018 National Fire Incident Reporting System (NFIRS) incidents See full 2006 National Fire Incident Reporting System statistics for zip code 48127, Michigan
Most common first names in zip code 48127 among deceased individuals Name Count Lived (average)
John 531 75.3 years Mary 471 80.0 years Joseph 319 75.1 years William 264 74.3 years Helen 258 79.3 years Edward 245 73.9 years Robert 226 69.7 years Frank 210 76.1 years George 208 75.6 years Walter 196 76.1 years
Most common last names in zip code 48127 among deceased individuals Last name Count Lived (average)
Smith 85 73.8 years Miller 48 74.7 years Johnson 44 79.3 years Davis 33 76.4 years Jones 31 71.4 years Anderson 30 77.4 years Williams 29 70.0 years Martin 29 76.8 years Brown 29 77.0 years Thomas 25 72.7 years
Businesses in zip code 48127
Name Count Name Count
7-Eleven 1 Little Caesars Pizza 2 Applebee's 1 McDonald's 2 Arby's 1 Nike 2 Blockbuster 2 Panera Bread 1 Burger King 1 Pizza Hut 1 Curves 1 Quiznos 1 Dairy Queen 2 RadioShack 1 DressBarn 1 Red Lobster 1 Dressbarn 1 Starbucks 2 Famous Footwear 1 T-Mobile 3 Fashion Bug 1 Taco Bell 1 FedEx 1 Target 1 GNC 1 UPS 2 H&R Block 2 Walgreens 2 IHOP 1 Wendy's 1 KFC 1 White Castle 1 Kroger 1
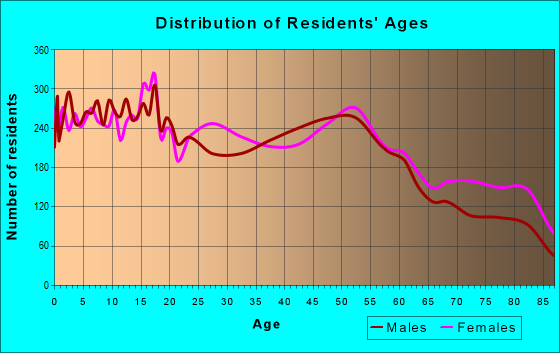
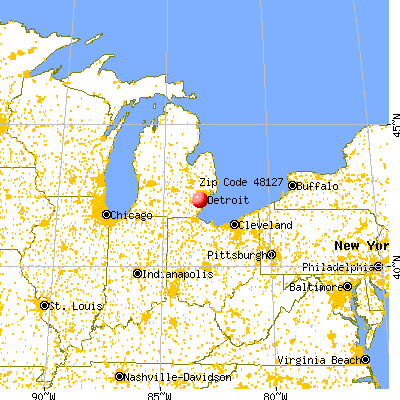


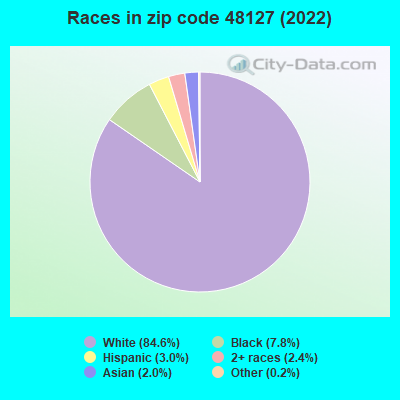


 Nearest zip codes: 48128, 48239, 48124, 48141, 48135, 48125.
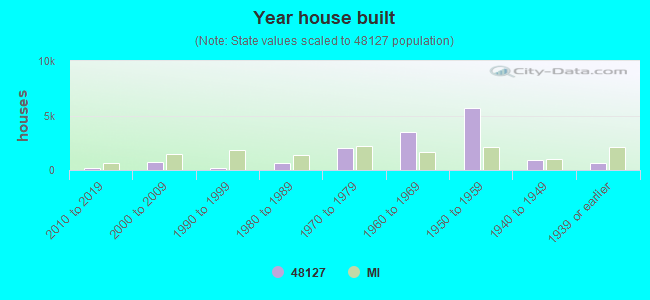

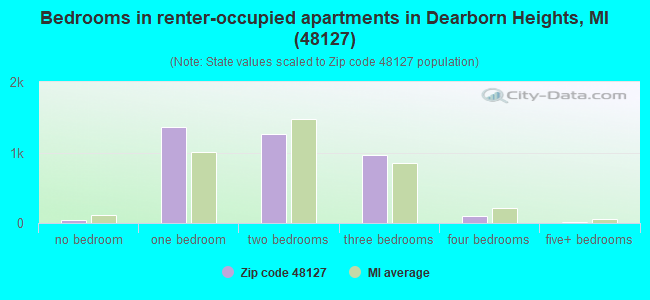
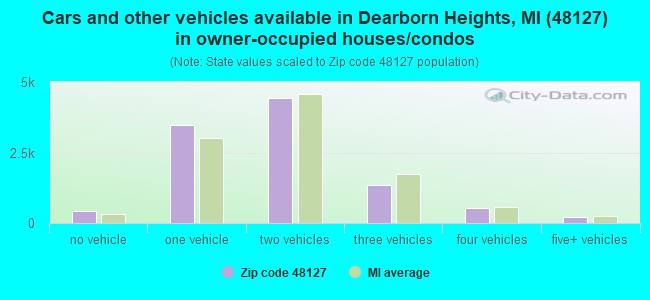
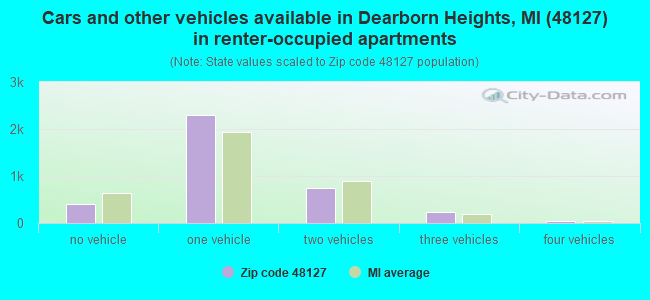


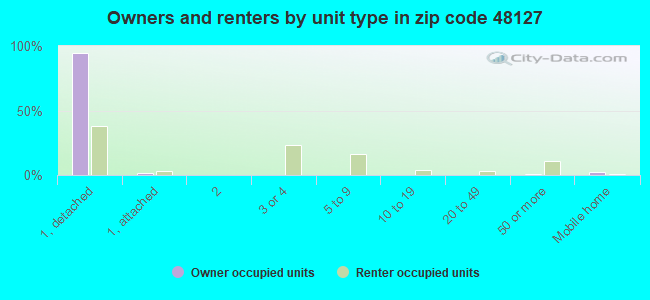
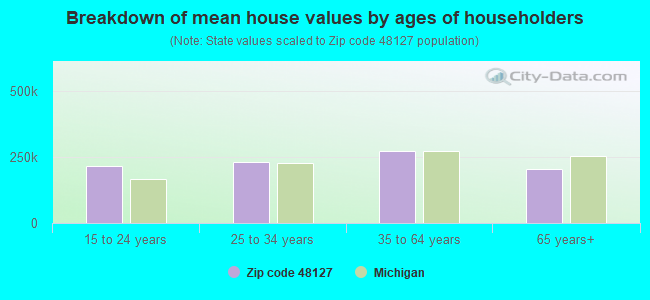


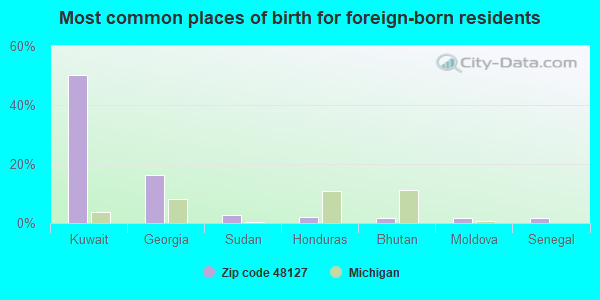
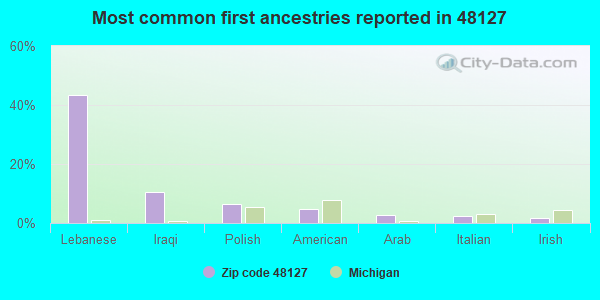
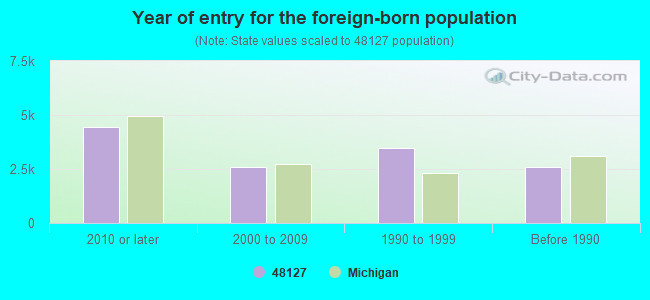
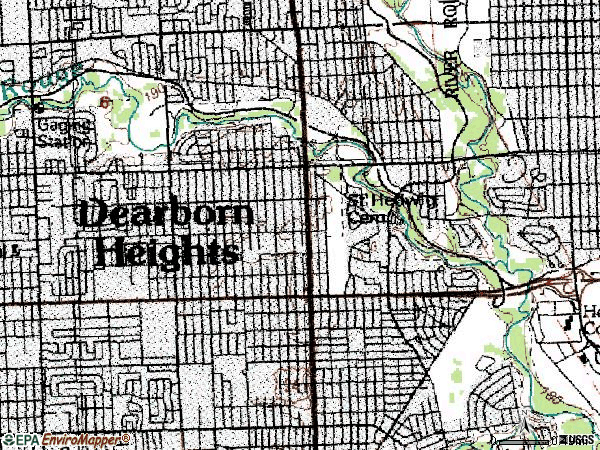

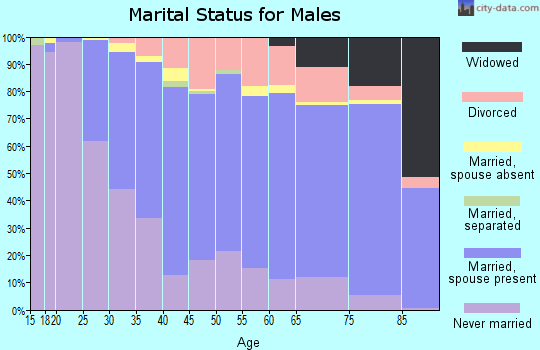
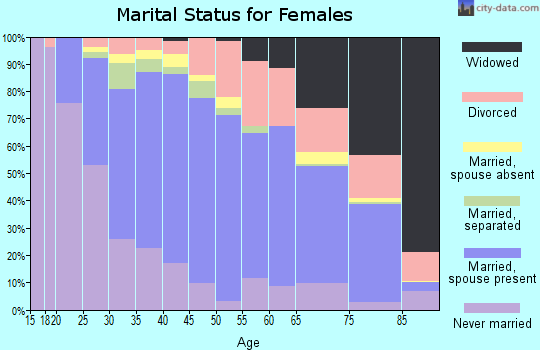
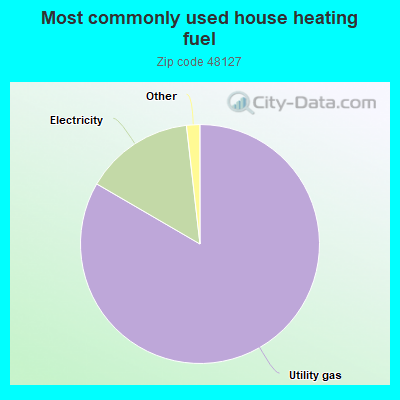
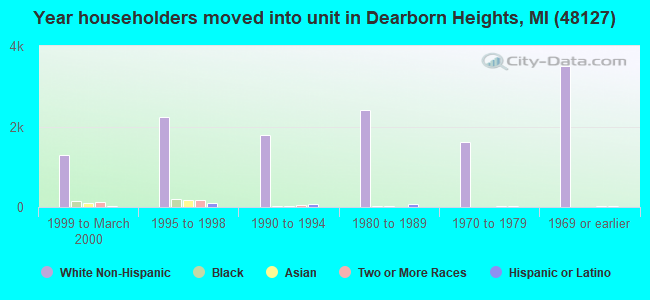
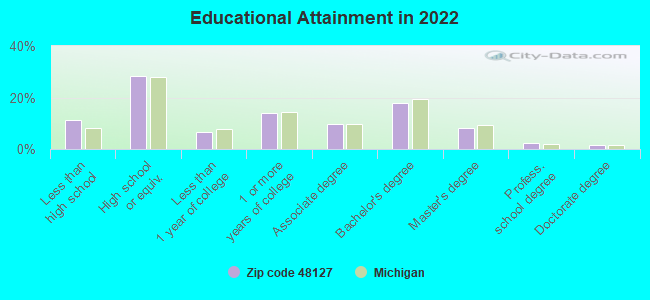
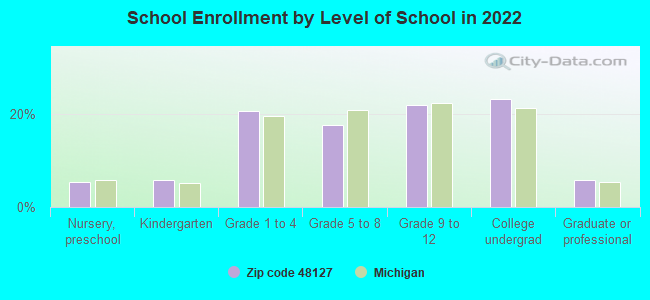
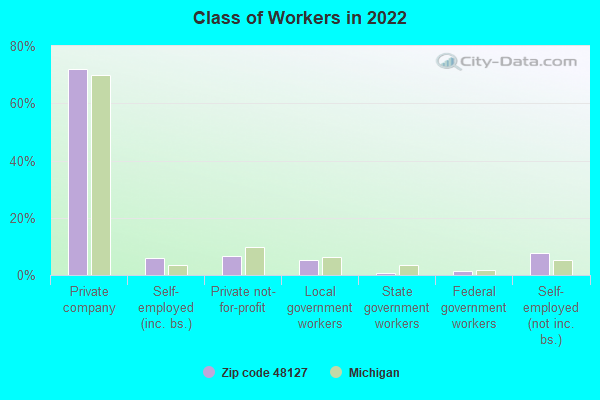
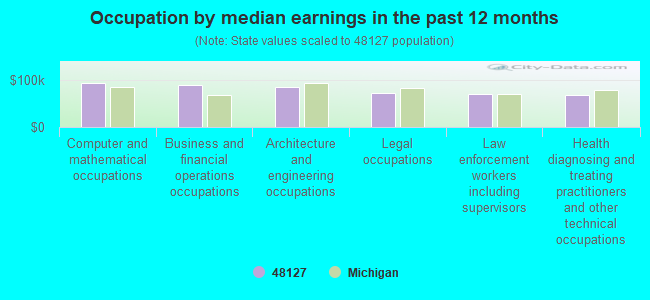
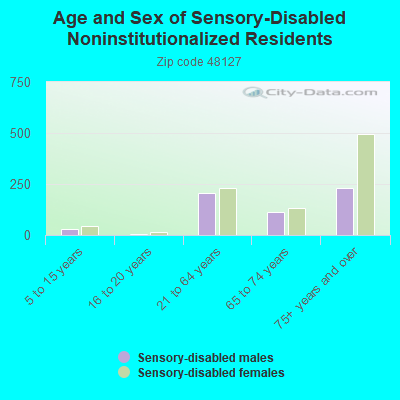
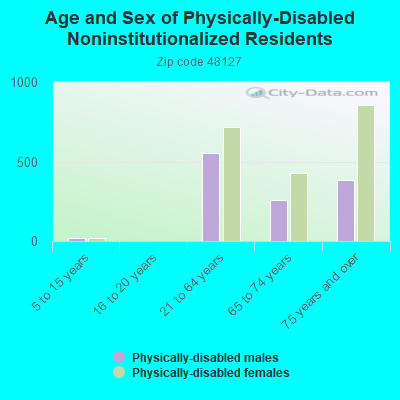
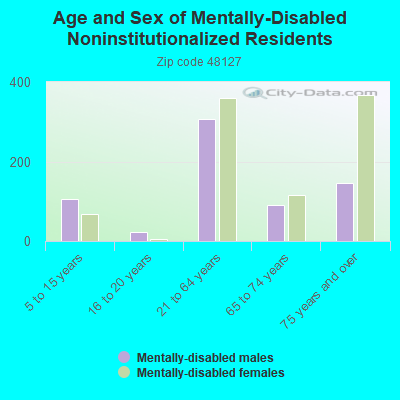
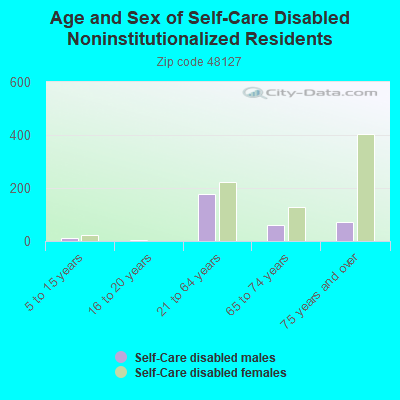
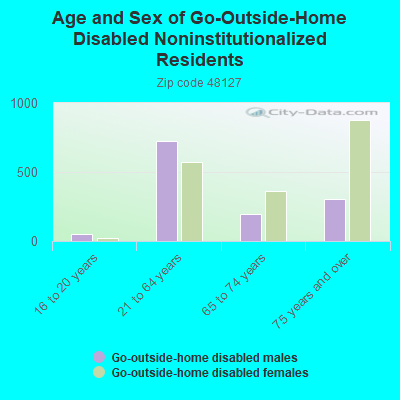
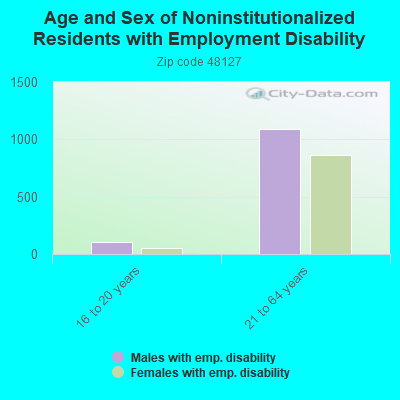
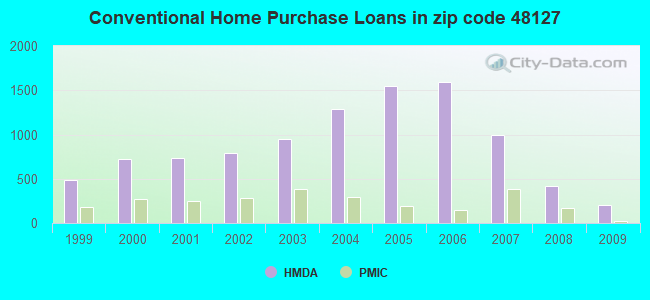
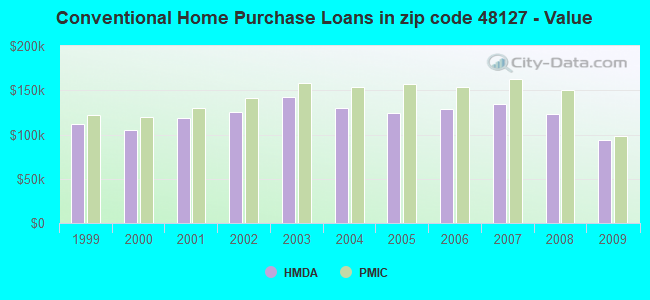
 Based on the data from the years 2002 - 2018 the average number of fires per year is 74. The highest number of reported fire incidents - 98 took place in 2006, and the least - 49 in 2002. The data has a rising trend.
 When looking into fire subcategories, the most incidents belonged to: Structure Fires (50.2%), and Outside Fires (22.6%).