Estimated zip code population in 2022: 33,965
Zip code population in 2010: 31,732
Zip code population in 2000: 33,257
Houses and condos: 14,721
Renter-occupied apartments: 2,723
% of renters here:
19%State:
27%
March 2022 cost of living index in zip code 48124: 95.8
(near average, U.S. average is 100)
Land area: 8.9
sq. mi.
Water area: 0.0
sq. mi.
Population density: 3,836 people per square mile (average).
OSM Map
General Map
Google Map
MSN Map
OSM Map
General Map
Google Map
MSN Map
OSM Map
General Map
Google Map
MSN Map
OSM Map
General Map
Google Map
MSN Map
Please wait while loading the map...
Real estate property taxes paid for housing units in 2022:
This zip code:
2.0% ($3,935)Michigan:
1.2% ($2,746)
Median real estate property taxes paid for housing units with mortgages in 2022: $4,217 (2.0%)
Median real estate property taxes paid for housing units with no mortgage in 2022: $3,590 (1.9%)
Profiles of local businesses
Business Search - 14 Million verified businesses
Males: 16,811 Females: 17,153
For population 25 years and over in 48124:
High school or higher: 95.2%Bachelor's degree or higher: 41.2%Graduate or professional degree: 17.9%Unemployed: 4.1%Mean travel time to work (commute): 21.8 minutes
For population 15 years and over in 48124:
Never married: 33.2%Now married: 49.4%Separated: 0.5%Widowed: 5.2%Divorced: 11.7%
Zip code 48124 compared to state average:
Black race population percentage significantly below state average. Foreign-born population percentage above state average. Length of stay since moving in significantly above state average. House age above state average. 28,516 84.0% White 1,786 5.3% Hispanic or Latino 1,551 4.6% Black 1,537 4.5% Two or more races 432 1.3% Asian 115 0.3% Some other race 24 0.07% American Indian
Data:
Median household income ($)
Median household income (% change since 2000)
Household income diversity
Ratio of average income to average house value (%)
Ratio of average income to average rent
Median household income ($) - White
Median household income ($) - Black or African American
Median household income ($) - Asian
Median household income ($) - Hispanic or Latino
Median household income ($) - American Indian and Alaska Native
Median household income ($) - Multirace
Median household income ($) - Other Race
Median household income for houses/condos with a mortgage ($)
Median household income for apartments without a mortgage ($)
Races - White alone (%)
Races - White alone (% change since 2000)
Races - Black alone (%)
Races - Black alone (% change since 2000)
Races - American Indian alone (%)
Races - American Indian alone (% change since 2000)
Races - Asian alone (%)
Races - Asian alone (% change since 2000)
Races - Hispanic (%)
Races - Hispanic (% change since 2000)
Races - Native Hawaiian and Other Pacific Islander alone (%)
Races - Native Hawaiian and Other Pacific Islander alone (% change since 2000)
Races - Two or more races (%)
Races - Two or more races (% change since 2000)
Races - Other race alone (%)
Races - Other race alone (% change since 2000)
Racial diversity
Unemployment (%)
Unemployment (% change since 2000)
Unemployment (%) - White
Unemployment (%) - Black or African American
Unemployment (%) - Asian
Unemployment (%) - Hispanic or Latino
Unemployment (%) - American Indian and Alaska Native
Unemployment (%) - Multirace
Unemployment (%) - Other Race
Population density (people per square mile)
Population - Males (%)
Population - Females (%)
Population - Males (%) - White
Population - Males (%) - Black or African American
Population - Males (%) - Asian
Population - Males (%) - Hispanic or Latino
Population - Males (%) - American Indian and Alaska Native
Population - Males (%) - Multirace
Population - Males (%) - Other Race
Population - Females (%) - White
Population - Females (%) - Black or African American
Population - Females (%) - Asian
Population - Females (%) - Hispanic or Latino
Population - Females (%) - American Indian and Alaska Native
Population - Females (%) - Multirace
Population - Females (%) - Other Race
Coronavirus confirmed cases (Apr 27, 2024)
Deaths caused by coronavirus (Apr 27, 2024)
Coronavirus confirmed cases (per 100k population) (Apr 27, 2024)
Deaths caused by coronavirus (per 100k population) (Apr 27, 2024)
Daily increase in number of cases (Apr 27, 2024)
Weekly increase in number of cases (Apr 27, 2024)
Cases doubled (in days) (Apr 27, 2024)
Hospitalized patients (Apr 18, 2022)
Negative test results (Apr 18, 2022)
Total test results (Apr 18, 2022)
COVID Vaccine doses distributed (per 100k population) (Sep 19, 2023)
COVID Vaccine doses administered (per 100k population) (Sep 19, 2023)
COVID Vaccine doses distributed (Sep 19, 2023)
COVID Vaccine doses administered (Sep 19, 2023)
Likely homosexual households (%)
Likely homosexual households (% change since 2000)
Likely homosexual households - Lesbian couples (%)
Likely homosexual households - Lesbian couples (% change since 2000)
Likely homosexual households - Gay men (%)
Likely homosexual households - Gay men (% change since 2000)
Cost of living index
Median gross rent ($)
Median contract rent ($)
Median monthly housing costs ($)
Median house or condo value ($)
Median house or condo value ($ change since 2000)
Mean house or condo value by units in structure - 1, detached ($)
Mean house or condo value by units in structure - 1, attached ($)
Mean house or condo value by units in structure - 2 ($)
Mean house or condo value by units in structure by units in structure - 3 or 4 ($)
Mean house or condo value by units in structure - 5 or more ($)
Mean house or condo value by units in structure - Boat, RV, van, etc. ($)
Mean house or condo value by units in structure - Mobile home ($)
Median house or condo value ($) - White
Median house or condo value ($) - Black or African American
Median house or condo value ($) - Asian
Median house or condo value ($) - Hispanic or Latino
Median house or condo value ($) - American Indian and Alaska Native
Median house or condo value ($) - Multirace
Median house or condo value ($) - Other Race
Median resident age
Resident age diversity
Median resident age - Males
Median resident age - Females
Median resident age - White
Median resident age - Black or African American
Median resident age - Asian
Median resident age - Hispanic or Latino
Median resident age - American Indian and Alaska Native
Median resident age - Multirace
Median resident age - Other Race
Median resident age - Males - White
Median resident age - Males - Black or African American
Median resident age - Males - Asian
Median resident age - Males - Hispanic or Latino
Median resident age - Males - American Indian and Alaska Native
Median resident age - Males - Multirace
Median resident age - Males - Other Race
Median resident age - Females - White
Median resident age - Females - Black or African American
Median resident age - Females - Asian
Median resident age - Females - Hispanic or Latino
Median resident age - Females - American Indian and Alaska Native
Median resident age - Females - Multirace
Median resident age - Females - Other Race
Commute - mean travel time to work (minutes)
Travel time to work - Less than 5 minutes (%)
Travel time to work - Less than 5 minutes (% change since 2000)
Travel time to work - 5 to 9 minutes (%)
Travel time to work - 5 to 9 minutes (% change since 2000)
Travel time to work - 10 to 19 minutes (%)
Travel time to work - 10 to 19 minutes (% change since 2000)
Travel time to work - 20 to 29 minutes (%)
Travel time to work - 20 to 29 minutes (% change since 2000)
Travel time to work - 30 to 39 minutes (%)
Travel time to work - 30 to 39 minutes (% change since 2000)
Travel time to work - 40 to 59 minutes (%)
Travel time to work - 40 to 59 minutes (% change since 2000)
Travel time to work - 60 to 89 minutes (%)
Travel time to work - 60 to 89 minutes (% change since 2000)
Travel time to work - 90 or more minutes (%)
Travel time to work - 90 or more minutes (% change since 2000)
Marital status - Never married (%)
Marital status - Now married (%)
Marital status - Separated (%)
Marital status - Widowed (%)
Marital status - Divorced (%)
Median family income ($)
Median family income (% change since 2000)
Median non-family income ($)
Median non-family income (% change since 2000)
Median per capita income ($)
Median per capita income (% change since 2000)
Median family income ($) - White
Median family income ($) - Black or African American
Median family income ($) - Asian
Median family income ($) - Hispanic or Latino
Median family income ($) - American Indian and Alaska Native
Median family income ($) - Multirace
Median family income ($) - Other Race
Median year house/condo built
Median year apartment built
Year house built - Built 2005 or later (%)
Year house built - Built 2000 to 2004 (%)
Year house built - Built 1990 to 1999 (%)
Year house built - Built 1980 to 1989 (%)
Year house built - Built 1970 to 1979 (%)
Year house built - Built 1960 to 1969 (%)
Year house built - Built 1950 to 1959 (%)
Year house built - Built 1940 to 1949 (%)
Year house built - Built 1939 or earlier (%)
Average household size
Household density (households per square mile)
Average household size - White
Average household size - Black or African American
Average household size - Asian
Average household size - Hispanic or Latino
Average household size - American Indian and Alaska Native
Average household size - Multirace
Average household size - Other Race
Occupied housing units (%)
Vacant housing units (%)
Owner occupied housing units (%)
Renter occupied housing units (%)
Vacancy status - For rent (%)
Vacancy status - For sale only (%)
Vacancy status - Rented or sold, not occupied (%)
Vacancy status - For seasonal, recreational, or occasional use (%)
Vacancy status - For migrant workers (%)
Vacancy status - Other vacant (%)
Residents with income below the poverty level (%)
Residents with income below 50% of the poverty level (%)
Children below poverty level (%)
Poor families by family type - Married-couple family (%)
Poor families by family type - Male, no wife present (%)
Poor families by family type - Female, no husband present (%)
Poverty status for native-born residents (%)
Poverty status for foreign-born residents (%)
Poverty among high school graduates not in families (%)
Poverty among people who did not graduate high school not in families (%)
Residents with income below the poverty level (%) - White
Residents with income below the poverty level (%) - Black or African American
Residents with income below the poverty level (%) - Asian
Residents with income below the poverty level (%) - Hispanic or Latino
Residents with income below the poverty level (%) - American Indian and Alaska Native
Residents with income below the poverty level (%) - Multirace
Residents with income below the poverty level (%) - Other Race
Air pollution - Air Quality Index (AQI)
Air pollution - CO
Air pollution - NO2
Air pollution - SO2
Air pollution - Ozone
Air pollution - PM10
Air pollution - PM25
Air pollution - Pb
Crime - Murders per 100,000 population
Crime - Rapes per 100,000 population
Crime - Robberies per 100,000 population
Crime - Assaults per 100,000 population
Crime - Burglaries per 100,000 population
Crime - Thefts per 100,000 population
Crime - Auto thefts per 100,000 population
Crime - Arson per 100,000 population
Crime - City-data.com crime index
Crime - Violent crime index
Crime - Property crime index
Crime - Murders per 100,000 population (5 year average)
Crime - Rapes per 100,000 population (5 year average)
Crime - Robberies per 100,000 population (5 year average)
Crime - Assaults per 100,000 population (5 year average)
Crime - Burglaries per 100,000 population (5 year average)
Crime - Thefts per 100,000 population (5 year average)
Crime - Auto thefts per 100,000 population (5 year average)
Crime - Arson per 100,000 population (5 year average)
Crime - City-data.com crime index (5 year average)
Crime - Violent crime index (5 year average)
Crime - Property crime index (5 year average)
1996 Presidential Elections Results (%) - Democratic Party (Clinton)
1996 Presidential Elections Results (%) - Republican Party (Dole)
1996 Presidential Elections Results (%) - Other
2000 Presidential Elections Results (%) - Democratic Party (Gore)
2000 Presidential Elections Results (%) - Republican Party (Bush)
2000 Presidential Elections Results (%) - Other
2004 Presidential Elections Results (%) - Democratic Party (Kerry)
2004 Presidential Elections Results (%) - Republican Party (Bush)
2004 Presidential Elections Results (%) - Other
2008 Presidential Elections Results (%) - Democratic Party (Obama)
2008 Presidential Elections Results (%) - Republican Party (McCain)
2008 Presidential Elections Results (%) - Other
2012 Presidential Elections Results (%) - Democratic Party (Obama)
2012 Presidential Elections Results (%) - Republican Party (Romney)
2012 Presidential Elections Results (%) - Other
2016 Presidential Elections Results (%) - Democratic Party (Clinton)
2016 Presidential Elections Results (%) - Republican Party (Trump)
2016 Presidential Elections Results (%) - Other
2020 Presidential Elections Results (%) - Democratic Party (Biden)
2020 Presidential Elections Results (%) - Republican Party (Trump)
2020 Presidential Elections Results (%) - Other
Ancestries Reported - Arab (%)
Ancestries Reported - Czech (%)
Ancestries Reported - Danish (%)
Ancestries Reported - Dutch (%)
Ancestries Reported - English (%)
Ancestries Reported - French (%)
Ancestries Reported - French Canadian (%)
Ancestries Reported - German (%)
Ancestries Reported - Greek (%)
Ancestries Reported - Hungarian (%)
Ancestries Reported - Irish (%)
Ancestries Reported - Italian (%)
Ancestries Reported - Lithuanian (%)
Ancestries Reported - Norwegian (%)
Ancestries Reported - Polish (%)
Ancestries Reported - Portuguese (%)
Ancestries Reported - Russian (%)
Ancestries Reported - Scotch-Irish (%)
Ancestries Reported - Scottish (%)
Ancestries Reported - Slovak (%)
Ancestries Reported - Subsaharan African (%)
Ancestries Reported - Swedish (%)
Ancestries Reported - Swiss (%)
Ancestries Reported - Ukrainian (%)
Ancestries Reported - United States (%)
Ancestries Reported - Welsh (%)
Ancestries Reported - West Indian (%)
Ancestries Reported - Other (%)
Educational Attainment - No schooling completed (%)
Educational Attainment - Less than high school (%)
Educational Attainment - High school or equivalent (%)
Educational Attainment - Less than 1 year of college (%)
Educational Attainment - 1 or more years of college (%)
Educational Attainment - Associate degree (%)
Educational Attainment - Bachelor's degree (%)
Educational Attainment - Master's degree (%)
Educational Attainment - Professional school degree (%)
Educational Attainment - Doctorate degree (%)
School Enrollment - Nursery, preschool (%)
School Enrollment - Kindergarten (%)
School Enrollment - Grade 1 to 4 (%)
School Enrollment - Grade 5 to 8 (%)
School Enrollment - Grade 9 to 12 (%)
School Enrollment - College undergrad (%)
School Enrollment - Graduate or professional (%)
School Enrollment - Not enrolled in school (%)
School enrollment - Public schools (%)
School enrollment - Private schools (%)
School enrollment - Not enrolled (%)
Median number of rooms in houses and condos
Median number of rooms in apartments
Housing units lacking complete plumbing facilities (%)
Housing units lacking complete kitchen facilities (%)
Density of houses
Urban houses (%)
Rural houses (%)
Households with people 60 years and over (%)
Households with people 65 years and over (%)
Households with people 75 years and over (%)
Households with one or more nonrelatives (%)
Households with no nonrelatives (%)
Population in households (%)
Family households (%)
Nonfamily households (%)
Population in families (%)
Family households with own children (%)
Median number of bedrooms in owner occupied houses
Mean number of bedrooms in owner occupied houses
Median number of bedrooms in renter occupied houses
Mean number of bedrooms in renter occupied houses
Median number of vehichles in owner occupied houses
Mean number of vehichles in owner occupied houses
Median number of vehichles in renter occupied houses
Mean number of vehichles in renter occupied houses
Mortgage status - with mortgage (%)
Mortgage status - with second mortgage (%)
Mortgage status - with home equity loan (%)
Mortgage status - with both second mortgage and home equity loan (%)
Mortgage status - without a mortgage (%)
Average family size
Average family size - White
Average family size - Black or African American
Average family size - Asian
Average family size - Hispanic or Latino
Average family size - American Indian and Alaska Native
Average family size - Multirace
Average family size - Other Race
Geographical mobility - Same house 1 year ago (%)
Geographical mobility - Moved within same county (%)
Geographical mobility - Moved from different county within same state (%)
Geographical mobility - Moved from different state (%)
Geographical mobility - Moved from abroad (%)
Place of birth - Born in state of residence (%)
Place of birth - Born in other state (%)
Place of birth - Native, outside of US (%)
Place of birth - Foreign born (%)
Housing units in structures - 1, detached (%)
Housing units in structures - 1, attached (%)
Housing units in structures - 2 (%)
Housing units in structures - 3 or 4 (%)
Housing units in structures - 5 to 9 (%)
Housing units in structures - 10 to 19 (%)
Housing units in structures - 20 to 49 (%)
Housing units in structures - 50 or more (%)
Housing units in structures - Mobile home (%)
Housing units in structures - Boat, RV, van, etc. (%)
House/condo owner moved in on average (years ago)
Renter moved in on average (years ago)
Year householder moved into unit - Moved in 1999 to March 2000 (%)
Year householder moved into unit - Moved in 1995 to 1998 (%)
Year householder moved into unit - Moved in 1990 to 1994 (%)
Year householder moved into unit - Moved in 1980 to 1989 (%)
Year householder moved into unit - Moved in 1970 to 1979 (%)
Year householder moved into unit - Moved in 1969 or earlier (%)
Means of transportation to work - Drove car alone (%)
Means of transportation to work - Carpooled (%)
Means of transportation to work - Public transportation (%)
Means of transportation to work - Bus or trolley bus (%)
Means of transportation to work - Streetcar or trolley car (%)
Means of transportation to work - Subway or elevated (%)
Means of transportation to work - Railroad (%)
Means of transportation to work - Ferryboat (%)
Means of transportation to work - Taxicab (%)
Means of transportation to work - Motorcycle (%)
Means of transportation to work - Bicycle (%)
Means of transportation to work - Walked (%)
Means of transportation to work - Other means (%)
Working at home (%)
Industry diversity
Most Common Industries - Agriculture, forestry, fishing and hunting, and mining (%)
Most Common Industries - Agriculture, forestry, fishing and hunting (%)
Most Common Industries - Mining, quarrying, and oil and gas extraction (%)
Most Common Industries - Construction (%)
Most Common Industries - Manufacturing (%)
Most Common Industries - Wholesale trade (%)
Most Common Industries - Retail trade (%)
Most Common Industries - Transportation and warehousing, and utilities (%)
Most Common Industries - Transportation and warehousing (%)
Most Common Industries - Utilities (%)
Most Common Industries - Information (%)
Most Common Industries - Finance and insurance, and real estate and rental and leasing (%)
Most Common Industries - Finance and insurance (%)
Most Common Industries - Real estate and rental and leasing (%)
Most Common Industries - Professional, scientific, and management, and administrative and waste management services (%)
Most Common Industries - Professional, scientific, and technical services (%)
Most Common Industries - Management of companies and enterprises (%)
Most Common Industries - Administrative and support and waste management services (%)
Most Common Industries - Educational services, and health care and social assistance (%)
Most Common Industries - Educational services (%)
Most Common Industries - Health care and social assistance (%)
Most Common Industries - Arts, entertainment, and recreation, and accommodation and food services (%)
Most Common Industries - Arts, entertainment, and recreation (%)
Most Common Industries - Accommodation and food services (%)
Most Common Industries - Other services, except public administration (%)
Most Common Industries - Public administration (%)
Occupation diversity
Most Common Occupations - Management, business, science, and arts occupations (%)
Most Common Occupations - Management, business, and financial occupations (%)
Most Common Occupations - Management occupations (%)
Most Common Occupations - Business and financial operations occupations (%)
Most Common Occupations - Computer, engineering, and science occupations (%)
Most Common Occupations - Computer and mathematical occupations (%)
Most Common Occupations - Architecture and engineering occupations (%)
Most Common Occupations - Life, physical, and social science occupations (%)
Most Common Occupations - Education, legal, community service, arts, and media occupations (%)
Most Common Occupations - Community and social service occupations (%)
Most Common Occupations - Legal occupations (%)
Most Common Occupations - Education, training, and library occupations (%)
Most Common Occupations - Arts, design, entertainment, sports, and media occupations (%)
Most Common Occupations - Healthcare practitioners and technical occupations (%)
Most Common Occupations - Health diagnosing and treating practitioners and other technical occupations (%)
Most Common Occupations - Health technologists and technicians (%)
Most Common Occupations - Service occupations (%)
Most Common Occupations - Healthcare support occupations (%)
Most Common Occupations - Protective service occupations (%)
Most Common Occupations - Fire fighting and prevention, and other protective service workers including supervisors (%)
Most Common Occupations - Law enforcement workers including supervisors (%)
Most Common Occupations - Food preparation and serving related occupations (%)
Most Common Occupations - Building and grounds cleaning and maintenance occupations (%)
Most Common Occupations - Personal care and service occupations (%)
Most Common Occupations - Sales and office occupations (%)
Most Common Occupations - Sales and related occupations (%)
Most Common Occupations - Office and administrative support occupations (%)
Most Common Occupations - Natural resources, construction, and maintenance occupations (%)
Most Common Occupations - Farming, fishing, and forestry occupations (%)
Most Common Occupations - Construction and extraction occupations (%)
Most Common Occupations - Installation, maintenance, and repair occupations (%)
Most Common Occupations - Production, transportation, and material moving occupations (%)
Most Common Occupations - Production occupations (%)
Most Common Occupations - Transportation occupations (%)
Most Common Occupations - Material moving occupations (%)
People in Group quarters - Institutionalized population (%)
People in Group quarters - Correctional institutions (%)
People in Group quarters - Federal prisons and detention centers (%)
People in Group quarters - Halfway houses (%)
People in Group quarters - Local jails and other confinement facilities (including police lockups) (%)
People in Group quarters - Military disciplinary barracks (%)
People in Group quarters - State prisons (%)
People in Group quarters - Other types of correctional institutions (%)
People in Group quarters - Nursing homes (%)
People in Group quarters - Hospitals/wards, hospices, and schools for the handicapped (%)
People in Group quarters - Hospitals/wards and hospices for chronically ill (%)
People in Group quarters - Hospices or homes for chronically ill (%)
People in Group quarters - Military hospitals or wards for chronically ill (%)
People in Group quarters - Other hospitals or wards for chronically ill (%)
People in Group quarters - Hospitals or wards for drug/alcohol abuse (%)
People in Group quarters - Mental (Psychiatric) hospitals or wards (%)
People in Group quarters - Schools, hospitals, or wards for the mentally retarded (%)
People in Group quarters - Schools, hospitals, or wards for the physically handicapped (%)
People in Group quarters - Institutions for the deaf (%)
People in Group quarters - Institutions for the blind (%)
People in Group quarters - Orthopedic wards and institutions for the physically handicapped (%)
People in Group quarters - Wards in general hospitals for patients who have no usual home elsewhere (%)
People in Group quarters - Wards in military hospitals for patients who have no usual home elsewhere (%)
People in Group quarters - Juvenile institutions (%)
People in Group quarters - Long-term care (%)
People in Group quarters - Homes for abused, dependent, and neglected children (%)
People in Group quarters - Residential treatment centers for emotionally disturbed children (%)
People in Group quarters - Training schools for juvenile delinquents (%)
People in Group quarters - Short-term care, detention or diagnostic centers for delinquent children (%)
People in Group quarters - Type of juvenile institution unknown (%)
People in Group quarters - Noninstitutionalized population (%)
People in Group quarters - College dormitories (includes college quarters off campus) (%)
People in Group quarters - Military quarters (%)
People in Group quarters - On base (%)
People in Group quarters - Barracks, unaccompanied personnel housing (UPH), (Enlisted/Officer), ;and similar group living quarters for military personnel (%)
People in Group quarters - Transient quarters for temporary residents (%)
People in Group quarters - Military ships (%)
People in Group quarters - Group homes (%)
People in Group quarters - Homes or halfway houses for drug/alcohol abuse (%)
People in Group quarters - Homes for the mentally ill (%)
People in Group quarters - Homes for the mentally retarded (%)
People in Group quarters - Homes for the physically handicapped (%)
People in Group quarters - Other group homes (%)
People in Group quarters - Religious group quarters (%)
People in Group quarters - Dormitories (%)
People in Group quarters - Agriculture workers' dormitories on farms (%)
People in Group quarters - Job Corps and vocational training facilities (%)
People in Group quarters - Other workers' dormitories (%)
People in Group quarters - Crews of maritime vessels (%)
People in Group quarters - Other nonhousehold living situations (%)
People in Group quarters - Other noninstitutional group quarters (%)
Residents speaking English at home (%)
Residents speaking English at home - Born in the United States (%)
Residents speaking English at home - Native, born elsewhere (%)
Residents speaking English at home - Foreign born (%)
Residents speaking Spanish at home (%)
Residents speaking Spanish at home - Born in the United States (%)
Residents speaking Spanish at home - Native, born elsewhere (%)
Residents speaking Spanish at home - Foreign born (%)
Residents speaking other language at home (%)
Residents speaking other language at home - Born in the United States (%)
Residents speaking other language at home - Native, born elsewhere (%)
Residents speaking other language at home - Foreign born (%)
Class of Workers - Employee of private company (%)
Class of Workers - Self-employed in own incorporated business (%)
Class of Workers - Private not-for-profit wage and salary workers (%)
Class of Workers - Local government workers (%)
Class of Workers - State government workers (%)
Class of Workers - Federal government workers (%)
Class of Workers - Self-employed workers in own not incorporated business and Unpaid family workers (%)
House heating fuel used in houses and condos - Utility gas (%)
House heating fuel used in houses and condos - Bottled, tank, or LP gas (%)
House heating fuel used in houses and condos - Electricity (%)
House heating fuel used in houses and condos - Fuel oil, kerosene, etc. (%)
House heating fuel used in houses and condos - Coal or coke (%)
House heating fuel used in houses and condos - Wood (%)
House heating fuel used in houses and condos - Solar energy (%)
House heating fuel used in houses and condos - Other fuel (%)
House heating fuel used in houses and condos - No fuel used (%)
House heating fuel used in apartments - Utility gas (%)
House heating fuel used in apartments - Bottled, tank, or LP gas (%)
House heating fuel used in apartments - Electricity (%)
House heating fuel used in apartments - Fuel oil, kerosene, etc. (%)
House heating fuel used in apartments - Coal or coke (%)
House heating fuel used in apartments - Wood (%)
House heating fuel used in apartments - Solar energy (%)
House heating fuel used in apartments - Other fuel (%)
House heating fuel used in apartments - No fuel used (%)
Armed forces status - In Armed Forces (%)
Armed forces status - Civilian (%)
Armed forces status - Civilian - Veteran (%)
Armed forces status - Civilian - Nonveteran (%)
Fatal accidents locations in years 2005-2021
Fatal accidents locations in 2005
Fatal accidents locations in 2006
Fatal accidents locations in 2007
Fatal accidents locations in 2008
Fatal accidents locations in 2009
Fatal accidents locations in 2010
Fatal accidents locations in 2011
Fatal accidents locations in 2012
Fatal accidents locations in 2013
Fatal accidents locations in 2014
Fatal accidents locations in 2015
Fatal accidents locations in 2016
Fatal accidents locations in 2017
Fatal accidents locations in 2018
Fatal accidents locations in 2019
Fatal accidents locations in 2020
Fatal accidents locations in 2021
Alcohol use - People drinking some alcohol every month (%)
Alcohol use - People not drinking at all (%)
Alcohol use - Average days/month drinking alcohol
Alcohol use - Average drinks/week
Alcohol use - Average days/year people drink much
Audiometry - Average condition of hearing (%)
Audiometry - People that can hear a whisper from across a quiet room (%)
Audiometry - People that can hear normal voice from across a quiet room (%)
Audiometry - Ears ringing, roaring, buzzing (%)
Audiometry - Had a job exposure to loud noise (%)
Audiometry - Had off-work exposure to loud noise (%)
Blood Pressure & Cholesterol - Has high blood pressure (%)
Blood Pressure & Cholesterol - Checking blood pressure at home (%)
Blood Pressure & Cholesterol - Frequently checking blood cholesterol (%)
Blood Pressure & Cholesterol - Has high cholesterol level (%)
Consumer Behavior - Money monthly spent on food at supermarket/grocery store
Consumer Behavior - Money monthly spent on food at other stores
Consumer Behavior - Money monthly spent on eating out
Consumer Behavior - Money monthly spent on carryout/delivered foods
Consumer Behavior - Income spent on food at supermarket/grocery store (%)
Consumer Behavior - Income spent on food at other stores (%)
Consumer Behavior - Income spent on eating out (%)
Consumer Behavior - Income spent on carryout/delivered foods (%)
Current Health Status - General health condition (%)
Current Health Status - Blood donors (%)
Current Health Status - Has blood ever tested for HIV virus (%)
Current Health Status - Left-handed people (%)
Dermatology - People using sunscreen (%)
Diabetes - Diabetics (%)
Diabetes - Had a blood test for high blood sugar (%)
Diabetes - People taking insulin (%)
Diet Behavior & Nutrition - Diet health (%)
Diet Behavior & Nutrition - Milk product consumption (# of products/month)
Diet Behavior & Nutrition - Meals not home prepared (#/week)
Diet Behavior & Nutrition - Meals from fast food or pizza place (#/week)
Diet Behavior & Nutrition - Ready-to-eat foods (#/month)
Diet Behavior & Nutrition - Frozen meals/pizza (#/month)
Drug Use - People that ever used marijuana or hashish (%)
Drug Use - Ever used hard drugs (%)
Drug Use - Ever used any form of cocaine (%)
Drug Use - Ever used heroin (%)
Drug Use - Ever used methamphetamine (%)
Health Insurance - People covered by health insurance (%)
Kidney Conditions-Urology - Avg. # of times urinating at night
Medical Conditions - People with asthma (%)
Medical Conditions - People with anemia (%)
Medical Conditions - People with psoriasis (%)
Medical Conditions - People with overweight (%)
Medical Conditions - Elderly people having difficulties in thinking or remembering (%)
Medical Conditions - People who ever received blood transfusion (%)
Medical Conditions - People having trouble seeing even with glass/contacts (%)
Medical Conditions - People with arthritis (%)
Medical Conditions - People with gout (%)
Medical Conditions - People with congestive heart failure (%)
Medical Conditions - People with coronary heart disease (%)
Medical Conditions - People with angina pectoris (%)
Medical Conditions - People who ever had heart attack (%)
Medical Conditions - People who ever had stroke (%)
Medical Conditions - People with emphysema (%)
Medical Conditions - People with thyroid problem (%)
Medical Conditions - People with chronic bronchitis (%)
Medical Conditions - People with any liver condition (%)
Medical Conditions - People who ever had cancer or malignancy (%)
Mental Health - People who have little interest in doing things (%)
Mental Health - People feeling down, depressed, or hopeless (%)
Mental Health - People who have trouble sleeping or sleeping too much (%)
Mental Health - People feeling tired or having little energy (%)
Mental Health - People with poor appetite or overeating (%)
Mental Health - People feeling bad about themself (%)
Mental Health - People who have trouble concentrating on things (%)
Mental Health - People moving or speaking slowly or too fast (%)
Mental Health - People having thoughts they would be better off dead (%)
Oral Health - Average years since last visit a dentist
Oral Health - People embarrassed because of mouth (%)
Oral Health - People with gum disease (%)
Oral Health - General health of teeth and gums (%)
Oral Health - Average days a week using dental floss/device
Oral Health - Average days a week using mouthwash for dental problem
Oral Health - Average number of teeth
Pesticide Use - Households using pesticides to control insects (%)
Pesticide Use - Households using pesticides to kill weeds (%)
Physical Activity - People doing vigorous-intensity work activities (%)
Physical Activity - People doing moderate-intensity work activities (%)
Physical Activity - People walking or bicycling (%)
Physical Activity - People doing vigorous-intensity recreational activities (%)
Physical Activity - People doing moderate-intensity recreational activities (%)
Physical Activity - Average hours a day doing sedentary activities
Physical Activity - Average hours a day watching TV or videos
Physical Activity - Average hours a day using computer
Physical Functioning - People having limitations keeping them from working (%)
Physical Functioning - People limited in amount of work they can do (%)
Physical Functioning - People that need special equipment to walk (%)
Physical Functioning - People experiencing confusion/memory problems (%)
Physical Functioning - People requiring special healthcare equipment (%)
Prescription Medications - Average number of prescription medicines taking
Preventive Aspirin Use - Adults 40+ taking low-dose aspirin (%)
Reproductive Health - Vaginal deliveries (%)
Reproductive Health - Cesarean deliveries (%)
Reproductive Health - Deliveries resulted in a live birth (%)
Reproductive Health - Pregnancies resulted in a delivery (%)
Reproductive Health - Women breastfeeding newborns (%)
Reproductive Health - Women that had a hysterectomy (%)
Reproductive Health - Women that had both ovaries removed (%)
Reproductive Health - Women that have ever taken birth control pills (%)
Reproductive Health - Women taking birth control pills (%)
Reproductive Health - Women that have ever used Depo-Provera or injectables (%)
Reproductive Health - Women that have ever used female hormones (%)
Sexual Behavior - People 18+ that ever had sex (vaginal, anal, or oral) (%)
Sexual Behavior - Males 18+ that ever had vaginal sex with a woman (%)
Sexual Behavior - Males 18+ that ever performed oral sex on a woman (%)
Sexual Behavior - Males 18+ that ever had anal sex with a woman (%)
Sexual Behavior - Males 18+ that ever had any sex with a man (%)
Sexual Behavior - Females 18+ that ever had vaginal sex with a man (%)
Sexual Behavior - Females 18+ that ever performed oral sex on a man (%)
Sexual Behavior - Females 18+ that ever had anal sex with a man (%)
Sexual Behavior - Females 18+ that ever had any kind of sex with a woman (%)
Sexual Behavior - Average age people first had sex
Sexual Behavior - Average number of female sex partners in lifetime (males 18+)
Sexual Behavior - Average number of female vaginal sex partners in lifetime (males 18+)
Sexual Behavior - Average age people first performed oral sex on a woman (18+)
Sexual Behavior - Average number of woman performed oral sex on in lifetime (18+)
Sexual Behavior - Average number of male sex partners in lifetime (males 18+)
Sexual Behavior - Average number of male anal sex partners in lifetime (males 18+)
Sexual Behavior - Average age people first performed oral sex on a man (18+)
Sexual Behavior - Average number of male oral sex partners in lifetime (18+)
Sexual Behavior - People using protection when performing oral sex (%)
Sexual Behavior - Average number of times people have vaginal or anal sex a year
Sexual Behavior - People having sex without condom (%)
Sexual Behavior - Average number of male sex partners in lifetime (females 18+)
Sexual Behavior - Average number of male vaginal sex partners in lifetime (females 18+)
Sexual Behavior - Average number of female sex partners in lifetime (females 18+)
Sexual Behavior - Circumcised males 18+ (%)
Sleep Disorders - Average hours sleeping at night
Sleep Disorders - People that has trouble sleeping (%)
Smoking-Cigarette Use - People smoking cigarettes (%)
Taste & Smell - People 40+ having problems with smell (%)
Taste & Smell - People 40+ having problems with taste (%)
Taste & Smell - People 40+ that ever had wisdom teeth removed (%)
Taste & Smell - People 40+ that ever had tonsils teeth removed (%)
Taste & Smell - People 40+ that ever had a loss of consciousness because of a head injury (%)
Taste & Smell - People 40+ that ever had a broken nose or other serious injury to face or skull (%)
Taste & Smell - People 40+ that ever had two or more sinus infections (%)
Weight - Average height (inches)
Weight - Average weight (pounds)
Weight - Average BMI
Weight - People that are obese (%)
Weight - People that ever were obese (%)
Weight - People trying to lose weight (%)
100%
urban population.
Estimated median house/condo value in 2022: $196,057
48124:
$196,057Michigan:
$224,400
According to our research of Michigan and other state lists, there were 24 registered sex offenders living in 48124 zip code as of April 27, 2024 . The ratio of all residents to sex offenders in zip code 48124 is 1,250 to 1.The ratio of registered sex offenders to all residents in this zip code is much lower than the state average.
Median resident age: This zip code:
39.7 yearsMichigan median age:
40.3 years
Average household size: This zip code:
2.4 peopleMichigan:
2.4 people
Averages for the 2020 tax year for zip code 48124, filed in 2021:
Average Adjusted Gross Income (AGI) in 2020: $70,122 (Individual Income Tax Returns) Here:
$70,122State:
$68,945
Salary/wage: $59,921 (reported on 75.6% of returns )Here:
$59,921State:
$57,142
(% of AGI for various income ranges: 875.3% for AGIs below $25k , 3184.5% for AGIs $25k-50k , 6193.0% for AGIs $50k-75k , 9193.1% for AGIs $75k-100k , 17306.0% for AGIs $100k-200k , 71726.8% for AGIs over 200k ) Taxable interest for individuals: $1,683 (reported on 37.2% of returns )This zip code:
$1,683Michigan:
$1,630
(% of AGI for various income ranges: 20.2% for AGIs below $25k , 32.1% for AGIs $25k-50k , 58.0% for AGIs $50k-75k , 93.7% for AGIs $75k-100k , 158.2% for AGIs $100k-200k , 2051.8% for AGIs over 200k ) Ordinary dividends: $6,457 (reported on 22.2% of returns )(% of AGI for various income ranges: 30.5% for AGIs below $25k , 38.2% for AGIs $25k-50k , 101.8% for AGIs $50k-75k , 145.9% for AGIs $75k-100k , 342.1% for AGIs $100k-200k , 6294.1% for AGIs over 200k ) Net capital gain/loss in AGI: +$14,078 (reported on 21.2% of returns )Here:
+$14,078State:
+$20,064
(% of AGI for various income ranges: 9.0% for AGIs below $25k , 28.9% for AGIs $25k-50k , 76.6% for AGIs $50k-75k , 174.1% for AGIs $75k-100k , 566.1% for AGIs $100k-200k , 17780.9% for AGIs over 200k ) Profit/loss from business: +$8,996 (reported on 16.0% of returns )Here:
+$8,996State:
+$11,172
(% of AGI for various income ranges: 104.2% for AGIs below $25k , 120.7% for AGIs $25k-50k , 125.9% for AGIs $50k-75k , 184.7% for AGIs $75k-100k , 350.2% for AGIs $100k-200k , 3384.1% for AGIs over 200k ) Taxable individual retirement arrangement distribution: $19,625 (reported on 9.5% of returns )48124:
$19,625Michigan:
$19,803
(% of AGI for various income ranges: 58.0% for AGIs below $25k , 102.3% for AGIs $25k-50k , 211.6% for AGIs $50k-75k , 335.8% for AGIs $75k-100k , 689.8% for AGIs $100k-200k , 3814.1% for AGIs over 200k ) Self-employed (Keogh) retirement plans: $21,640 (reported on 0.3% of returns )48124:
$21,640Michigan:
$25,132
(% of AGI for various income ranges: 26.8% for AGIs $75k-100k , 329.5% for AGIs over 200k ) Total itemized deductions: $29,349 (reported on 7.4% of returns )Here:
$29,349State:
$34,117
(% of AGI for various income ranges: 39.4% for AGIs below $25k , 102.7% for AGIs $25k-50k , 233.9% for AGIs $50k-75k , 456.8% for AGIs $75k-100k , 701.4% for AGIs $100k-200k , 5561.4% for AGIs over 200k ) Charity contributions: $9,413 (reported on 6.2% of returns )(% of AGI for various income ranges: 2.9% for AGIs below $25k , 15.9% for AGIs $25k-50k , 32.2% for AGIs $50k-75k , 91.8% for AGIs $75k-100k , 199.3% for AGIs $100k-200k , 2144.5% for AGIs over 200k ) Taxes paid: $8,244 (reported on 7.3% of returns )(% of AGI for various income ranges: 8.5% for AGIs below $25k , 27.5% for AGIs $25k-50k , 69.6% for AGIs $50k-75k , 161.7% for AGIs $75k-100k , 235.2% for AGIs $100k-200k , 1074.5% for AGIs over 200k ) Earned income credit: $2,299 (reported on 12.0% of returns )(% of AGI for various income ranges: 75.4% for AGIs below $25k , 66.0% for AGIs $25k-50k , 1.6% for AGIs $50k-75k ) Percentage of individuals using paid preparers for their 2020 taxes: 93.3%(% for various income ranges: 92.9% for AGIs below $25k , 93.3% for AGIs $25k-50k , 93.7% for AGIs $50k-75k , 93.3% for AGIs $75k-100k , 93.5% for AGIs $100k-200k , 94.5% for AGIs over 200k )
Averages for the 2012 tax year for zip code 48124, filed in 2013:
Average Adjusted Gross Income (AGI) in 2012: $59,940 (Individual Income Tax Returns) Here:
$59,940State:
$55,609
Salary/wage: $53,647 (reported on 78.6% of returns )Here:
$53,647State:
$46,782
(% of AGI for various income ranges: 64.4% for AGIs below $25k , 70.7% for AGIs $25k-50k , 73.3% for AGIs $50k-75k , 75.7% for AGIs $75k-100k , 77.0% for AGIs $100k-200k , 55.8% for AGIs over 200k ) Taxable interest for individuals: $1,354 (reported on 46.2% of returns )This zip code:
$1,354Michigan:
$1,491
(% of AGI for various income ranges: 1.8% for AGIs below $25k , 1.0% for AGIs $25k-50k , 0.9% for AGIs $50k-75k , 0.9% for AGIs $75k-100k , 0.8% for AGIs $100k-200k , 1.5% for AGIs over 200k ) Ordinary dividends: $4,255 (reported on 26.4% of returns )(% of AGI for various income ranges: 2.5% for AGIs below $25k , 1.6% for AGIs $25k-50k , 1.6% for AGIs $50k-75k , 1.3% for AGIs $75k-100k , 1.5% for AGIs $100k-200k , 3.2% for AGIs over 200k ) Net capital gain/loss in AGI: +$3,818 (reported on 19.5% of returns )Here:
+$3,818State:
+$9,326
(% of AGI for various income ranges: 0.4% for AGIs $50k-75k , 0.1% for AGIs $75k-100k , 0.9% for AGIs $100k-200k , 4.9% for AGIs over 200k ) Profit/loss from business: +$12,247 (reported on 12.4% of returns )Here:
+$12,247State:
+$11,523
(% of AGI for various income ranges: 7.9% for AGIs below $25k , 2.6% for AGIs $25k-50k , 1.4% for AGIs $50k-75k , 1.9% for AGIs $75k-100k , 1.7% for AGIs $100k-200k , 3.3% for AGIs over 200k ) Taxable individual retirement arrangement distribution: $15,113 (reported on 12.6% of returns )48124:
$15,113Michigan:
$15,298
(% of AGI for various income ranges: 3.8% for AGIs below $25k , 2.5% for AGIs $25k-50k , 2.9% for AGIs $50k-75k , 3.1% for AGIs $75k-100k , 3.6% for AGIs $100k-200k , 3.0% for AGIs over 200k ) Self-employment retirement plans: $25,533 (reported on 0.4% of returns )48124:
$25,533Michigan:
$20,834
Total itemized deductions: $19,705 (19% of AGI, reported on 38.0% of returns )Here:
$19,705State:
$21,628
Here:
18.8% of AGIState:
18.4% of AGI
(% of AGI for various income ranges: 11.5% for AGIs below $25k , 10.7% for AGIs $25k-50k , 12.5% for AGIs $50k-75k , 13.2% for AGIs $75k-100k , 13.9% for AGIs $100k-200k , 11.5% for AGIs over 200k ) Charity contributions: $3,274 (reported on 33.3% of returns )(% of AGI for various income ranges: 1.0% for AGIs below $25k , 1.2% for AGIs $25k-50k , 1.6% for AGIs $50k-75k , 1.9% for AGIs $75k-100k , 2.1% for AGIs $100k-200k , 2.3% for AGIs over 200k ) Taxes paid: $8,584 (reported on 38.0% of returns )(% of AGI for various income ranges: 3.3% for AGIs below $25k , 3.7% for AGIs $25k-50k , 4.8% for AGIs $50k-75k , 5.5% for AGIs $75k-100k , 6.5% for AGIs $100k-200k , 6.2% for AGIs over 200k ) Earned income credit: $2,040 (reported on 12.7% of returns )(% of AGI for various income ranges: 4.9% for AGIs below $25k , 0.7% for AGIs $25k-50k ) Percentage of individuals using paid preparers for their 2012 taxes: 59.7%(% for various income ranges: 56.9% for AGIs below $25k , 59.9% for AGIs $25k-50k , 61.8% for AGIs $50k-75k , 61.2% for AGIs $75k-100k , 60.5% for AGIs $100k-200k , 75.6% for AGIs over 200k )
Averages for the 2004 tax year for zip code 48124, filed in 2005:
Average Adjusted Gross Income (AGI) in 2004: $55,873 (Individual Income Tax Returns) Here:
$55,873State:
$48,204
Salary/wage: $50,602 (reported on 79.6% of returns )Here:
$50,602State:
$42,791
(% of AGI for various income ranges: 112.6% for AGIs below $10k , 57.5% for AGIs $10k-25k , 72.4% for AGIs $25k-50k , 79.1% for AGIs $50k-75k , 82.6% for AGIs $75k-100k , 65.2% for AGIs over 100k ) Taxable interest for individuals: $2,231 (reported on 62.8% of returns )This zip code:
$2,231Michigan:
$1,725
(% of AGI for various income ranges: 13.0% for AGIs below $10k , 4.8% for AGIs $10k-25k , 2.7% for AGIs $25k-50k , 1.8% for AGIs $50k-75k , 1.5% for AGIs $75k-100k , 2.7% for AGIs over 100k ) Taxable dividends: $3,310 (reported on 37.0% of returns )(% of AGI for various income ranges: 8.5% for AGIs below $10k , 3.5% for AGIs $10k-25k , 2.1% for AGIs $25k-50k , 1.7% for AGIs $50k-75k , 1.6% for AGIs $75k-100k , 2.4% for AGIs over 100k ) Net capital gain/loss: +$4,460 (reported on 27.8% of returns )Here:
+$4,460State:
+$8,532
(% of AGI for various income ranges: -0.8% for AGIs below $10k , -0.1% for AGIs $10k-25k , 0.3% for AGIs $25k-50k , 0.5% for AGIs $50k-75k , 0.6% for AGIs $75k-100k , 4.7% for AGIs over 100k ) Profit/loss from business: +$11,812 (reported on 10.5% of returns )Here:
+$11,812State:
+$9,547
(% of AGI for various income ranges: 1.9% for AGIs below $10k , 4.3% for AGIs $10k-25k , 1.7% for AGIs $25k-50k , 1.2% for AGIs $50k-75k , 1.1% for AGIs $75k-100k , 3.1% for AGIs over 100k ) IRA payment deduction: $2,937 (reported on 2.4% of returns )48124:
$2,937Michigan:
$2,875
(% of AGI for various income ranges: 0.3% for AGIs below $10k , 0.3% for AGIs $10k-25k , 0.2% for AGIs $25k-50k , 0.1% for AGIs $50k-75k , 0.1% for AGIs $75k-100k , 0.1% for AGIs over 100k ) Self-employed pension: $13,860 (reported on 0.6% of returns )Here:
$13,860Michigan:
$13,826
Total itemized deductions: $17,535 (20% of AGI, reported on 47.8% of returns )Here:
$17,535State:
$18,509
Here:
19.8% of AGIState:
20.7% of AGI
(% of AGI for various income ranges: 20.8% for AGIs below $10k , 13.4% for AGIs $10k-25k , 14.8% for AGIs $25k-50k , 16.9% for AGIs $50k-75k , 16.6% for AGIs $75k-100k , 13.6% for AGIs over 100k ) Charity contributions deductions: $2,809 (3% of AGI, reported on 44.2% of returns )Here:
3.1% of AGIState:
3.6% of AGI
(% of AGI for various income ranges: 1.0% for AGIs below $10k , 1.4% for AGIs $10k-25k , 1.8% for AGIs $25k-50k , 2.1% for AGIs $50k-75k , 2.4% for AGIs $75k-100k , 2.5% for AGIs over 100k ) Total tax: $8,893 (reported on 81.4% of returns )(% of AGI for various income ranges: 3.2% for AGIs below $10k , 4.2% for AGIs $10k-25k , 7.7% for AGIs $25k-50k , 9.8% for AGIs $50k-75k , 10.6% for AGIs $75k-100k , 18.5% for AGIs over 100k ) Earned income credit: $1,381 (reported on 6.1% of returns )Percentage of individuals using paid preparers for their 2004 taxes: 59.5%(% for various income ranges: 53.6% for AGIs below $10k , 62.3% for AGIs $10k-25k , 61.3% for AGIs $25k-50k , 60.1% for AGIs $50k-75k , 59.6% for AGIs $75k-100k , 60.1% for AGIs over 100k )
Estimated median household income in 2022: This zip code:
$75,184Michigan:
$66,986
Nearest zip codes: 48128 ,
48125 ,
48127 ,
48101 ,
48228 ,
48122 .
Dearborn Zip Code Map
Percentage of family households: This zip code:
43.9%Michigan:
43.3%
Percentage of households with unmarried partners: This zip code:
4.4%Michigan:
45.7%
Likely homosexual households (counted as self-reported same-sex unmarried-partner households)
Lesbian couples: 0.1% of all households Gay men: 0.1% of all households
Household received Food Stamps/SNAP in the past 12 months: 1,450Household did not receive Food Stamps/SNAP in the past 12 months: 12,591
Women who had a birth in the past 12 months: 374 (257 now married , 117 unmarried) Women who did not have a birth in the past 12 months: 7,120 (3,175 now married , 3,936 unmarried)
Housing units in zip code 48124 with a mortgage: 6,357 (479
second mortgage , 31
home equity loan , 422
both second mortgage and home equity loan )
Houses without a mortgage: 175
Median monthly owner costs for units with a mortgage: $1,469
Median monthly owner costs for units without a mortgage: $660
Residents with income below the poverty level in 2022:
This zip code:
10.7%Whole state:
13.4%
Residents with income below 50% of the poverty level in 2022:
This zip code:
5.0%Whole state:
6.9%
Median number of rooms in houses and condos: Median number of rooms in apartments: Notable locations in this zip code not listed on our city pages
Click to draw/clear zip code borders Notable locations in zip code 48124: (A) , Dearborn Country Club (B) , Ford Museum (C) , Dearborn Fire Department Station 2 (D) , Oakwood Cardiac Rehabilitation Center - Dearborn (E) , Inkster Police Headquarters (F) . Display/hide their locations on the map
Shopping Centers: (1) , Westborn Mall Shopping Center (2) . Display/hide their locations on the map
Cemetery: (1) . Display/hide its location on the map
Parks in zip code 48124 include: (1) , Crowley Park (2) , Ford Field (3) , Charles A Kandt House Historical Marker (4) , Dearborn Hills Golf Club Historical Marker (5) , Dearborn Inn Historical Marker (6) , Colonial Homes and Adjacent Buildings Historical Marker (7) , The Edison Institute Historical Marker (8) , Ford Airport Historical Marker (9) . Display/hide their locations on the map
Year house built (houses)
34 2020 or later84 2010 to 2019417 2000 to 2009238 1990 to 1999472 1980 to 1989873 1970 to 1979955 1960 to 19695,600 1950 to 19593,435 1940 to 19492,301 1939 or earlier
Zip code 48124 household income distribution in 2022 802 Less than $10,000295 $10,000 to $14,999263 $15,000 to $19,999411 $20,000 to $24,999368 $25,000 to $29,999461 $30,000 to $34,999373 $35,000 to $39,999589 $40,000 to $44,999625 $45,000 to $49,999932 $50,000 to $59,9991,907 $60,000 to $74,9992,348 $75,000 to $99,9991,373 $100,000 to $124,9991,048 $125,000 to $149,9991,368 $150,000 to $199,999898 $200,000 or moreEstimate of home value of owner-occupied houses/condos in 2022 in zip code 48124 34 Less than $10,00033 $10,000 to $14,99977 $15,000 to $19,99911 $20,000 to $24,99918 $25,000 to $29,99911 $30,000 to $34,9998 $35,000 to $39,99946 $40,000 to $49,99965 $50,000 to $59,99960 $60,000 to $69,99983 $70,000 to $79,999207 $80,000 to $89,999224 $90,000 to $99,999899 $100,000 to $124,9991,101 $125,000 to $149,9992,131 $150,000 to $174,9991,022 $175,000 to $199,9991,612 $200,000 to $249,9991,032 $250,000 to $299,9991,105 $300,000 to $399,999393 $400,000 to $499,999426 $500,000 to $749,999299 $750,000 to $999,99973 $1,000,000 to $1,499,99915 $1,500,000 to $1,999,9995 $2,000,000 or moreRent paid by renters in 2022 in zip code 48124 20 $150 to $19958 $250 to $2996 $300 to $34921 $350 to $39955 $400 to $44954 $450 to $49939 $550 to $59987 $600 to $649100 $650 to $69962 $700 to $749157 $750 to $799204 $800 to $899303 $900 to $999564 $1,000 to $1,249447 $1,250 to $1,499312 $1,500 to $1,99911 $2,000 to $2,499255 No cash rent
Median gross rent in 2022: $1,235.
Median price asked for vacant for-sale houses and condos in 2022: $162,938.
Estimated median house (or condo) value in 2022 for: White Non-Hispanic householders: $197,611Black or African American householders: $239,124American Indian or Alaska Native householders: $180,042Asian householders: $209,583Native Hawaiian and other Pacific Islander householders: $101,060Some other race householders: $160,919Two or more races householders: $181,908Hispanic or Latino householders: $174,912Estimated median house or condo value in 2022: $196,057
48124:
$196,057Michigan:
$224,400
Lower value quartile - upper value quartile: $153,472 - $280,562
Mean price in 2022: Detached houses: $245,686Here:
$245,686State:
$280,038
Townhouses or other attached units: $259,688Here:
$259,688State:
$239,520
In 2-unit structures: $346,664Here:
$346,664State:
$219,481
In 3-to-4-unit structures: $153,357Here:
$153,357State:
$207,067
In 5-or-more-unit structures: $118,702Here:
$118,702State:
$192,733
Mobile homes: $99,714Here:
$99,714State:
$72,868
Housing units in structures:
One, detached: 12,572One, attached: 585Two: 3063 or 4: 1895 to 9: 12810 to 19: 13520 to 49: 17150 or more: 613Mobile homes: 15Unemployment : 4.1%
Means of transportation to work in zip code 48124 77.3% 12,178 Drove a car alone6.1% 955 Carpooled0.4% 65 Bus or trolley bus0.1% 10 Taxi0.2% 35 Bicycle0.2% 29 Walked0.7% 108 Other means15.5% 2,440 Worked at homeTravel time to work (commute) in zip code 48124 148 Less than 5 minutes1,465 5 to 9 minutes2,282 10 to 14 minutes2,220 15 to 19 minutes2,379 20 to 24 minutes1,012 25 to 29 minutes1,866 30 to 34 minutes332 35 to 39 minutes500 40 to 44 minutes946 45 to 59 minutes132 60 to 89 minutes100 90 or more minutes
Neighborhoods in zip code 48124: Percentage of zip code residents living and working in this county: 87.1%
Household type by relationship:
Households: 33,965
Male householders: 6,893 (2,266 living alone ), Female householders: 7,184 (2,590 living alone )6,394 spouses (6,311 opposite-sex spouses ), 616 unmarried partners , (597 opposite-sex unmarried partners ), 11,016 children (10,643 natural , 115 adopted , 265 stepchildren ), 268 grandchildren , 418 brothers or sisters , 327 parents , 11 foster children , 297 other relatives , 515 non-relatives In group quarters: 4 (-1 institutionalized population )
Size of family households: 3,980 2-persons , 1,856 3-persons , 1,255 4-persons , 817 5-persons , 411 6-persons , 156 7-or-more-persons
Size of nonfamily households: 4,856 1-person , 683 2-persons , 41 3-persons , 22 4-persons
5,640 married couples with children. single-parent households (415 men , 1,293 women ).
80.6% of residents of 48124 zip code speak English at home. of residents speak Spanish at home (84% very well, 8% well, 9% not well ).of residents speak other Indo-European language at home (86% very well, 8% well, 6% not well ).of residents speak Asian or Pacific Island language at home (40% very well, 46% well, 15% not well ).of residents speak other language at home (74% very well, 14% well, 10% not well, 1% not at all ).
Foreign born population: 3,792 (11.2%)
(71.7%
of them are naturalized citizens )
This zip code:
11.2%Whole state:
6.9%
32% Kuwait 9% Georgia 8% United Arab Emirates 4% Sudan 3% Lebanon 3% Saudi Arabia 2% Israel 17% Lebanese 10% Polish 7% English 6% German 5% Italian 4% Irish 4% American
Year of entry for the foreign-born population
1,357 2010 or later 761 2000 to 2009 827 1990 to 1999 1,169 Before 1990
There are
115 Internal Medicine Specialists 81 Radiologists 73 Dentists 572 Other Medical Specialists in Zip Code 48124.
Major facilities with environmental interests located in this zip code:
EDSEL FORD HIGH SCHOOL (20601 ROTUNDA DR in DEARBORN, MI)
(Geographic Names Information System) (National Center for Education Statistics) - STATE ID-01092 Small Quantity Generators, between 100 kg and 1000 kg of hazardous waste/month (Resource Conservation and Recovery Act (tracking hazardous waste)) - notification Organizations: DEARBORN PUBLIC SCHOOLS (CONTACT/OPERATOR)
, DEARBORN CITY SCHOOL DISTRICT (SCHOOL DISTRICT)
DUVALL SCHOOL (22561 BEECH STREET in DEARBORN, MI)
(Geographic Names Information System) (National Center for Education Statistics) - STATE ID-00977 Organizations: DEARBORN CITY SCHOOL DISTRICT (SCHOOL DISTRICT)
EDISON INSTITUTE (20900 OAKWOOD BLVD in DEARBORN, MI)
AIR MINOR (AIRS/AFS) Small Quantity Generators, between 100 kg and 1000 kg of hazardous waste/month (Resource Conservation and Recovery Act (tracking hazardous waste)) Business SIC classification: RAILROADS, LINE-HAUL OPERATINGOrganizations: EDISON INSTITUTE THE (CONTACT/OPERATOR)
ADAMS JUNIOR HIGH SCHOOL (835 MASON in DEARBORN, MI)
(Resource Conservation and Recovery Act (tracking hazardous waste)) Organizations: DEARBORN PUBLIC SCHOOLS (CONTACT/OPERATOR)
AMERICAN AIRCRAFT PARTS MFG CO (25331 TROWBRIDGE in DEARBORN, MI)
(Resource Conservation and Recovery Act (tracking hazardous waste)) Organizations: LIPTON HARRY (CONTACT/OWNER)
AMOCO OIL CO 5250 SVC DEARBORN (22096 MICHIGAN in DEARBORN, MI)
(Resource Conservation and Recovery Act (tracking hazardous waste)) Organizations: DEARBORN AMOCO SVC (CONTACT/OWNER)
MI DEPT/TRANSPORTATION BRIDGE B02-82192 (M-39 SB OVER ROUGE RIVER in DEARBORN, MI)
(Resource Conservation and Recovery Act (tracking hazardous waste)) Organizations: MICH DEPT OF TRANSPORTATION (CONTACT/OPERATOR)
Alternative names: MIDOT BRIDGE M-39 OVER ECORSE RIVER
FORWARD INDUSTRIES INC (25801 TROWBRIDGE in DEARBORN, MI)
(Resource Conservation and Recovery Act (tracking hazardous waste))
DI DRO SYSTEMS INC (23874 KEAN AVE in DEARBORN, MI)
(Resource Conservation and Recovery Act (tracking hazardous waste)) Organizations: SEHN FRANCIS (CONTACT/OWNER)
DVVS INC (23403 KEAN in DEARBORN, MI)
(Resource Conservation and Recovery Act (tracking hazardous waste)) Organizations: DVVS-JAMES HINKLE (CONTACT/OWNER)
E & D AUTO REPAIR (24601 MICHIGAN AVE in DEARBORN, MI)
(Resource Conservation and Recovery Act (tracking hazardous waste)) Business NAICS classification: GENERAL AUTOMOTIVE REPAIR.Organizations: HAMED EL SHAMI (CONTACT/OWNER)
B L SIMS CO (22074 MICHIGAN AVE in DEARBORN, MI)
AIR MINOR (AIRS/AFS) Business SIC classification: VARIETY STORES
MERCURY HOUSE-DEARBORN (23232 COLUMBIA STREET in DEARBORN, MI)
SUPERFUND (Superfund database) Conditionally Exempt Small Quantity Generators, less than 100 kg/month of hazardous waste (Resource Conservation and Recovery Act (tracking hazardous waste)) Organizations: ESTATE OF RICHARD E RAHMAN (CONTACT/OWNER)
Alternative names: DEARBORN MERCURY HOUSE, DEARBORN MERCURY HOUSE SITE
Housing units lacking complete plumbing facilities: 0.4%
Housing units lacking complete kitchen facilities: 0.7%
88.8% Utility gas 9.1% Electricity 1.3% Bottled, tank, or LP gas 0.6% No fuel used
Population in 1990: 34,078.
Place of birth for U.S.-born residents:
This state: 25,586Northeast: 907Midwest: 1,274South: 1,438West: 573
67% of the 48124 zip code residents lived in the same house 5 years ago.
Out of people who lived in different houses, 79% lived in this county.
Out of people who lived in different counties, 50% lived in Michigan.
92% of the 48124 zip code residents lived in the same house 1 year ago.
Out of people who lived in different houses, 74% moved from this county.
Out of people who lived in different houses, 10% moved from different county within same state.
Out of people who lived in different houses, 10% moved from different state.
Out of people who lived in different houses, 5% moved from abroad.
Private vs. public school enrollment:
Students in private schools in grades 1 to 8 (elementary and middle school): 682
Students in private schools in grades 9 to 12 (high school): 125
Students in private undergraduate colleges: 332
Occupation by median earnings in the past 12 months ($)
91,363 Architecture and engineering occupations 88,575 Computer and mathematical occupations 81,017 Law enforcement workers including supervisors 78,257 Management occupations 72,280 Health diagnosing and treating practitioners and other technical occupations 70,078 Legal occupations
Companies with federal contracts located in this zip code (DEARBORN, MI):
MALLTECH, LLC (3733 S TELEGRAPH RD; small business) in 3 contracts from 2002 to 2003
$364,829 with Air Force for Weapons -- Basic Research (R&D). Signed on 2003-03-26. Completion date: 2005-07-03.
, same as above. Signed on 2003-09-24. Completion date: 2005-07-03.
, same as above. Signed on 2002-05-30. Completion date: 2003-03-31.
BRENDEL ASSOCIATES LIMITED (24407 ROCKFORD ST; small business)
$67,593 with Army for Liquid and Gas Flow, Liquid Level, and Mechanical Motion Measuring Instruments. Signed on 2004-04-08. Completion date: 2004-03-13.
POWER TECHNIQUES INC (23400 MICHIGAN AVE STE 500; small business)
$11,652 with Army for Telephone and Telegraph Equipment. Signed on 2002-08-13. Completion date: 2002-05-10.
SEVEN SEAS MANAGEMENT, INC (19853 OUTER DR; small business)
$3,793 with Air Force for Food Cooking, Baking, and Serving Equipment. Signed on 2005-08-31. Completion date: 2005-09-21.
Top industries in this zip code by the number of employees in 2005:
Management of Companies and Enterprises: Corporate, Subsidiary, and Regional Managing Offices (500-999 employees: 2 establishments, 20-49 employees: 1 establishment, 10-19 employees: 1 establishment, 5-9 employees: 1 establishment, 1-4 employees: 1 establishment)Arts, Entertainment, and Recreation: Museums (over 1000: 1, 10-19: 1)Professional, Scientific, and Technical Services: Research and Development in the Physical, Engineering, and Life Sciences (over 1000: 1)Health Care and Social Assistance: General Medical and Surgical Hospitals (over 1000: 1)Accommodation and Food Services: Full-Service Restaurants (100-249: 2, 50-99: 5, 20-49: 10, 10-19: 3, 5-9: 4, 1-4: 5)Health Care and Social Assistance: Offices of Physicians (except Mental Health Specialists) (50-99: 1, 20-49: 6, 10-19: 15, 5-9: 22, 1-4: 39)Accommodation and Food Services: Limited-Service Restaurants (20-49: 11, 10-19: 8, 5-9: 3, 1-4: 4)Health Care and Social Assistance: Offices of Dentists (20-49: 4, 10-19: 15, 5-9: 14, 1-4: 11)Professional, Scientific, and Technical Services: Computer Facilities Management Services (250-499: 1, 20-49: 1)
People in group quarters in 2010:
15 people in local jails and other municipal confinement facilities
4 people in group homes intended for adults
People in group quarters in 2000:
92 people in other noninstitutional group quarters
27 people in hospitals/wards and hospices for chronically ill
27 people in other hospitals or wards for chronically ill
5 people in homes for the mentally retarded
5 people in religious group quarters
Fatal accident statistics in 2014:
Fatal accident count: 3Vehicles involved in fatal accidents: 4Fatal accidents caused by drunken drivers: 0Fatalities: 3Persons involved in fatal accidents: 11Pedestrians involved in fatal accidents: 0
Fatal accident statistics in 2013:
Fatal accident count: 2Vehicles involved in fatal accidents: 4Fatal accidents caused by drunken drivers: 1Fatalities: 2Persons involved in fatal accidents: 5Pedestrians involved in fatal accidents: 0
Home Mortgage Disclosure Act Aggregated Statistics For Year 2009(Based on 11 full and 8 partial tracts) A) FHA, FSA/RHS & VA B) Conventional C) Refinancings D) Home Improvement Loans E) Loans on Dwellings For 5+ Families F) Non-occupant Loans on G) Loans On Manufactured Number Average Value Number Average Value Number Average Value Number Average Value Number Average Value Number Average Value Number Average Value
LOANS ORIGINATED 310 $93,992 187 $108,834 590 $140,310 39 $38,787 0 $0 45 $67,842 2 $45,000 APPLICATIONS APPROVED, NOT ACCEPTED 28 $98,507 21 $133,102 73 $137,569 7 $17,806 0 $0 9 $101,112 2 $25,800 APPLICATIONS DENIED 47 $94,065 48 $111,750 226 $160,281 43 $54,338 0 $0 28 $69,898 3 $27,940 APPLICATIONS WITHDRAWN 35 $106,443 16 $98,628 109 $136,440 9 $27,786 0 $0 8 $85,601 0 $0 FILES CLOSED FOR INCOMPLETENESS 8 $77,892 4 $92,682 32 $146,072 1 $100,000 2 $508,110 4 $186,912 0 $0
Aggregated Statistics For Year 2008(Based on 11 full and 8 partial tracts) A) FHA, FSA/RHS & VA B) Conventional C) Refinancings D) Home Improvement Loans E) Loans on Dwellings For 5+ Families F) Non-occupant Loans on G) Loans On Manufactured Number Average Value Number Average Value Number Average Value Number Average Value Number Average Value Number Average Value Number Average Value
LOANS ORIGINATED 212 $120,411 301 $128,704 403 $145,278 66 $20,896 2 $5,995,000 85 $85,658 2 $34,000 APPLICATIONS APPROVED, NOT ACCEPTED 11 $107,105 45 $162,389 96 $162,479 21 $32,366 0 $0 18 $105,591 0 $0 APPLICATIONS DENIED 26 $155,708 79 $130,592 310 $153,309 96 $63,201 0 $0 44 $102,846 5 $41,094 APPLICATIONS WITHDRAWN 20 $107,204 52 $158,299 113 $164,706 6 $34,950 0 $0 18 $88,872 0 $0 FILES CLOSED FOR INCOMPLETENESS 8 $159,924 14 $154,214 34 $165,566 8 $120,342 0 $0 10 $99,806 0 $0
Aggregated Statistics For Year 2007(Based on 11 full and 8 partial tracts) A) FHA, FSA/RHS & VA B) Conventional C) Refinancings D) Home Improvement Loans E) Loans on Dwellings For 5+ Families F) Non-occupant Loans on G) Loans On Manufactured Number Average Value Number Average Value Number Average Value Number Average Value Number Average Value Number Average Value Number Average Value
LOANS ORIGINATED 51 $125,732 774 $137,051 934 $131,761 94 $46,151 2 $1,021,500 117 $116,894 0 $0 APPLICATIONS APPROVED, NOT ACCEPTED 0 $0 122 $129,090 248 $140,948 31 $59,306 0 $0 41 $79,186 2 $10,645 APPLICATIONS DENIED 12 $135,744 262 $166,296 707 $137,766 124 $52,105 0 $0 77 $113,425 14 $36,960 APPLICATIONS WITHDRAWN 7 $126,201 65 $157,491 215 $146,405 11 $54,943 1 $97,000 20 $138,657 0 $0 FILES CLOSED FOR INCOMPLETENESS 1 $120,000 30 $215,224 93 $134,315 8 $150,008 0 $0 2 $80,000 0 $0
Aggregated Statistics For Year 2006(Based on 11 full and 8 partial tracts) A) FHA, FSA/RHS & VA B) Conventional C) Refinancings D) Home Improvement Loans E) Loans on Dwellings For 5+ Families F) Non-occupant Loans on G) Loans On Manufactured Number Average Value Number Average Value Number Average Value Number Average Value Number Average Value Number Average Value Number Average Value
LOANS ORIGINATED 63 $127,976 1,203 $115,987 1,334 $115,938 184 $41,051 2 $2,133,660 214 $98,967 5 $44,400 APPLICATIONS APPROVED, NOT ACCEPTED 6 $114,815 165 $147,294 292 $110,211 30 $102,486 0 $0 29 $150,512 0 $0 APPLICATIONS DENIED 7 $125,571 324 $140,066 762 $132,807 135 $67,990 0 $0 57 $165,274 7 $40,929 APPLICATIONS WITHDRAWN 6 $130,515 136 $113,217 359 $140,537 21 $34,911 0 $0 40 $95,387 0 $0 FILES CLOSED FOR INCOMPLETENESS 1 $169,000 36 $146,645 184 $136,753 3 $114,303 0 $0 9 $106,111 0 $0
Aggregated Statistics For Year 2005(Based on 11 full and 8 partial tracts) A) FHA, FSA/RHS & VA B) Conventional C) Refinancings D) Home Improvement Loans E) Loans on Dwellings For 5+ Families F) Non-occupant Loans on G) Loans On Manufactured Number Average Value Number Average Value Number Average Value Number Average Value Number Average Value Number Average Value Number Average Value
LOANS ORIGINATED 94 $137,752 1,221 $127,023 1,742 $134,447 182 $45,997 2 $6,902,000 198 $101,475 1 $22,000 APPLICATIONS APPROVED, NOT ACCEPTED 3 $124,667 195 $128,541 264 $141,212 52 $53,705 0 $0 29 $123,996 7 $38,926 APPLICATIONS DENIED 6 $124,833 276 $136,850 822 $147,713 124 $65,136 0 $0 37 $124,903 3 $61,667 APPLICATIONS WITHDRAWN 6 $137,862 169 $201,722 445 $144,883 52 $95,359 0 $0 37 $125,832 1 $140,000 FILES CLOSED FOR INCOMPLETENESS 6 $126,850 47 $114,732 326 $158,755 22 $64,262 0 $0 16 $95,878 0 $0
Aggregated Statistics For Year 2004(Based on 11 full and 8 partial tracts) A) FHA, FSA/RHS & VA B) Conventional C) Refinancings D) Home Improvement Loans E) Loans on Dwellings For 5+ Families F) Non-occupant Loans on G) Loans On Manufactured Number Average Value Number Average Value Number Average Value Number Average Value Number Average Value Number Average Value Number Average Value
LOANS ORIGINATED 107 $134,630 1,027 $133,983 2,008 $144,910 139 $60,514 0 $0 135 $123,981 0 $0 APPLICATIONS APPROVED, NOT ACCEPTED 5 $126,860 99 $136,230 371 $146,972 30 $51,767 0 $0 23 $104,190 3 $67,750 APPLICATIONS DENIED 13 $114,987 184 $129,849 626 $147,568 135 $37,466 0 $0 34 $135,980 2 $57,655 APPLICATIONS WITHDRAWN 6 $141,878 113 $144,339 479 $143,327 33 $58,301 2 $1,736,700 20 $146,118 0 $0 FILES CLOSED FOR INCOMPLETENESS 6 $153,358 24 $141,487 152 $152,602 18 $46,158 0 $0 12 $127,910 0 $0
Aggregated Statistics For Year 2003(Based on 11 full and 8 partial tracts) A) FHA, FSA/RHS & VA B) Conventional C) Refinancings D) Home Improvement Loans F) Non-occupant Loans on Number Average Value Number Average Value Number Average Value Number Average Value Number Average Value
LOANS ORIGINATED 155 $136,342 1,004 $145,892 5,220 $133,796 161 $23,977 240 $115,395 APPLICATIONS APPROVED, NOT ACCEPTED 3 $141,290 98 $147,988 549 $132,634 36 $11,764 39 $116,432 APPLICATIONS DENIED 18 $135,779 141 $172,193 751 $134,002 143 $24,942 49 $131,631 APPLICATIONS WITHDRAWN 11 $127,676 89 $152,550 586 $139,010 9 $62,139 35 $111,159 FILES CLOSED FOR INCOMPLETENESS 8 $140,720 35 $169,755 144 $140,151 5 $51,474 9 $110,330
Aggregated Statistics For Year 2002(Based on 11 full and 8 partial tracts) A) FHA, FSA/RHS & VA B) Conventional C) Refinancings D) Home Improvement Loans F) Non-occupant Loans on Number Average Value Number Average Value Number Average Value Number Average Value Number Average Value
LOANS ORIGINATED 217 $130,770 936 $147,598 3,562 $133,350 176 $22,365 165 $100,864 APPLICATIONS APPROVED, NOT ACCEPTED 3 $111,087 70 $145,525 397 $123,118 43 $33,915 16 $77,005 APPLICATIONS DENIED 20 $127,370 78 $140,245 521 $127,287 122 $12,514 19 $110,816 APPLICATIONS WITHDRAWN 21 $120,648 51 $225,202 440 $124,827 14 $34,483 32 $104,092 FILES CLOSED FOR INCOMPLETENESS 5 $142,374 14 $166,822 118 $133,545 2 $22,175 4 $111,538
Aggregated Statistics For Year 2001(Based on 11 full and 8 partial tracts) A) FHA, FSA/RHS & VA B) Conventional C) Refinancings D) Home Improvement Loans E) Loans on Dwellings For 5+ Families F) Non-occupant Loans on Number Average Value Number Average Value Number Average Value Number Average Value Number Average Value Number Average Value
LOANS ORIGINATED 273 $123,899 1,024 $137,954 3,112 $128,279 286 $19,139 3 $180,483 226 $111,914 APPLICATIONS APPROVED, NOT ACCEPTED 3 $97,213 61 $142,309 273 $111,541 58 $24,147 0 $0 10 $97,784 APPLICATIONS DENIED 12 $121,732 81 $125,257 471 $98,328 146 $18,079 0 $0 19 $71,130 APPLICATIONS WITHDRAWN 10 $109,937 56 $137,914 350 $110,750 15 $57,689 0 $0 12 $100,995 FILES CLOSED FOR INCOMPLETENESS 7 $106,573 12 $237,077 116 $112,099 6 $19,435 0 $0 6 $101,317
Aggregated Statistics For Year 2000(Based on 11 full and 8 partial tracts) A) FHA, FSA/RHS & VA B) Conventional C) Refinancings D) Home Improvement Loans E) Loans on Dwellings For 5+ Families F) Non-occupant Loans on Number Average Value Number Average Value Number Average Value Number Average Value Number Average Value Number Average Value
LOANS ORIGINATED 227 $115,977 926 $136,379 711 $108,310 300 $21,346 0 $0 111 $100,231 APPLICATIONS APPROVED, NOT ACCEPTED 4 $108,008 61 $125,581 139 $107,744 68 $18,717 0 $0 5 $66,660 APPLICATIONS DENIED 6 $86,968 103 $94,290 308 $83,429 155 $19,023 2 $501,655 15 $75,959 APPLICATIONS WITHDRAWN 9 $127,340 78 $138,296 162 $89,446 21 $68,068 0 $0 11 $71,092 FILES CLOSED FOR INCOMPLETENESS 5 $106,940 14 $113,334 53 $104,982 7 $39,787 0 $0 0 $0
Aggregated Statistics For Year 1999(Based on 7 full and 4 partial tracts) A) FHA, FSA/RHS & VA B) Conventional C) Refinancings D) Home Improvement Loans F) Non-occupant Loans on Number Average Value Number Average Value Number Average Value Number Average Value Number Average Value
LOANS ORIGINATED 138 $107,683 594 $122,071 855 $105,923 211 $19,733 65 $84,627 APPLICATIONS APPROVED, NOT ACCEPTED 3 $73,240 31 $126,275 134 $81,374 42 $26,489 4 $45,332 APPLICATIONS DENIED 7 $113,244 57 $87,476 171 $96,277 69 $14,481 4 $74,278 APPLICATIONS WITHDRAWN 6 $120,280 43 $120,128 156 $101,197 12 $36,157 5 $116,992 FILES CLOSED FOR INCOMPLETENESS 0 $0 11 $136,516 50 $95,062 1 $17,740 0 $0
Private Mortgage Insurance Companies Aggregated Statistics For Year 2009(Based on 9 full and 6 partial tracts) A) Conventional B) Refinancings Number Average Value Number Average Value
LOANS ORIGINATED 44 $143,613 9 $177,434 APPLICATIONS APPROVED, NOT ACCEPTED 5 $91,418 8 $215,202 APPLICATIONS DENIED 8 $114,514 2 $160,950 APPLICATIONS WITHDRAWN 4 $43,978 0 $0 FILES CLOSED FOR INCOMPLETENESS 7 $240,646 0 $0
Aggregated Statistics For Year 2008(Based on 11 full and 6 partial tracts) A) Conventional B) Refinancings C) Non-occupant Loans on Number Average Value Number Average Value Number Average Value
LOANS ORIGINATED 116 $157,747 43 $156,746 12 $107,533 APPLICATIONS APPROVED, NOT ACCEPTED 58 $168,654 54 $149,751 22 $81,665 APPLICATIONS DENIED 12 $183,646 3 $103,667 2 $189,450 APPLICATIONS WITHDRAWN 2 $116,110 5 $124,000 0 $0 FILES CLOSED FOR INCOMPLETENESS 2 $538,040 4 $135,530 4 $135,530
Aggregated Statistics For Year 2007(Based on 11 full and 8 partial tracts) A) Conventional B) Refinancings C) Non-occupant Loans on Number Average Value Number Average Value Number Average Value
LOANS ORIGINATED 282 $144,212 96 $155,119 27 $107,556 APPLICATIONS APPROVED, NOT ACCEPTED 38 $149,007 19 $213,224 7 $103,209 APPLICATIONS DENIED 2 $161,000 2 $110,000 1 $185,000 APPLICATIONS WITHDRAWN 13 $155,799 4 $111,500 2 $108,000 FILES CLOSED FOR INCOMPLETENESS 0 $0 2 $157,000 2 $157,000
Aggregated Statistics For Year 2006(Based on 11 full and 6 partial tracts) A) Conventional B) Refinancings C) Non-occupant Loans on Number Average Value Number Average Value Number Average Value
LOANS ORIGINATED 134 $157,726 55 $175,004 11 $158,768 APPLICATIONS APPROVED, NOT ACCEPTED 22 $175,191 11 $176,670 0 $0 APPLICATIONS DENIED 4 $111,500 0 $0 3 $111,000 APPLICATIONS WITHDRAWN 0 $0 15 $175,506 2 $123,000 FILES CLOSED FOR INCOMPLETENESS 0 $0 0 $0 0 $0
Aggregated Statistics For Year 2005(Based on 11 full and 8 partial tracts) A) Conventional B) Refinancings C) Non-occupant Loans on Number Average Value Number Average Value Number Average Value
LOANS ORIGINATED 152 $149,280 86 $162,757 20 $138,746 APPLICATIONS APPROVED, NOT ACCEPTED 21 $149,312 32 $170,825 2 $237,750 APPLICATIONS DENIED 6 $117,755 1 $134,000 5 $91,906 APPLICATIONS WITHDRAWN 9 $135,518 13 $140,355 2 $85,150 FILES CLOSED FOR INCOMPLETENESS 1 $143,000 0 $0 0 $0
Aggregated Statistics For Year 2004(Based on 11 full and 8 partial tracts) A) Conventional B) Refinancings C) Non-occupant Loans on Number Average Value Number Average Value Number Average Value
LOANS ORIGINATED 212 $149,299 141 $156,470 19 $125,507 APPLICATIONS APPROVED, NOT ACCEPTED 43 $157,412 58 $172,459 2 $104,000 APPLICATIONS DENIED 0 $0 5 $289,614 0 $0 APPLICATIONS WITHDRAWN 17 $147,778 10 $148,199 4 $94,898 FILES CLOSED FOR INCOMPLETENESS 2 $175,135 0 $0 0 $0
Aggregated Statistics For Year 2003(Based on 11 full and 8 partial tracts) A) Conventional B) Refinancings C) Non-occupant Loans on Number Average Value Number Average Value Number Average Value
LOANS ORIGINATED 337 $158,968 381 $148,049 39 $109,267 APPLICATIONS APPROVED, NOT ACCEPTED 31 $144,327 106 $155,667 5 $140,300 APPLICATIONS DENIED 7 $146,133 4 $103,125 3 $111,733 APPLICATIONS WITHDRAWN 17 $204,175 30 $158,370 2 $96,685 FILES CLOSED FOR INCOMPLETENESS 3 $130,837 1 $166,000 2 $96,755
Aggregated Statistics For Year 2002(Based on 11 full and 8 partial tracts) A) Conventional B) Refinancings C) Non-occupant Loans on Number Average Value Number Average Value Number Average Value
LOANS ORIGINATED 333 $148,109 296 $146,816 32 $105,661 APPLICATIONS APPROVED, NOT ACCEPTED 39 $153,496 71 $148,128 8 $120,309 APPLICATIONS DENIED 2 $190,290 12 $124,014 0 $0 APPLICATIONS WITHDRAWN 21 $135,462 25 $160,340 6 $120,537 FILES CLOSED FOR INCOMPLETENESS 0 $0 0 $0 0 $0
Aggregated Statistics For Year 2001(Based on 11 full and 8 partial tracts) A) Conventional B) Refinancings C) Non-occupant Loans on Number Average Value Number Average Value Number Average Value
LOANS ORIGINATED 360 $142,861 304 $140,031 28 $124,201 APPLICATIONS APPROVED, NOT ACCEPTED 67 $157,752 66 $133,588 12 $118,416 APPLICATIONS DENIED 7 $131,019 7 $235,139 4 $132,652 APPLICATIONS WITHDRAWN 10 $143,145 16 $150,018 0 $0 FILES CLOSED FOR INCOMPLETENESS 1 $119,000 0 $0 0 $0
Aggregated Statistics For Year 2000(Based on 11 full and 8 partial tracts) A) Conventional B) Refinancings C) Non-occupant Loans on Number Average Value Number Average Value Number Average Value
LOANS ORIGINATED 271 $128,658 54 $120,831 22 $84,899 APPLICATIONS APPROVED, NOT ACCEPTED 37 $128,462 12 $144,127 0 $0 APPLICATIONS DENIED 6 $126,788 4 $103,000 1 $135,000 APPLICATIONS WITHDRAWN 5 $148,622 2 $278,915 0 $0 FILES CLOSED FOR INCOMPLETENESS 4 $90,632 0 $0 2 $84,265
Aggregated Statistics For Year 1999(Based on 7 full and 4 partial tracts) A) Conventional B) Refinancings C) Non-occupant Loans on Number Average Value Number Average Value Number Average Value
LOANS ORIGINATED 246 $122,943 66 $117,340 13 $85,040 APPLICATIONS APPROVED, NOT ACCEPTED 15 $124,659 18 $126,429 0 $0 APPLICATIONS DENIED 3 $122,000 1 $88,890 0 $0 APPLICATIONS WITHDRAWN 5 $134,620 5 $123,200 0 $0 FILES CLOSED FOR INCOMPLETENESS 0 $0 0 $0 0 $0
2002 - 2018 National Fire Incident Reporting System (NFIRS) incidents See full 2006 National Fire Incident Reporting System statistics for zip code 48124, Michigan
Most common first names in zip code 48124 among deceased individuals Name Count Lived (average)
John 424 75.4 years Mary 396 80.8 years William 266 75.2 years Helen 255 81.0 years Joseph 232 75.0 years Robert 212 69.9 years James 196 72.7 years George 183 75.5 years Edward 177 74.6 years Margaret 175 79.8 years
Most common last names in zip code 48124 among deceased individuals Last name Count Lived (average)
Smith 110 76.0 years Brown 56 78.8 years Miller 55 76.1 years Johnson 55 76.7 years Williams 40 79.9 years Martin 40 77.8 years Jones 38 76.7 years Anderson 36 76.5 years Wilson 35 77.4 years Taylor 34 77.6 years
Businesses in zip code 48124
Name Count Name Count
7-Eleven 2 Little Caesars Pizza 1 AT&T 1 Marriott 1 Advance Auto Parts 1 Marshalls 1 Arby's 1 McDonald's 1 Avenue 1 Men's Wearhouse 1 Baskin-Robbins 1 Nike 3 Buffalo Wild Wings 1 Panera Bread 1 Burger King 1 Payless 1 CVS 3 Pizza Hut 1 Chevrolet 1 Red Roof Inn 1 Chuck E. Cheese's 1 Rite Aid 1 Cold Stone Creamery 1 Sprint Nextel 1 Dunkin Donuts 1 Staples 1 FedEx 3 Starbucks 1 GNC 1 T-Mobile 1 GameStop 1 Taco Bell 1 H&R Block 3 Tim Hortons 1 Holiday Inn 1 Toyota 1 Honda 1 Toys"R"Us 1 Hyundai 1 UPS 3 Jones New York 1 Volkswagen 1 KFC 1 White Castle 1 Kroger 2
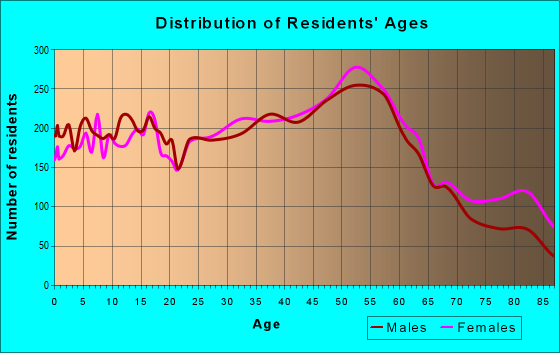
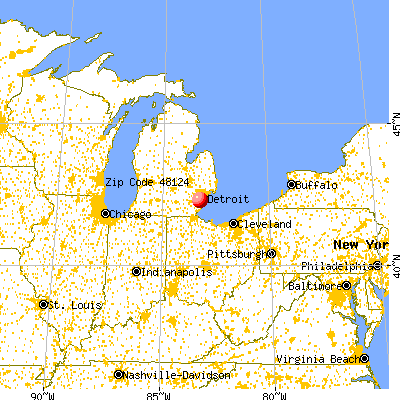


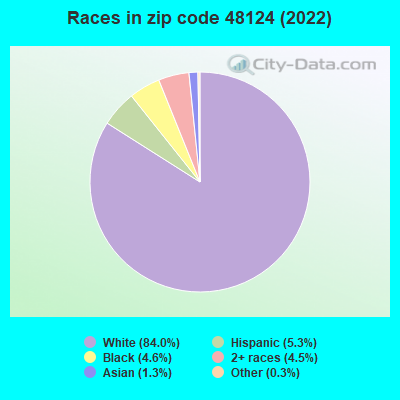


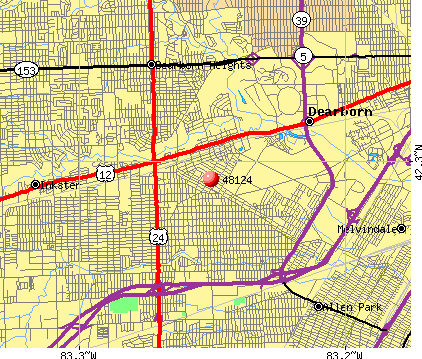 Nearest zip codes: 48128, 48125, 48127, 48101, 48228, 48122.
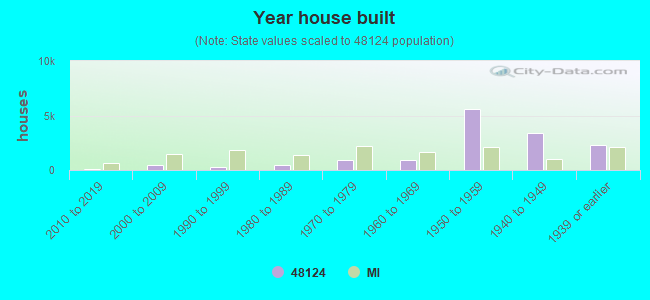
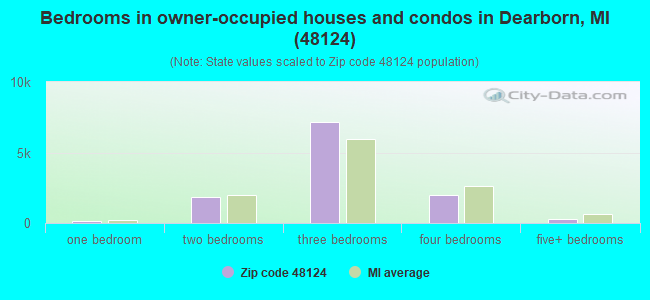
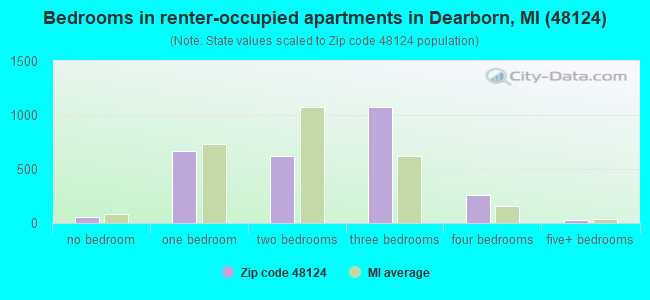
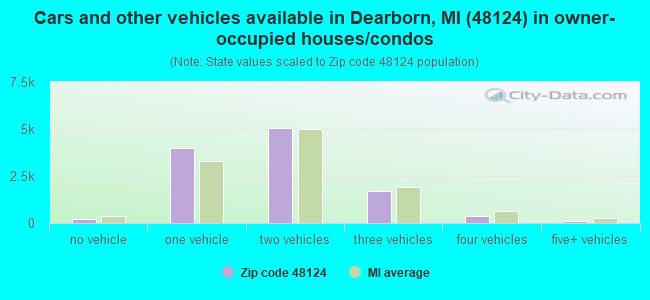
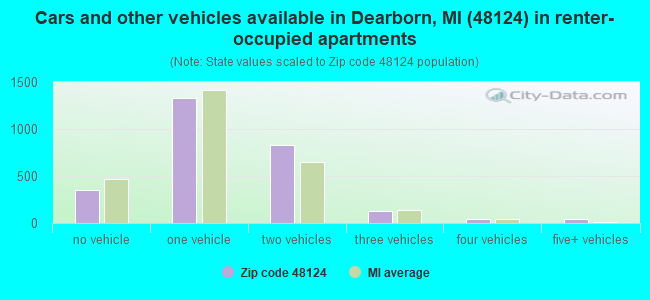


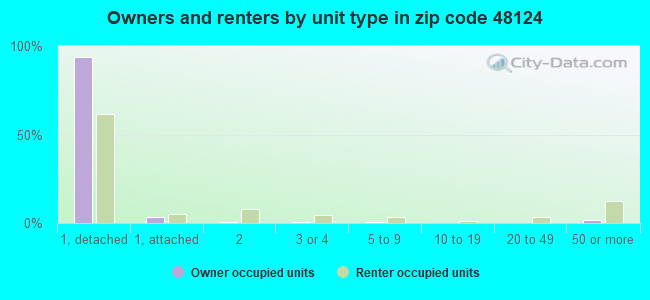
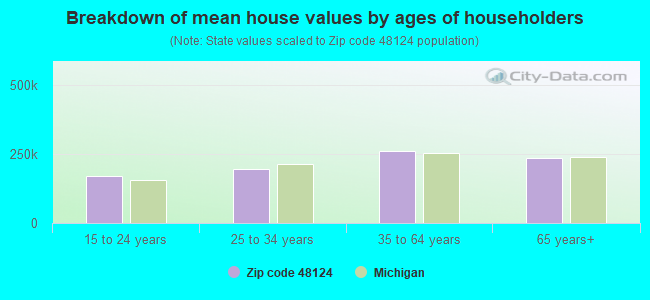


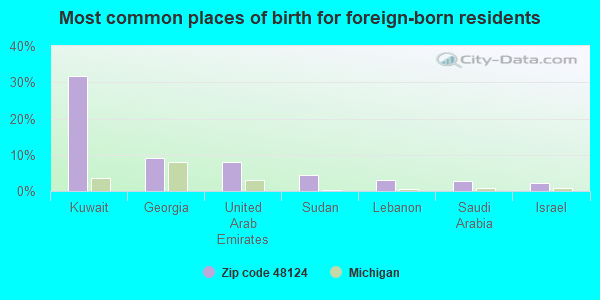
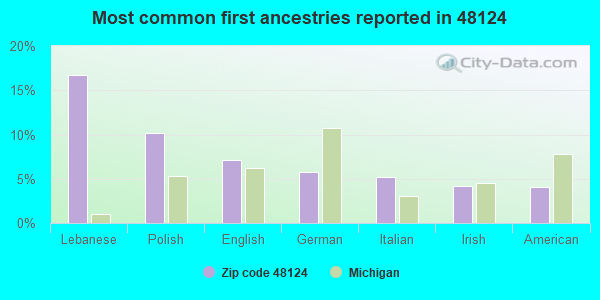
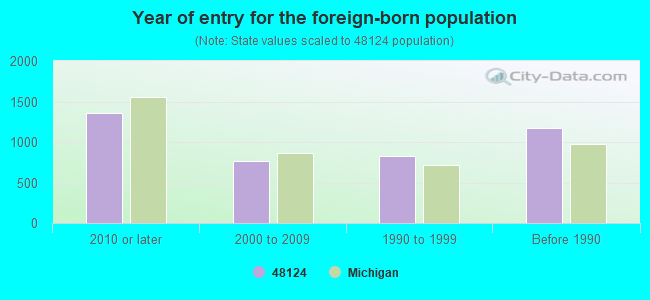


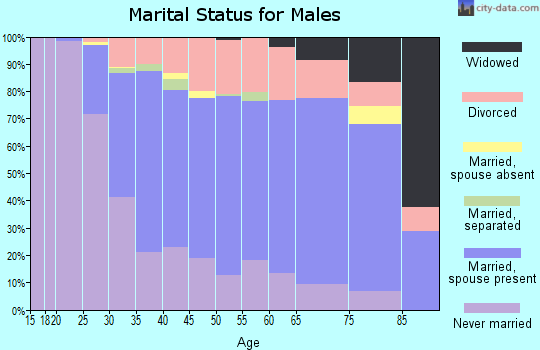
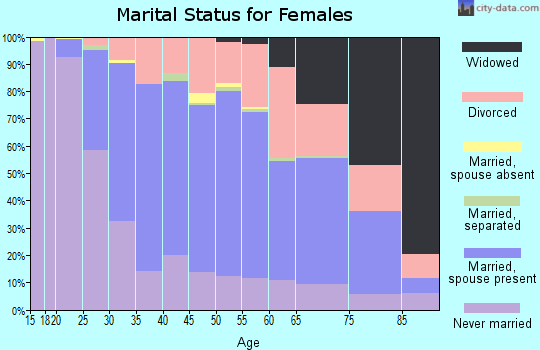
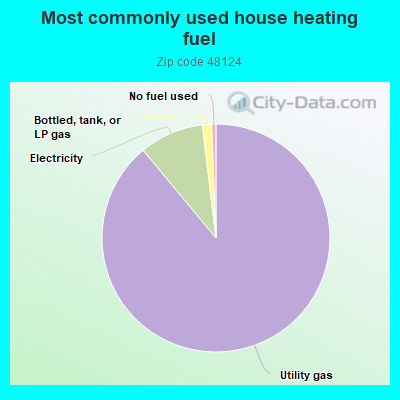
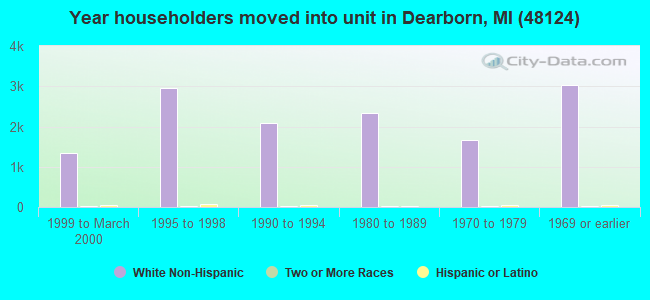
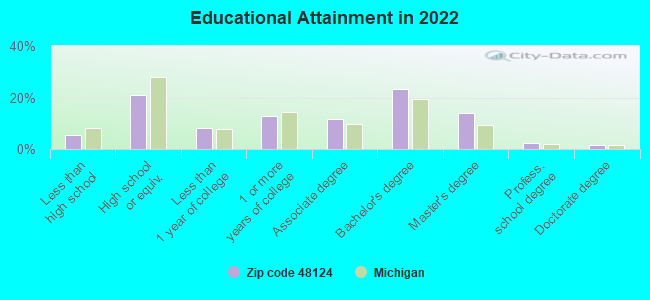
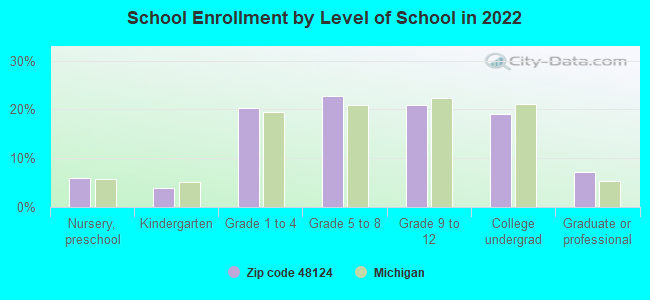
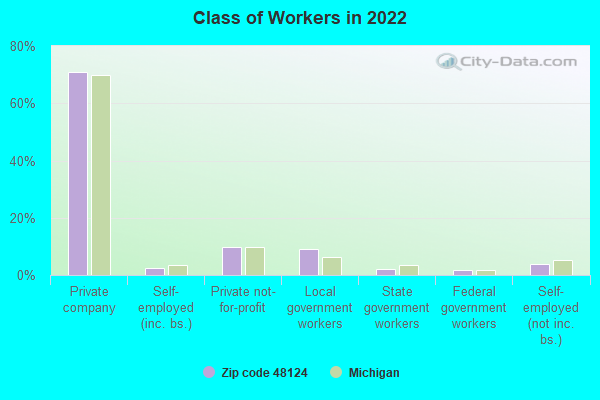
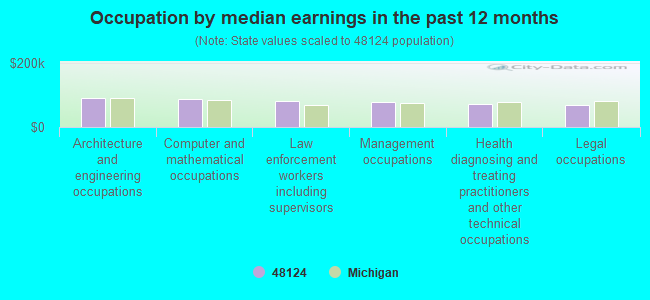
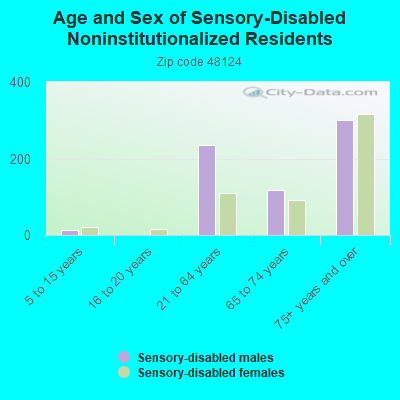
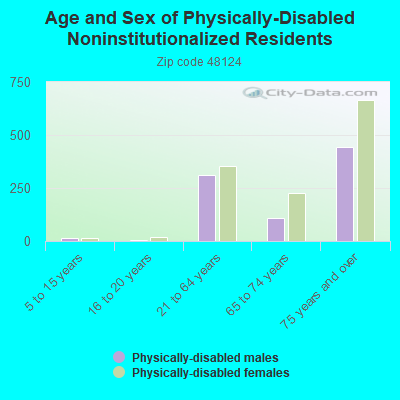
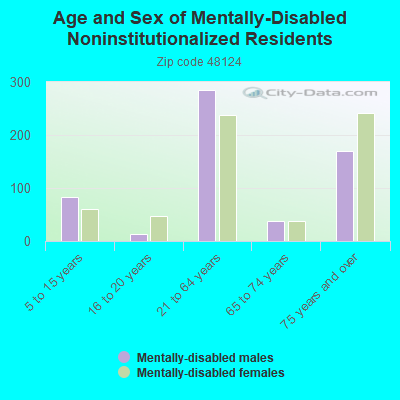
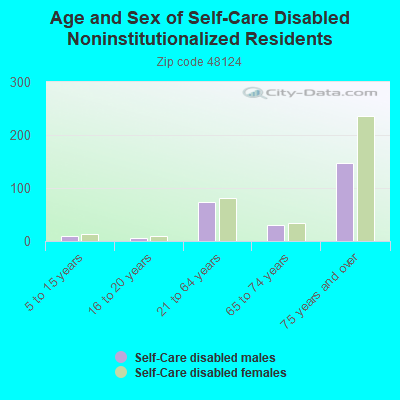
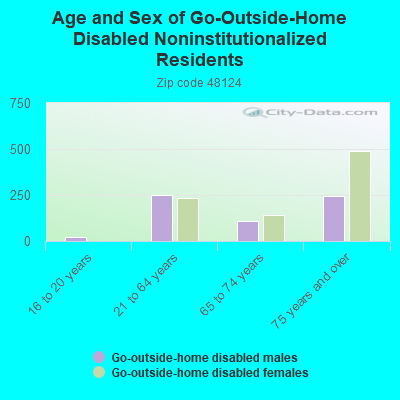
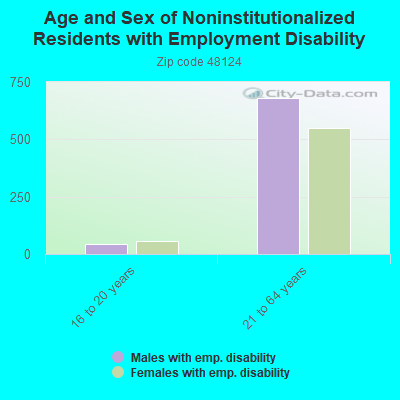
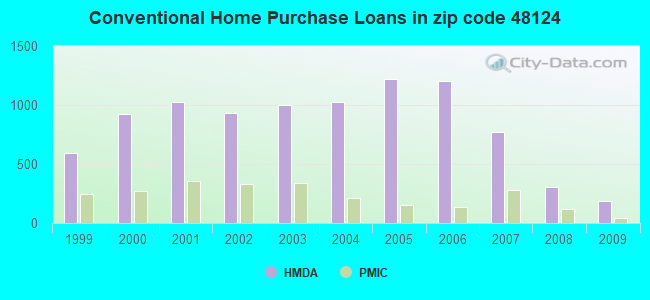
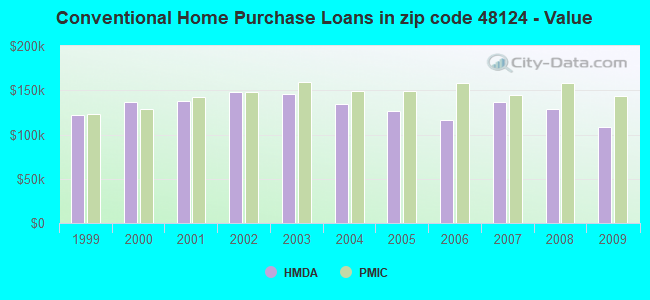
 Based on the data from the years 2002 - 2018 the average number of fires per year is 69. The highest number of reported fire incidents - 108 took place in 2003, and the least - 1 in 2013. The data has a declining trend.
 When looking into fire subcategories, the most incidents belonged to: Outside Fires (37.9%), and Structure Fires (33.3%).