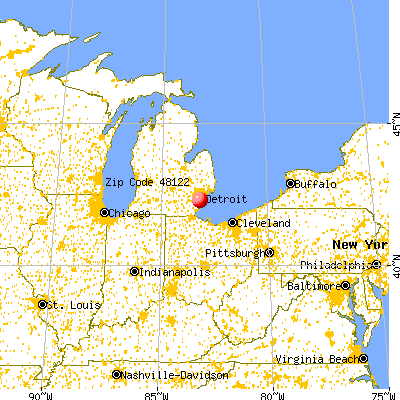
Estimated zip code population in 2022: 12,609 Zip code population in 2010: 10,727 Zip code population in 2000: 10,755
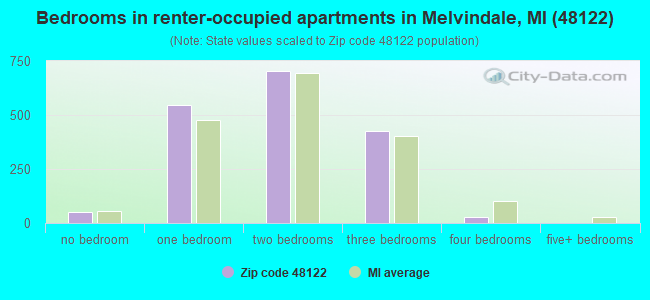
Houses and condos: 4,837 Renter-occupied apartments: 1,763
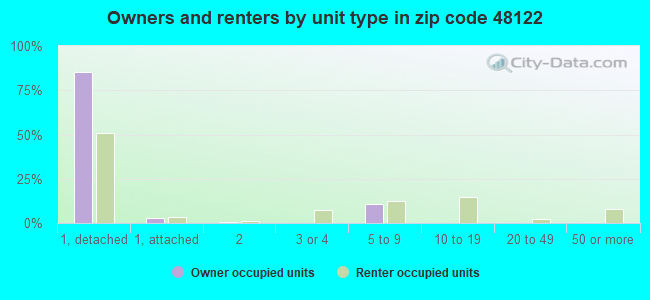
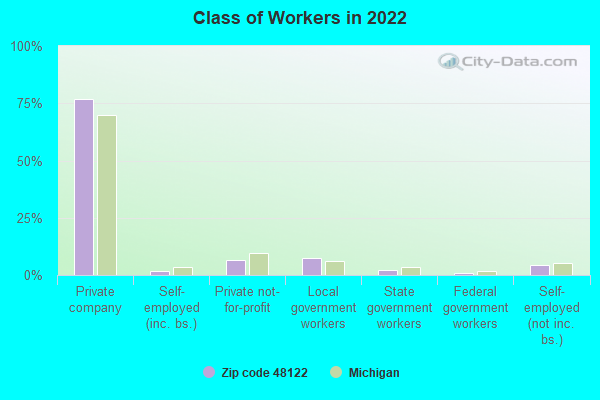
% of renters here:
39%
State:
27%
March 2022 cost of living index in zip code 48122: 95.6 (near average, U.S. average is 100)
Land area: 2.7 sq. mi. Water area: 0.0 sq. mi.
Population density: 4,629 people per square mile
(average).
OSM Map
General Map
Google Map
MSN Map
OSM Map
General Map
Google Map
MSN Map
OSM Map
General Map
Google Map
MSN Map
OSM Map
General Map
Google Map
MSN Map
Please wait while loading the map...
Real estate property taxes paid for housing units in 2022:
This zip code:
1.8% ($1,907)
Michigan:
1.2% ($2,746)
Median real estate property taxes paid for housing units with mortgages in 2022: $1,800 (1.7%) Median real estate property taxes paid for housing units with no mortgage in 2022: $1,976 (1.8%)
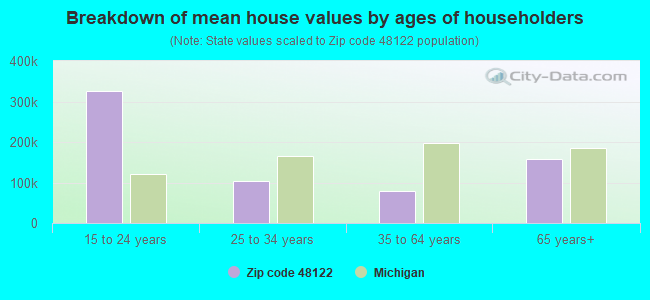
Estimated median house/condo value in 2022: $107,011
48122:
$107,011
Michigan:
$224,400
According to our research of Michigan and other state lists, there were 30 registered sex offenders living in 48122 zip code as of April 27, 2024. The ratio of all residents to sex offenders in zip code 48122 is 353 to 1. The ratio of registered sex offenders to all residents in this zip code is near the state average.
Median resident age:
This zip code:
33.9 years
Michigan median age:
40.3 years
Average household size:
This zip code:
2.8 people
Michigan:
2.4 people
Averages for the 2020 tax year for zip code 48122, filed in 2021:
Average Adjusted Gross Income (AGI) in 2020: $36,361 (Individual Income Tax Returns)
Here:
$36,361
State:
$68,945
Salary/wage: $34,512 (reported on 75.1% of returns)
Here:
$34,512
State:
$57,142
(% of AGI for various income ranges: 872.3% for AGIs below $25k, 3102.4% for AGIs $25k-50k, 5997.6% for AGIs $50k-75k, 9626.2% for AGIs $75k-100k, 17326.2% for AGIs $100k-200k)
Taxable interest for individuals: $585 (reported on 15.5% of returns)
This zip code:
$585
Michigan:
$1,630
(% of AGI for various income ranges: 7.5% for AGIs below $25k, 6.7% for AGIs $25k-50k, 14.5% for AGIs $50k-75k, 23.8% for AGIs $75k-100k, 96.2% for AGIs $100k-200k)
Ordinary dividends: $1,768 (reported on 5.6% of returns)
Here:
$1,768
State:
$6,972
(% of AGI for various income ranges: 4.4% for AGIs below $25k, 6.1% for AGIs $25k-50k, 26.2% for AGIs $50k-75k, 52.7% for AGIs $75k-100k, 69.2% for AGIs $100k-200k)
Net capital gain/loss in AGI: +$2,071 (reported on 5.6% of returns)
Here:
+$2,071
State:
+$20,064
(% of AGI for various income ranges: 3.4% for AGIs below $25k, 3.6% for AGIs $25k-50k, 17.6% for AGIs $50k-75k, 55.4% for AGIs $75k-100k, 217.7% for AGIs $100k-200k)
Profit/loss from business: +$5,528 (reported on 18.2% of returns)
Here:
+$5,528
State:
+$11,172
(% of AGI for various income ranges: 160.5% for AGIs below $25k, 154.2% for AGIs $25k-50k, 54.3% for AGIs $50k-75k, 31.2% for AGIs $75k-100k, 50.0% for AGIs $100k-200k)
Taxable individual retirement arrangement distribution: $10,777 (reported on 4.0% of returns)
48122:
$10,777
Michigan:
$19,803
(% of AGI for various income ranges: 26.8% for AGIs below $25k, 28.9% for AGIs $25k-50k, 102.4% for AGIs $50k-75k, 336.2% for AGIs $75k-100k)
Total itemized deductions: $22,375 (reported on 1.4% of returns)
Here:
$22,375
State:
$34,117
(% of AGI for various income ranges: 33.4% for AGIs below $25k, 124.3% for AGIs $50k-75k, 370.8% for AGIs $100k-200k)
Charity contributions: $6,157 (reported on 1.3% of returns)
Here:
$6,157
State:
$13,548
(% of AGI for various income ranges: 5.0% for AGIs below $25k, 31.4% for AGIs $50k-75k, 123.8% for AGIs $100k-200k)
Taxes paid: $5,712 (reported on 1.4% of returns)
48122:
$5,712
State:
$7,972
(% of AGI for various income ranges: 6.7% for AGIs below $25k, 27.2% for AGIs $50k-75k, 139.2% for AGIs $100k-200k)
Earned income credit: $2,742 (reported on 28.5% of returns)
Here:
$2,742
State:
$2,251
(% of AGI for various income ranges: 131.6% for AGIs below $25k, 133.0% for AGIs $25k-50k, 5.9% for AGIs $50k-75k)
Percentage of individuals using paid preparers for their 2020 taxes: 92.4%
Here:
92%
State:
93%
(% for various income ranges: 91.5% for AGIs below $25k, 92.7% for AGIs $25k-50k, 93.2% for AGIs $50k-75k, 94.1% for AGIs $75k-100k, 95.0% for AGIs $100k-200k, 100.0% for AGIs over 200k)
Averages for the 2012 tax year for zip code 48122, filed in 2013:
Average Adjusted Gross Income (AGI) in 2012: $32,661 (Individual Income Tax Returns)
Here:
$32,661
State:
$55,609
Salary/wage: $30,610 (reported on 82.1% of returns)
Here:
$30,610
State:
$46,782
(% of AGI for various income ranges: 67.0% for AGIs below $25k, 78.8% for AGIs $25k-50k, 81.6% for AGIs $50k-75k, 85.8% for AGIs $75k-100k, 70.9% for AGIs $100k-200k)
Taxable interest for individuals: $796 (reported on 20.0% of returns)
This zip code:
$796
Michigan:
$1,491
(% of AGI for various income ranges: 0.6% for AGIs below $25k, 0.4% for AGIs $25k-50k, 0.8% for AGIs $50k-75k, 0.2% for AGIs $75k-100k, 0.3% for AGIs $100k-200k)
Ordinary dividends: $1,594 (reported on 7.3% of returns)
Here:
$1,594
State:
$6,225
(% of AGI for various income ranges: 0.5% for AGIs below $25k, 0.3% for AGIs $25k-50k, 0.4% for AGIs $50k-75k, 0.1% for AGIs $75k-100k, 0.3% for AGIs $100k-200k)
Net capital gain/loss in AGI: +$1,776 (reported on 4.4% of returns)
Here:
+$1,776
State:
+$9,326
(% of AGI for various income ranges: 2.1% for AGIs $75k-100k)
Profit/loss from business: +$7,584 (reported on 11.6% of returns)
Here:
+$7,584
State:
+$11,523
(% of AGI for various income ranges: 10.6% for AGIs below $25k, 1.3% for AGIs $25k-50k, 0.7% for AGIs $50k-75k, 0.7% for AGIs $75k-100k)
Taxable individual retirement arrangement distribution: $9,519 (reported on 6.7% of returns)
48122:
$9,519
Michigan:
$15,298
(% of AGI for various income ranges: 2.0% for AGIs below $25k, 1.4% for AGIs $25k-50k, 2.1% for AGIs $50k-75k, 4.8% for AGIs $75k-100k)
Total itemized deductions: $14,278 (24% of AGI, reported on 16.0% of returns)
Here:
$14,278
State:
$21,628
Here:
24.1% of AGI
State:
18.4% of AGI
(% of AGI for various income ranges: 4.7% for AGIs below $25k, 6.2% for AGIs $25k-50k, 8.3% for AGIs $50k-75k, 7.6% for AGIs $75k-100k, 9.4% for AGIs $100k-200k)
Charity contributions: $2,556 (reported on 12.3% of returns)
Here:
$2,556
State:
$4,225
(% of AGI for various income ranges: 0.4% for AGIs below $25k, 0.9% for AGIs $25k-50k, 1.3% for AGIs $50k-75k, 1.2% for AGIs $75k-100k, 1.1% for AGIs $100k-200k)
Taxes paid: $4,377 (reported on 16.0% of returns)
48122:
$4,377
State:
$8,327
(% of AGI for various income ranges: 0.9% for AGIs below $25k, 1.5% for AGIs $25k-50k, 2.6% for AGIs $50k-75k, 2.9% for AGIs $75k-100k, 3.8% for AGIs $100k-200k)
Earned income credit: $2,525 (reported on 29.7% of returns)
Here:
$2,525
State:
$2,306
(% of AGI for various income ranges: 9.4% for AGIs below $25k, 1.5% for AGIs $25k-50k)
Percentage of individuals using paid preparers for their 2012 taxes: 61.5%
Here:
62%
State:
57%
(% for various income ranges: 60.2% for AGIs below $25k, 62.4% for AGIs $25k-50k, 62.1% for AGIs $50k-75k, 66.7% for AGIs $75k-100k, 66.7% for AGIs $100k-200k)
Averages for the 2004 tax year for zip code 48122, filed in 2005:
Average Adjusted Gross Income (AGI) in 2004: $33,620 (Individual Income Tax Returns)
Here:
$33,620
State:
$48,204
Salary/wage: $32,815 (reported on 85.1% of returns)
Here:
$32,815
State:
$42,791
(% of AGI for various income ranges: 66.6% for AGIs below $10k, 71.0% for AGIs $10k-25k, 84.1% for AGIs $25k-50k, 87.6% for AGIs $50k-75k, 87.0% for AGIs $75k-100k, 82.6% for AGIs over 100k)
Taxable interest for individuals: $1,012 (reported on 34.7% of returns)
This zip code:
$1,012
Michigan:
$1,725
(% of AGI for various income ranges: 4.1% for AGIs below $10k, 2.1% for AGIs $10k-25k, 0.9% for AGIs $25k-50k, 0.6% for AGIs $50k-75k, 0.6% for AGIs $75k-100k, 1.0% for AGIs over 100k)
Taxable dividends: $1,360 (reported on 13.3% of returns)
Here:
$1,360
State:
$3,420
(% of AGI for various income ranges: 2.3% for AGIs below $10k, 0.7% for AGIs $10k-25k, 0.5% for AGIs $25k-50k, 0.4% for AGIs $50k-75k, 0.4% for AGIs $75k-100k, 0.6% for AGIs over 100k)
Net capital gain/loss: +$2,274 (reported on 7.7% of returns)
Here:
+$2,274
State:
+$8,532
(% of AGI for various income ranges: -0.7% for AGIs below $10k, 0.1% for AGIs $10k-25k, 0.0% for AGIs $25k-50k, 0.5% for AGIs $50k-75k, 0.8% for AGIs $75k-100k, 2.7% for AGIs over 100k)
Profit/loss from business: +$5,850 (reported on 7.4% of returns)
Here:
+$5,850
State:
+$9,547
(% of AGI for various income ranges: 6.7% for AGIs below $10k, 3.6% for AGIs $10k-25k, 0.9% for AGIs $25k-50k, 1.2% for AGIs $50k-75k, -0.0% for AGIs $75k-100k)
IRA payment deduction: $1,836 (reported on 1.1% of returns)
48122:
$1,836
Michigan:
$2,875
Total itemized deductions: $12,697 (24% of AGI, reported on 30.6% of returns)
Here:
$12,697
State:
$18,509
Here:
23.6% of AGI
State:
20.7% of AGI
(% of AGI for various income ranges: 8.5% for AGIs below $10k, 8.2% for AGIs $10k-25k, 12.5% for AGIs $25k-50k, 11.8% for AGIs $50k-75k, 12.9% for AGIs $75k-100k, 11.3% for AGIs over 100k)
Charity contributions deductions: $1,957 (3% of AGI, reported on 25.6% of returns)
Here:
$1,957
State:
$3,365
Here:
3.5% of AGI
State:
3.6% of AGI
(% of AGI for various income ranges: 0.3% for AGIs below $10k, 0.9% for AGIs $10k-25k, 1.6% for AGIs $25k-50k, 1.4% for AGIs $50k-75k, 2.0% for AGIs $75k-100k, 1.7% for AGIs over 100k)
Total tax: $3,921 (reported on 71.1% of returns)
48122:
$3,921
State:
$7,691
(% of AGI for various income ranges: 1.5% for AGIs below $10k, 3.6% for AGIs $10k-25k, 6.6% for AGIs $25k-50k, 9.1% for AGIs $50k-75k, 11.2% for AGIs $75k-100k, 15.5% for AGIs over 100k)
Earned income credit: $1,743 (reported on 18.2% of returns)
Here:
$1,743
State:
$1,737
Percentage of individuals using paid preparers for their 2004 taxes: 64.6%
Here:
65%
State:
60%
(% for various income ranges: 60.1% for AGIs below $10k, 64.5% for AGIs $10k-25k, 66.2% for AGIs $25k-50k, 67.1% for AGIs $50k-75k, 63.1% for AGIs $75k-100k, 72.0% for AGIs over 100k)
Household received Food Stamps/SNAP in the past 12 months: 1,270 Household did not receive Food Stamps/SNAP in the past 12 months: 3,275
Women who had a birth in the past 12 months: 476 (312 now married, 163 unmarried) Women who did not have a birth in the past 12 months: 2,088 (732 now married, 1,357 unmarried)
Housing units in zip code 48122 with a mortgage: 1,182 (71 second mortgage, 55 both second mortgage and home equity loan) Median monthly owner costs for units with a mortgage: $1,125 Median monthly owner costs for units without a mortgage: $493
Residents with income below the poverty level in 2022:
This zip code:
33.4%
Whole state:
13.4%
Residents with income below 50% of the poverty level in 2022:
This zip code:
21.7%
Whole state:
6.9%
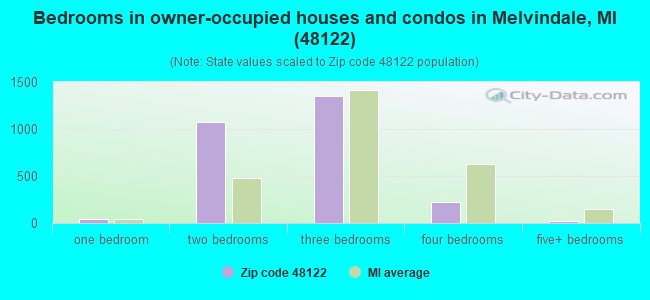
Median number of rooms in houses and condos:
Here:
5.4
State:
6.5
Median number of rooms in apartments:
Here:
4.1
State:
4.3
Notable locations in this zip code not listed on our city pages
Notable locations in zip code 48122: Melvindale City Hall (A), Melvindale Fire Department (B), Melvindale Library (C), Melvindale Police Station (D). Display/hide their locations on the map
Parks in zip code 48122 include: Coogan Park (1), De Luca Field (2), Reves-Wilhelm Cemetery Historical Marker (3), Lankford Park (4), McGinty Playground (5). Display/hide their locations on the map
Size of family households: 734 2-persons, 398 3-persons, 554 4-persons, 397 5-persons, 129 6-persons, 248 7-or-more-persons
Size of nonfamily households: 1,640 1-person, 389 2-persons
2,488 married couples with children.
963 single-parent households (963 women).
57.9% of residents of 48122 zip code speak English at home.
19.4% of residents speak Spanish at home (64% very well, 9% well, 26% not well).
0.5% of residents speak other Indo-European language at home (87% very well, 13% well).
0.2% of residents speak Asian or Pacific Island language at home (100% very well).
23.4% of residents speak other language at home (49% very well, 19% well, 24% not well, 8% not at all).
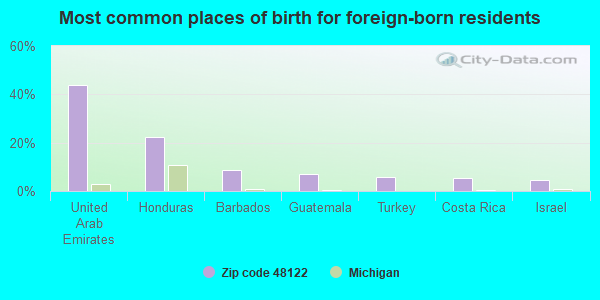
Foreign born population: 2,417 (19.2%) (57.5% of them are naturalized citizens)
This zip code:
19.2%
Whole state:
6.9%
44%United Arab Emirates
22%Honduras
9%Barbados
7%Guatemala
6%Turkey
5%Costa Rica
5%Israel
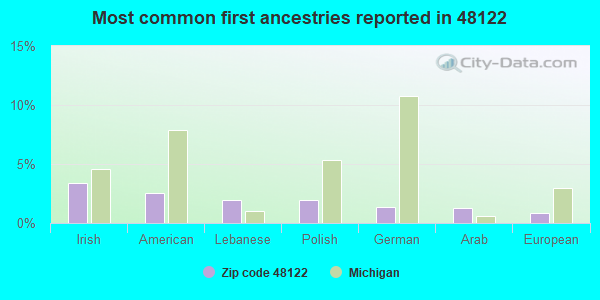
3%Irish
3%American
2%Lebanese
2%Polish
1%German
1%Arab
1%European
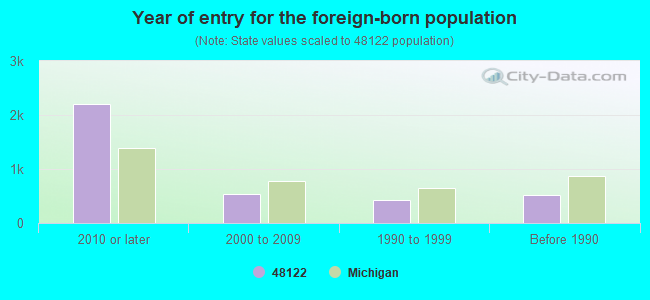
Year of entry for the foreign-born population
2,1972010 or later
5282000 to 2009
4191990 to 1999
523Before 1990
Major facilities with environmental interests located in this zip code:
MELVINDALE HIGH SCHOOL (18656 PROSPECT STREET in MELVINDALE, MI)
(National Center for Education Statistics) - STATE ID-02507 Organizations: MELVINDALE-NORTH ALLEN PARK SCHOOLS (SCHOOL DISTRICT)
ATI WAREHOUSE INC (25445 W OUTER DR in MELVINDALE, MI)
(Resource Conservation and Recovery Act (tracking hazardous waste)) Business NAICS classification: PAPER (EXCEPT NEWSPRINT) MILLS. Organizations: SHRADER TIRE & OIL OF MICHIGAN INC (CONTACT/OPERATOR)
Alternative names: STONE CONTAINER CORP
MELVIN ROYAL TRANSMISSION (19505 ALLEN RD in MELVINDALE, MI)
(Resource Conservation and Recovery Act (tracking hazardous waste)) Organizations: WINSTON LITTLE (CONTACT/OPERATOR)
EMPIRE SPECIALTY TOOLS (19000 MEGINNITY in MELVINDALE, MI)
(Resource Conservation and Recovery Act (tracking hazardous waste)) Business NAICS classification: MACHINE TOOL (METAL CUTTING TYPES) MANUFACTURING.; CUTTING TOOL AND MACHINE TOOL ACCESSORY MANUFACTURING. Organizations: JON C WHITEMAN (CONTACT/OPERATOR)
EXPRESS AUTO (17420 DIX in MELVINDALE, MI)
(Resource Conservation and Recovery Act (tracking hazardous waste))
ARTS BODY SHOP INC (18801 DIX TOLEDO HWY in MELVINDALE, MI)
(Resource Conservation and Recovery Act (tracking hazardous waste))
AUTOCRAFT AUTO BODY (4241 OAKWOOD BLVD in MELVINDALE, MI)
(Resource Conservation and Recovery Act (tracking hazardous waste))
MELVINDALE COLLISION INC (18550 DIX in MELVINDALE, MI)
(Resource Conservation and Recovery Act (tracking hazardous waste))
MELVINDALE-SWMA (3100 OAKWOOD BLVD in MELVINDALE, MI)
National Pollutant Discharge Elimination System NON-MAJOR (Tracking pollutant discharge elimination systems) - permit Alternative names: CITY OF MELVINDALE
MI DEPT/STATE POLICE (2388 CORBIN in MELVINDALE, MI)
(Resource Conservation and Recovery Act (tracking hazardous waste)) Alternative names: MI DEPT/STATE POLICE (E)
B AND K COLLISION INC (2521 OAKWOOD BLVD in MELVINDALE, MI)
Small Quantity Generators, between 100 kg and 1000 kg of hazardous waste/month (Resource Conservation and Recovery Act (tracking hazardous waste)) - notification Business NAICS classification: AUTOMOTIVE BODY, PAINT, AND INTERIOR REPAIR AND MAINTENANCE. Organizations: MICHAEL BRENNAN (CONTACT/OPERATOR)
MELVINDALE CITY OF DPW (3315 GREENFIELD in MELVINDALE, MI)
Conditionally Exempt Small Quantity Generators, less than 100 kg/month of hazardous waste (Resource Conservation and Recovery Act (tracking hazardous waste))
FOUR WAY COLLISION INC (19125 DIX TOLEDO HWY in MELVINDALE, MI)
Conditionally Exempt Small Quantity Generators, less than 100 kg/month of hazardous waste (Resource Conservation and Recovery Act (tracking hazardous waste)) Organizations: JOSEPH SAEZ (CONTACT/OPERATOR)
Housing units lacking complete plumbing facilities: 1.2% Housing units lacking complete kitchen facilities: 0.8%
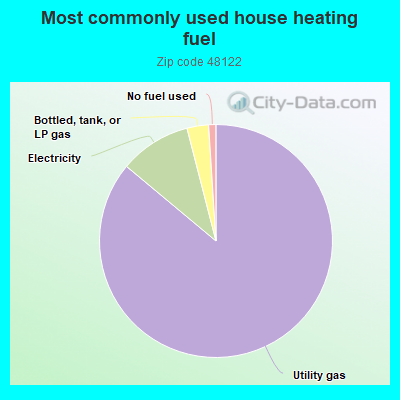
85.9%Utility gas
9.9%Electricity
3.0%Bottled, tank, or LP gas
1.0%No fuel used
Population in 1990: 11,226.
Place of birth for U.S.-born residents:
This state: 8,037
Northeast: 109
Midwest: 83
South: 701
West: 129
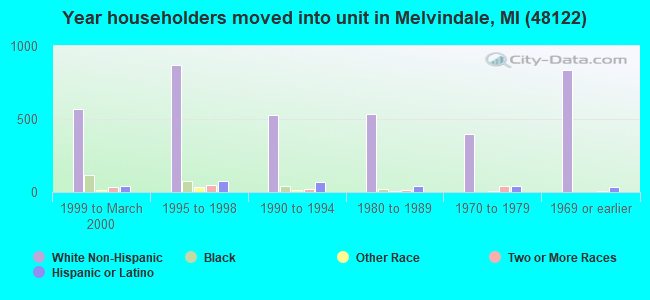
64% of the 48122 zip code residents lived in the same house 5 years ago. Out of people who lived in different houses, 91% lived in this county. Out of people who lived in different counties, 50% lived in Michigan.
90% of the 48122 zip code residents lived in the same house 1 year ago. Out of people who lived in different houses, 81% moved from this county. Out of people who lived in different houses, 4% moved from different county within same state. Out of people who lived in different houses, 7% moved from different state. Out of people who lived in different houses, 5% moved from abroad.
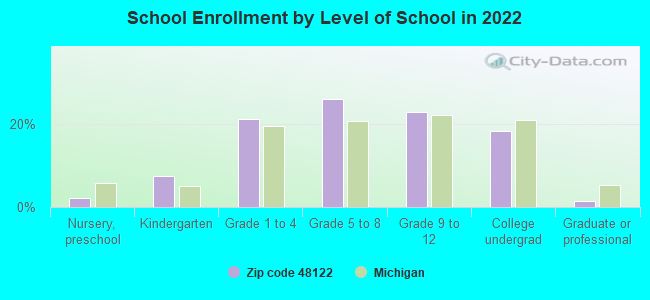
Private vs. public school enrollment:
Students in private schools in grades 1 to 8 (elementary and middle school): 154
Here:
9.7%
Michigan:
12.4%
Students in private schools in grades 9 to 12 (high school): 101
Here:
12.9%
Michigan:
9.8%
Students in private undergraduate colleges:
Here:
0.0%
Michigan:
14.9%
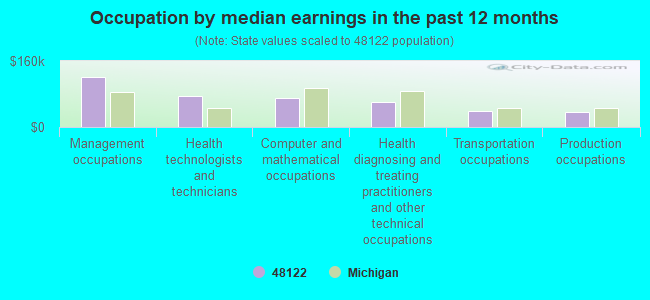
Occupation by median earnings in the past 12 months ($)
121,033Management occupations
75,401Health technologists and technicians
69,523Computer and mathematical occupations
61,718Health diagnosing and treating practitioners and other technical occupations
38,299Transportation occupations
36,752Production occupations
Companies with federal contracts located in this zip code:
ONODI TOOL & ENGINEERING CO (19150 MEGINNITY ST in MELVINDALE, MI; small business) : $14,662,735 in 357 contractsfrom 1999 to 2006
Contracts for Miscellaneous Vehicular Components, Vehicular Brake, Steering, Axle, Wheel, and Track Components, Relays and Solenoids, Engine Fuel System Components, Nonaircraft, and moreby Army, Defense Logistics Agency, Navy Signed by year:2000: $631,892; 2001: $2,805,765; 2002: $913,803; 2003: $2,396,634; 2004: $2,414,600; 2005: $3,135,795; 2006: $2,095,047.
Biggest contracts:
$1,050,000 with Army for Miscellaneous Vehicular Components. Signed on 2006-01-30. Completion date: 2011-01-30.
$617,684, same as above.Signed on 2003-10-06. Completion date: 2003-12-31.
$517,916 with Army for Vehicular Brake, Steering, Axle, Wheel, and Track Components. Signed on 2005-03-30. Completion date: 2006-06-27.
$431,398 with Army for Miscellaneous Vehicular Components. Signed on 2001-09-27. Completion date: 2002-12-30.
KLOCHKO EQUIPMENT RENTAL COMPA (2782 CORBIN ST in MELVINDALE, MI) : $1,984 in 2 contractsin 2004
$992 with U.S. Army Corps of Engineers - civil program financing only for Tractors, Full Tracked, Low Speed. Signed on 2004-11-24. Completion date: 2004-08-06.
$992 with Army for Tractors, Full Tracked, Low Speed. Signed on 2004-11-24. Completion date: 2004-08-06.
Top industries in this zip code by the number of employees in 2005:
Utilities: Natural Gas Distribution (250-499 employees: 1 establishment, 50-99 employees: 1 establishment, 10-19 employees: 1 establishment)
Professional, Scientific, and Technical Services: Engineering Services (100-249: 1)
Other Services (except Public Administration): Commercial and Industrial Machinery and Equipment (except Automotive and Electronic) Repair and Maintenance (20-49: 1, 10-19: 4, 1-4: 2)
Construction: Other Heavy and Civil Engineering Construction (50-99: 1, 1-4: 1)
Management of Companies and Enterprises: Corporate, Subsidiary, and Regional Managing Offices (50-99: 1)
People in group quarters in 2000:
20 people in homes for the mentally ill
4 people in homes or halfway houses for drug/alcohol abuse
3 people in other group homes
2 people in local jails and other confinement facilities (including police lockups)
Fatal accident statistics in 2010:
Fatal accident count: 1
Vehicles involved in fatal accidents: 2
Fatal accidents caused by drunken drivers: 0
Fatalities: 1
Persons involved in fatal accidents: 3
Pedestrians involved in fatal accidents: 0
Home Mortgage Disclosure Act Aggregated Statistics For Year 2009 (Based on 4 full tracts)
A) FHA, FSA/RHS & VA Home Purchase Loans
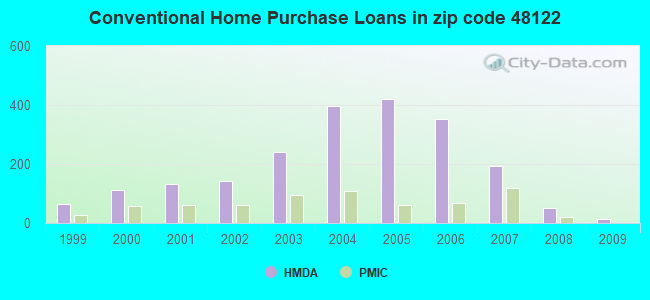
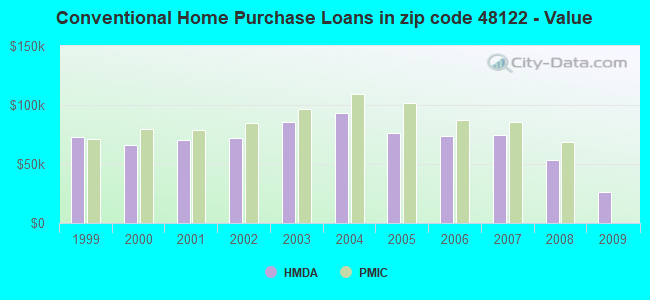
B) Conventional Home Purchase Loans
C) Refinancings
D) Home Improvement Loans
F) Non-occupant Loans on < 5 Family Dwellings (A B C & D)
G) Loans On Manufactured Home Dwelling (A B C & D)
Number
Average Value
Number
Average Value
Number
Average Value
Number
Average Value
Number
Average Value
Number
Average Value
LOANS ORIGINATED
53
$48,312
14
$26,484
71
$78,722
4
$20,432
10
$29,449
0
$0
APPLICATIONS APPROVED, NOT ACCEPTED
2
$28,145
0
$0
14
$58,436
2
$7,965
0
$0
0
$0
APPLICATIONS DENIED
26
$52,057
24
$48,055
73
$75,356
28
$12,328
12
$50,060
2
$47,560
APPLICATIONS WITHDRAWN
6
$66,000
8
$34,254
35
$75,358
0
$0
0
$0
0
$0
FILES CLOSED FOR INCOMPLETENESS
2
$32,030
0
$0
6
$96,413
0
$0
2
$58,235
0
$0
Aggregated Statistics For Year 2008 (Based on 4 full tracts)
A) FHA, FSA/RHS & VA Home Purchase Loans
B) Conventional Home Purchase Loans
C) Refinancings
D) Home Improvement Loans
E) Loans on Dwellings For 5+ Families
F) Non-occupant Loans on < 5 Family Dwellings (A B C & D)
G) Loans On Manufactured Home Dwelling (A B C & D)
Number
Average Value
Number
Average Value
Number
Average Value
Number
Average Value
Number
Average Value
Number
Average Value
Number
Average Value
LOANS ORIGINATED
73
$65,234
51
$53,552
102
$83,604
43
$25,638
2
$407,650
37
$58,903
4
$24,892
APPLICATIONS APPROVED, NOT ACCEPTED
6
$78,145
10
$82,267
14
$90,784
2
$82,500
0
$0
8
$85,362
2
$69,885
APPLICATIONS DENIED
18
$75,074
38
$47,812
163
$94,421
63
$27,040
2
$807,540
30
$72,525
8
$45,160
APPLICATIONS WITHDRAWN
14
$123,675
14
$61,224
63
$88,324
4
$29,118
0
$0
14
$60,216
0
$0
FILES CLOSED FOR INCOMPLETENESS
0
$0
12
$87,577
20
$81,987
2
$14,560
0
$0
8
$81,772
0
$0
Aggregated Statistics For Year 2007 (Based on 4 full tracts)
A) FHA, FSA/RHS & VA Home Purchase Loans
B) Conventional Home Purchase Loans
C) Refinancings
D) Home Improvement Loans
E) Loans on Dwellings For 5+ Families
F) Non-occupant Loans on < 5 Family Dwellings (A B C & D)
G) Loans On Manufactured Home Dwelling (A B C & D)
Number
Average Value
Number
Average Value
Number
Average Value
Number
Average Value
Number
Average Value
Number
Average Value
Number
Average Value
LOANS ORIGINATED
29
$98,681
193
$74,213
269
$82,410
39
$34,563
0
$0
71
$66,379
2
$15,530
APPLICATIONS APPROVED, NOT ACCEPTED
0
$0
51
$75,553
81
$93,928
6
$14,147
0
$0
8
$78,081
6
$35,898
APPLICATIONS DENIED
10
$94,605
118
$77,576
418
$88,683
82
$21,865
2
$143,380
47
$62,961
2
$28,875
APPLICATIONS WITHDRAWN
10
$63,526
37
$84,397
134
$101,196
4
$63,372
0
$0
14
$63,831
0
$0
FILES CLOSED FOR INCOMPLETENESS
0
$0
6
$75,115
39
$107,277
4
$25,235
0
$0
4
$84,828
0
$0
Aggregated Statistics For Year 2006 (Based on 4 full tracts)
A) FHA, FSA/RHS & VA Home Purchase Loans
B) Conventional Home Purchase Loans
C) Refinancings
D) Home Improvement Loans
F) Non-occupant Loans on < 5 Family Dwellings (A B C & D)
G) Loans On Manufactured Home Dwelling (A B C & D)
Number
Average Value
Number
Average Value
Number
Average Value
Number
Average Value
Number
Average Value
Number
Average Value
LOANS ORIGINATED
49
$89,158
352
$74,122
469
$78,508
71
$20,095
114
$66,231
0
$0
APPLICATIONS APPROVED, NOT ACCEPTED
2
$109,680
79
$76,251
120
$86,275
8
$27,639
28
$81,141
0
$0
APPLICATIONS DENIED
14
$97,813
171
$72,039
624
$91,704
91
$32,626
61
$65,523
4
$27,662
APPLICATIONS WITHDRAWN
2
$74,735
84
$63,482
245
$96,385
10
$68,071
16
$62,638
0
$0
FILES CLOSED FOR INCOMPLETENESS
2
$114,530
16
$78,417
98
$94,100
6
$68,313
4
$113,548
0
$0
Aggregated Statistics For Year 2005 (Based on 4 full tracts)
A) FHA, FSA/RHS & VA Home Purchase Loans
B) Conventional Home Purchase Loans
C) Refinancings
D) Home Improvement Loans
E) Loans on Dwellings For 5+ Families
F) Non-occupant Loans on < 5 Family Dwellings (A B C & D)
G) Loans On Manufactured Home Dwelling (A B C & D)
Number
Average Value
Number
Average Value
Number
Average Value
Number
Average Value
Number
Average Value
Number
Average Value
Number
Average Value
LOANS ORIGINATED
57
$99,995
420
$76,598
712
$81,179
96
$25,671
6
$321,592
139
$71,820
0
$0
APPLICATIONS APPROVED, NOT ACCEPTED
4
$76,678
116
$70,861
173
$79,113
14
$43,759
0
$0
20
$66,029
4
$39,795
APPLICATIONS DENIED
8
$95,180
198
$77,132
644
$90,909
114
$28,264
0
$0
42
$63,074
18
$64,961
APPLICATIONS WITHDRAWN
2
$88,615
85
$90,171
315
$107,853
31
$97,422
0
$0
30
$70,755
4
$120,840
FILES CLOSED FOR INCOMPLETENESS
2
$119,485
29
$80,990
179
$94,913
6
$49,177
0
$0
4
$92,042
0
$0
Aggregated Statistics For Year 2004 (Based on 4 full tracts)
A) FHA, FSA/RHS & VA Home Purchase Loans
B) Conventional Home Purchase Loans
C) Refinancings
D) Home Improvement Loans
E) Loans on Dwellings For 5+ Families
F) Non-occupant Loans on < 5 Family Dwellings (A B C & D)
G) Loans On Manufactured Home Dwelling (A B C & D)
Number
Average Value
Number
Average Value
Number
Average Value
Number
Average Value
Number
Average Value
Number
Average Value
Number
Average Value
LOANS ORIGINATED
77
$96,161
397
$93,317
699
$82,801
100
$41,795
2
$236,825
63
$68,075
2
$138,400
APPLICATIONS APPROVED, NOT ACCEPTED
4
$98,030
63
$91,097
165
$86,325
8
$38,621
2
$252,355
16
$71,162
0
$0
APPLICATIONS DENIED
24
$114,487
92
$85,345
512
$84,304
65
$20,442
2
$252,355
32
$60,239
24
$36,646
APPLICATIONS WITHDRAWN
6
$109,488
31
$80,418
381
$87,961
14
$59,421
0
$0
12
$72,782
0
$0
FILES CLOSED FOR INCOMPLETENESS
0
$0
12
$87,491
75
$91,830
8
$43,132
0
$0
6
$54,208
0
$0
Aggregated Statistics For Year 2003 (Based on 4 full tracts)
A) FHA, FSA/RHS & VA Home Purchase Loans
B) Conventional Home Purchase Loans
C) Refinancings
D) Home Improvement Loans
E) Loans on Dwellings For 5+ Families
F) Non-occupant Loans on < 5 Family Dwellings (A B C & D)
Number
Average Value
Number
Average Value
Number
Average Value
Number
Average Value
Number
Average Value
Number
Average Value
LOANS ORIGINATED
116
$95,629
242
$85,480
1,198
$75,258
59
$19,833
8
$280,504
102
$63,618
APPLICATIONS APPROVED, NOT ACCEPTED
10
$91,708
47
$78,890
141
$77,092
4
$47,295
0
$0
14
$62,071
APPLICATIONS DENIED
10
$109,997
88
$78,657
472
$75,636
75
$12,981
0
$0
14
$54,792
APPLICATIONS WITHDRAWN
10
$81,068
20
$90,302
230
$82,521
4
$29,870
0
$0
12
$77,098
FILES CLOSED FOR INCOMPLETENESS
4
$89,295
10
$97,950
89
$85,538
0
$0
0
$0
0
$0
Aggregated Statistics For Year 2002 (Based on 4 full tracts)
A) FHA, FSA/RHS & VA Home Purchase Loans
B) Conventional Home Purchase Loans
C) Refinancings
D) Home Improvement Loans
E) Loans on Dwellings For 5+ Families
F) Non-occupant Loans on < 5 Family Dwellings (A B C & D)
Number
Average Value
Number
Average Value
Number
Average Value
Number
Average Value
Number
Average Value
Number
Average Value
LOANS ORIGINATED
167
$87,876
142
$72,305
776
$74,747
71
$11,215
2
$194,120
67
$61,393
APPLICATIONS APPROVED, NOT ACCEPTED
6
$92,843
29
$70,788
149
$80,028
24
$11,667
0
$0
4
$99,488
APPLICATIONS DENIED
12
$93,465
49
$73,625
296
$63,742
116
$9,541
0
$0
12
$72,011
APPLICATIONS WITHDRAWN
8
$78,274
21
$73,626
206
$70,775
6
$34,185
2
$199,140
6
$60,825
FILES CLOSED FOR INCOMPLETENESS
2
$49,785
14
$91,599
59
$74,778
2
$14,560
0
$0
0
$0
Aggregated Statistics For Year 2001 (Based on 4 full tracts)
A) FHA, FSA/RHS & VA Home Purchase Loans
B) Conventional Home Purchase Loans
C) Refinancings
D) Home Improvement Loans
E) Loans on Dwellings For 5+ Families
F) Non-occupant Loans on < 5 Family Dwellings (A B C & D)
Number
Average Value
Number
Average Value
Number
Average Value
Number
Average Value
Number
Average Value
Number
Average Value
LOANS ORIGINATED
179
$87,119
132
$70,577
805
$69,615
136
$9,114
2
$291,180
49
$49,584
APPLICATIONS APPROVED, NOT ACCEPTED
6
$83,307
22
$67,231
100
$65,313
30
$9,575
0
$0
10
$40,195
APPLICATIONS DENIED
20
$73,251
67
$52,997
342
$60,240
138
$12,596
0
$0
25
$53,854
APPLICATIONS WITHDRAWN
10
$84,624
20
$67,937
240
$71,397
18
$27,828
0
$0
6
$68,040
FILES CLOSED FOR INCOMPLETENESS
8
$84,866
4
$79,655
85
$69,590
0
$0
0
$0
0
$0
Aggregated Statistics For Year 2000 (Based on 4 full tracts)
A) FHA, FSA/RHS & VA Home Purchase Loans
B) Conventional Home Purchase Loans
C) Refinancings
D) Home Improvement Loans
F) Non-occupant Loans on < 5 Family Dwellings (A B C & D)
Number
Average Value
Number
Average Value
Number
Average Value
Number
Average Value
Number
Average Value
LOANS ORIGINATED
148
$79,591
112
$66,257
348
$56,569
149
$12,385
35
$52,830
APPLICATIONS APPROVED, NOT ACCEPTED
8
$80,089
22
$66,199
79
$54,563
47
$13,875
0
$0
APPLICATIONS DENIED
16
$75,069
51
$42,831
228
$55,611
161
$11,574
14
$85,557
APPLICATIONS WITHDRAWN
6
$70,313
20
$67,802
135
$55,118
20
$38,803
4
$40,182
FILES CLOSED FOR INCOMPLETENESS
0
$0
2
$25,890
43
$57,207
2
$9,955
0
$0
Aggregated Statistics For Year 1999 (Based on 2 full tracts)
A) FHA, FSA/RHS & VA Home Purchase Loans
B) Conventional Home Purchase Loans
C) Refinancings
D) Home Improvement Loans
E) Loans on Dwellings For 5+ Families
F) Non-occupant Loans on < 5 Family Dwellings (A B C & D)
Detailed PMIC statistics for the following Tracts:5785.00
, 5786.00
2002 - 2018 National Fire Incident Reporting System (NFIRS) incidents
Based on the data from the years 2002 - 2018 the average number of fires per year is 35. The highest number of reported fire incidents - 52 took place in 2003, and the least - 9 in 2013. The data has a declining trend.
When looking into fire subcategories, the most incidents belonged to: Structure Fires (38.8%), and Outside Fires (35.8%).
Fire incident types reported to NFIRS in Zip Code 48122


 Nearest zip codes: 48217, 48120, 48101, 48146, 48126, 48229.


 Based on the data from the years 2002 - 2018 the average number of fires per year is 35. The highest number of reported fire incidents - 52 took place in 2003, and the least - 9 in 2013. The data has a declining trend.
 When looking into fire subcategories, the most incidents belonged to: Structure Fires (38.8%), and Outside Fires (35.8%).