Estimated zip code population in 2022: 9,266
Zip code population in 2010: 9,556
Zip code population in 2000: 11,088
Houses and condos: 4,146
Renter-occupied apartments: 1,218
% of renters here:
35%State:
27%
March 2022 cost of living index in zip code 48229: 92.7
(less than average, U.S. average is 100)
Land area: 2.8
sq. mi.
Water area: 0.0
sq. mi.
Population density: 3,286 people per square mile (average).
OSM Map
General Map
Google Map
MSN Map
OSM Map
General Map
Google Map
MSN Map
OSM Map
General Map
Google Map
MSN Map
OSM Map
General Map
Google Map
MSN Map
Please wait while loading the map...
Real estate property taxes paid for housing units in 2022:
This zip code:
2.9% ($1,668)Michigan:
1.2% ($2,746)
Median real estate property taxes paid for housing units with mortgages in 2022: $1,738 (2.4%)
Median real estate property taxes paid for housing units with no mortgage in 2022: $1,620 (2.8%)
Business Search - 14 Million verified businesses
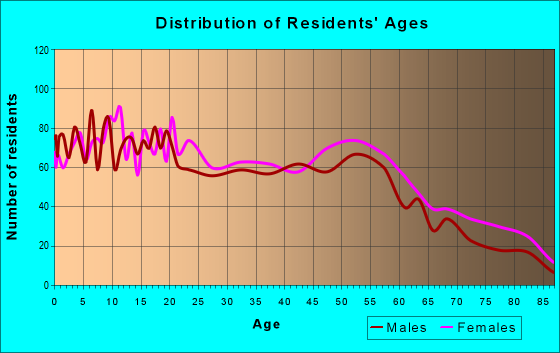
Males: 4,350 Females: 4,916
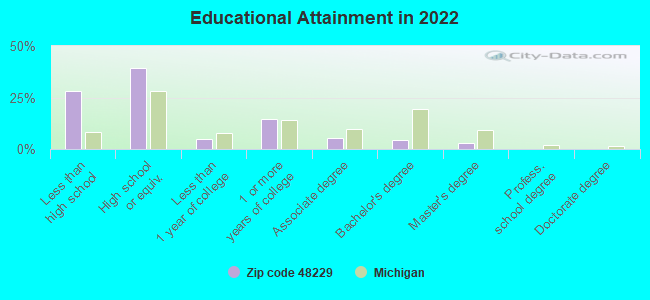
For population 25 years and over in 48229:
High school or higher: 70.8%Bachelor's degree or higher: 7.4%Graduate or professional degree: 3.0%Unemployed: 8.0%Mean travel time to work (commute): 24.4 minutes
For population 15 years and over in 48229:
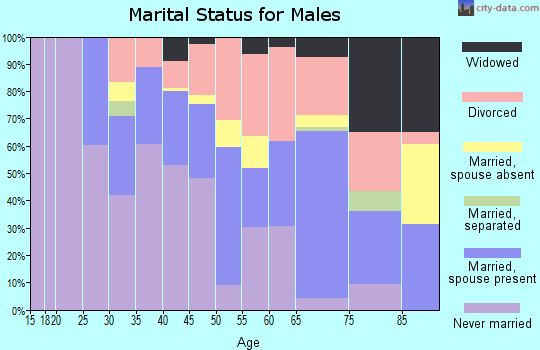
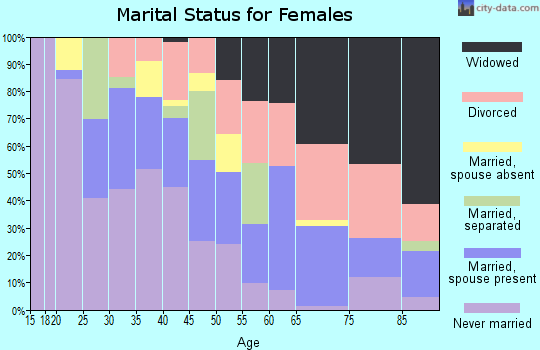
Never married: 47.7%Now married: 25.1%Separated: 2.7%Widowed: 8.1%Divorced: 16.4%
Zip code 48229 compared to state average:
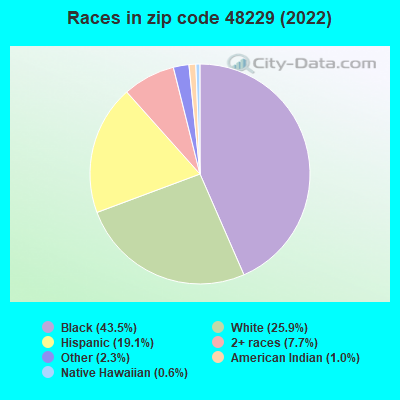
Median household income below state average. Median house value significantly below state average. Unemployed percentage above state average. Black race population percentage significantly above state average. Hispanic race population percentage significantly above state average. Median age below state average. Foreign-born population percentage significantly below state average. Length of stay since moving in significantly above state average. House age above state average. Percentage of population with a bachelor's degree or higher significantly below state average. 4,029 43.5% Black 2,395 25.9% White 1,768 19.1% Hispanic or Latino 714 7.7% Two or more races 216 2.3% Some other race 88 1.0% American Indian 52 0.6% Native Hawaiian and Other
Data:
Median household income ($)
Median household income (% change since 2000)
Household income diversity
Ratio of average income to average house value (%)
Ratio of average income to average rent
Median household income ($) - White
Median household income ($) - Black or African American
Median household income ($) - Asian
Median household income ($) - Hispanic or Latino
Median household income ($) - American Indian and Alaska Native
Median household income ($) - Multirace
Median household income ($) - Other Race
Median household income for houses/condos with a mortgage ($)
Median household income for apartments without a mortgage ($)
Races - White alone (%)
Races - White alone (% change since 2000)
Races - Black alone (%)
Races - Black alone (% change since 2000)
Races - American Indian alone (%)
Races - American Indian alone (% change since 2000)
Races - Asian alone (%)
Races - Asian alone (% change since 2000)
Races - Hispanic (%)
Races - Hispanic (% change since 2000)
Races - Native Hawaiian and Other Pacific Islander alone (%)
Races - Native Hawaiian and Other Pacific Islander alone (% change since 2000)
Races - Two or more races (%)
Races - Two or more races (% change since 2000)
Races - Other race alone (%)
Races - Other race alone (% change since 2000)
Racial diversity
Unemployment (%)
Unemployment (% change since 2000)
Unemployment (%) - White
Unemployment (%) - Black or African American
Unemployment (%) - Asian
Unemployment (%) - Hispanic or Latino
Unemployment (%) - American Indian and Alaska Native
Unemployment (%) - Multirace
Unemployment (%) - Other Race
Population density (people per square mile)
Population - Males (%)
Population - Females (%)
Population - Males (%) - White
Population - Males (%) - Black or African American
Population - Males (%) - Asian
Population - Males (%) - Hispanic or Latino
Population - Males (%) - American Indian and Alaska Native
Population - Males (%) - Multirace
Population - Males (%) - Other Race
Population - Females (%) - White
Population - Females (%) - Black or African American
Population - Females (%) - Asian
Population - Females (%) - Hispanic or Latino
Population - Females (%) - American Indian and Alaska Native
Population - Females (%) - Multirace
Population - Females (%) - Other Race
Coronavirus confirmed cases (Apr 25, 2024)
Deaths caused by coronavirus (Apr 25, 2024)
Coronavirus confirmed cases (per 100k population) (Apr 25, 2024)
Deaths caused by coronavirus (per 100k population) (Apr 25, 2024)
Daily increase in number of cases (Apr 25, 2024)
Weekly increase in number of cases (Apr 25, 2024)
Cases doubled (in days) (Apr 25, 2024)
Hospitalized patients (Apr 18, 2022)
Negative test results (Apr 18, 2022)
Total test results (Apr 18, 2022)
COVID Vaccine doses distributed (per 100k population) (Sep 19, 2023)
COVID Vaccine doses administered (per 100k population) (Sep 19, 2023)
COVID Vaccine doses distributed (Sep 19, 2023)
COVID Vaccine doses administered (Sep 19, 2023)
Likely homosexual households (%)
Likely homosexual households (% change since 2000)
Likely homosexual households - Lesbian couples (%)
Likely homosexual households - Lesbian couples (% change since 2000)
Likely homosexual households - Gay men (%)
Likely homosexual households - Gay men (% change since 2000)
Cost of living index
Median gross rent ($)
Median contract rent ($)
Median monthly housing costs ($)
Median house or condo value ($)
Median house or condo value ($ change since 2000)
Mean house or condo value by units in structure - 1, detached ($)
Mean house or condo value by units in structure - 1, attached ($)
Mean house or condo value by units in structure - 2 ($)
Mean house or condo value by units in structure by units in structure - 3 or 4 ($)
Mean house or condo value by units in structure - 5 or more ($)
Mean house or condo value by units in structure - Boat, RV, van, etc. ($)
Mean house or condo value by units in structure - Mobile home ($)
Median house or condo value ($) - White
Median house or condo value ($) - Black or African American
Median house or condo value ($) - Asian
Median house or condo value ($) - Hispanic or Latino
Median house or condo value ($) - American Indian and Alaska Native
Median house or condo value ($) - Multirace
Median house or condo value ($) - Other Race
Median resident age
Resident age diversity
Median resident age - Males
Median resident age - Females
Median resident age - White
Median resident age - Black or African American
Median resident age - Asian
Median resident age - Hispanic or Latino
Median resident age - American Indian and Alaska Native
Median resident age - Multirace
Median resident age - Other Race
Median resident age - Males - White
Median resident age - Males - Black or African American
Median resident age - Males - Asian
Median resident age - Males - Hispanic or Latino
Median resident age - Males - American Indian and Alaska Native
Median resident age - Males - Multirace
Median resident age - Males - Other Race
Median resident age - Females - White
Median resident age - Females - Black or African American
Median resident age - Females - Asian
Median resident age - Females - Hispanic or Latino
Median resident age - Females - American Indian and Alaska Native
Median resident age - Females - Multirace
Median resident age - Females - Other Race
Commute - mean travel time to work (minutes)
Travel time to work - Less than 5 minutes (%)
Travel time to work - Less than 5 minutes (% change since 2000)
Travel time to work - 5 to 9 minutes (%)
Travel time to work - 5 to 9 minutes (% change since 2000)
Travel time to work - 10 to 19 minutes (%)
Travel time to work - 10 to 19 minutes (% change since 2000)
Travel time to work - 20 to 29 minutes (%)
Travel time to work - 20 to 29 minutes (% change since 2000)
Travel time to work - 30 to 39 minutes (%)
Travel time to work - 30 to 39 minutes (% change since 2000)
Travel time to work - 40 to 59 minutes (%)
Travel time to work - 40 to 59 minutes (% change since 2000)
Travel time to work - 60 to 89 minutes (%)
Travel time to work - 60 to 89 minutes (% change since 2000)
Travel time to work - 90 or more minutes (%)
Travel time to work - 90 or more minutes (% change since 2000)
Marital status - Never married (%)
Marital status - Now married (%)
Marital status - Separated (%)
Marital status - Widowed (%)
Marital status - Divorced (%)
Median family income ($)
Median family income (% change since 2000)
Median non-family income ($)
Median non-family income (% change since 2000)
Median per capita income ($)
Median per capita income (% change since 2000)
Median family income ($) - White
Median family income ($) - Black or African American
Median family income ($) - Asian
Median family income ($) - Hispanic or Latino
Median family income ($) - American Indian and Alaska Native
Median family income ($) - Multirace
Median family income ($) - Other Race
Median year house/condo built
Median year apartment built
Year house built - Built 2005 or later (%)
Year house built - Built 2000 to 2004 (%)
Year house built - Built 1990 to 1999 (%)
Year house built - Built 1980 to 1989 (%)
Year house built - Built 1970 to 1979 (%)
Year house built - Built 1960 to 1969 (%)
Year house built - Built 1950 to 1959 (%)
Year house built - Built 1940 to 1949 (%)
Year house built - Built 1939 or earlier (%)
Average household size
Household density (households per square mile)
Average household size - White
Average household size - Black or African American
Average household size - Asian
Average household size - Hispanic or Latino
Average household size - American Indian and Alaska Native
Average household size - Multirace
Average household size - Other Race
Occupied housing units (%)
Vacant housing units (%)
Owner occupied housing units (%)
Renter occupied housing units (%)
Vacancy status - For rent (%)
Vacancy status - For sale only (%)
Vacancy status - Rented or sold, not occupied (%)
Vacancy status - For seasonal, recreational, or occasional use (%)
Vacancy status - For migrant workers (%)
Vacancy status - Other vacant (%)
Residents with income below the poverty level (%)
Residents with income below 50% of the poverty level (%)
Children below poverty level (%)
Poor families by family type - Married-couple family (%)
Poor families by family type - Male, no wife present (%)
Poor families by family type - Female, no husband present (%)
Poverty status for native-born residents (%)
Poverty status for foreign-born residents (%)
Poverty among high school graduates not in families (%)
Poverty among people who did not graduate high school not in families (%)
Residents with income below the poverty level (%) - White
Residents with income below the poverty level (%) - Black or African American
Residents with income below the poverty level (%) - Asian
Residents with income below the poverty level (%) - Hispanic or Latino
Residents with income below the poverty level (%) - American Indian and Alaska Native
Residents with income below the poverty level (%) - Multirace
Residents with income below the poverty level (%) - Other Race
Air pollution - Air Quality Index (AQI)
Air pollution - CO
Air pollution - NO2
Air pollution - SO2
Air pollution - Ozone
Air pollution - PM10
Air pollution - PM25
Air pollution - Pb
Crime - Murders per 100,000 population
Crime - Rapes per 100,000 population
Crime - Robberies per 100,000 population
Crime - Assaults per 100,000 population
Crime - Burglaries per 100,000 population
Crime - Thefts per 100,000 population
Crime - Auto thefts per 100,000 population
Crime - Arson per 100,000 population
Crime - City-data.com crime index
Crime - Violent crime index
Crime - Property crime index
Crime - Murders per 100,000 population (5 year average)
Crime - Rapes per 100,000 population (5 year average)
Crime - Robberies per 100,000 population (5 year average)
Crime - Assaults per 100,000 population (5 year average)
Crime - Burglaries per 100,000 population (5 year average)
Crime - Thefts per 100,000 population (5 year average)
Crime - Auto thefts per 100,000 population (5 year average)
Crime - Arson per 100,000 population (5 year average)
Crime - City-data.com crime index (5 year average)
Crime - Violent crime index (5 year average)
Crime - Property crime index (5 year average)
1996 Presidential Elections Results (%) - Democratic Party (Clinton)
1996 Presidential Elections Results (%) - Republican Party (Dole)
1996 Presidential Elections Results (%) - Other
2000 Presidential Elections Results (%) - Democratic Party (Gore)
2000 Presidential Elections Results (%) - Republican Party (Bush)
2000 Presidential Elections Results (%) - Other
2004 Presidential Elections Results (%) - Democratic Party (Kerry)
2004 Presidential Elections Results (%) - Republican Party (Bush)
2004 Presidential Elections Results (%) - Other
2008 Presidential Elections Results (%) - Democratic Party (Obama)
2008 Presidential Elections Results (%) - Republican Party (McCain)
2008 Presidential Elections Results (%) - Other
2012 Presidential Elections Results (%) - Democratic Party (Obama)
2012 Presidential Elections Results (%) - Republican Party (Romney)
2012 Presidential Elections Results (%) - Other
2016 Presidential Elections Results (%) - Democratic Party (Clinton)
2016 Presidential Elections Results (%) - Republican Party (Trump)
2016 Presidential Elections Results (%) - Other
2020 Presidential Elections Results (%) - Democratic Party (Biden)
2020 Presidential Elections Results (%) - Republican Party (Trump)
2020 Presidential Elections Results (%) - Other
Ancestries Reported - Arab (%)
Ancestries Reported - Czech (%)
Ancestries Reported - Danish (%)
Ancestries Reported - Dutch (%)
Ancestries Reported - English (%)
Ancestries Reported - French (%)
Ancestries Reported - French Canadian (%)
Ancestries Reported - German (%)
Ancestries Reported - Greek (%)
Ancestries Reported - Hungarian (%)
Ancestries Reported - Irish (%)
Ancestries Reported - Italian (%)
Ancestries Reported - Lithuanian (%)
Ancestries Reported - Norwegian (%)
Ancestries Reported - Polish (%)
Ancestries Reported - Portuguese (%)
Ancestries Reported - Russian (%)
Ancestries Reported - Scotch-Irish (%)
Ancestries Reported - Scottish (%)
Ancestries Reported - Slovak (%)
Ancestries Reported - Subsaharan African (%)
Ancestries Reported - Swedish (%)
Ancestries Reported - Swiss (%)
Ancestries Reported - Ukrainian (%)
Ancestries Reported - United States (%)
Ancestries Reported - Welsh (%)
Ancestries Reported - West Indian (%)
Ancestries Reported - Other (%)
Educational Attainment - No schooling completed (%)
Educational Attainment - Less than high school (%)
Educational Attainment - High school or equivalent (%)
Educational Attainment - Less than 1 year of college (%)
Educational Attainment - 1 or more years of college (%)
Educational Attainment - Associate degree (%)
Educational Attainment - Bachelor's degree (%)
Educational Attainment - Master's degree (%)
Educational Attainment - Professional school degree (%)
Educational Attainment - Doctorate degree (%)
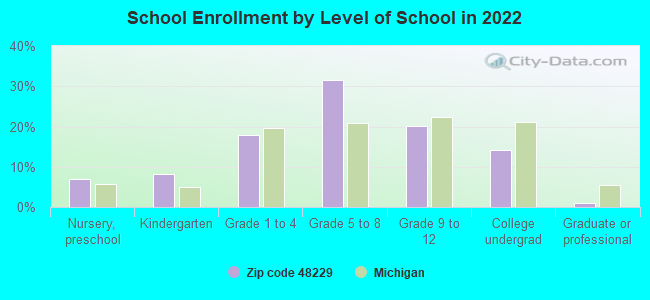
School Enrollment - Nursery, preschool (%)
School Enrollment - Kindergarten (%)
School Enrollment - Grade 1 to 4 (%)
School Enrollment - Grade 5 to 8 (%)
School Enrollment - Grade 9 to 12 (%)
School Enrollment - College undergrad (%)
School Enrollment - Graduate or professional (%)
School Enrollment - Not enrolled in school (%)
School enrollment - Public schools (%)
School enrollment - Private schools (%)
School enrollment - Not enrolled (%)
Median number of rooms in houses and condos
Median number of rooms in apartments
Housing units lacking complete plumbing facilities (%)
Housing units lacking complete kitchen facilities (%)
Density of houses
Urban houses (%)
Rural houses (%)
Households with people 60 years and over (%)
Households with people 65 years and over (%)
Households with people 75 years and over (%)
Households with one or more nonrelatives (%)
Households with no nonrelatives (%)
Population in households (%)
Family households (%)
Nonfamily households (%)
Population in families (%)
Family households with own children (%)
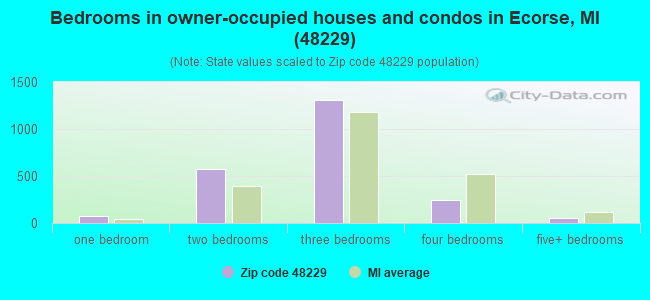
Median number of bedrooms in owner occupied houses
Mean number of bedrooms in owner occupied houses
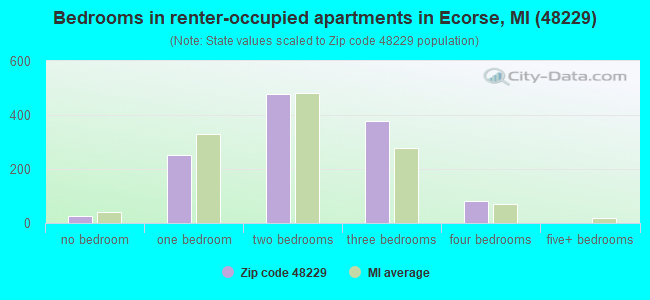
Median number of bedrooms in renter occupied houses
Mean number of bedrooms in renter occupied houses
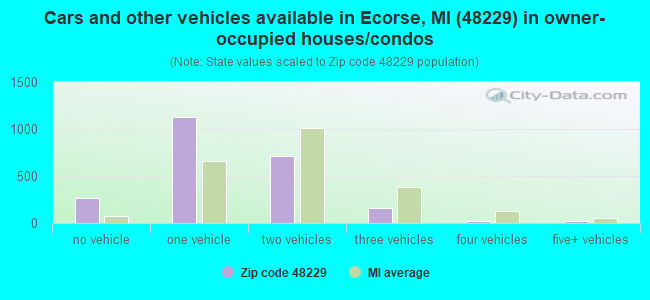
Median number of vehichles in owner occupied houses
Mean number of vehichles in owner occupied houses
Median number of vehichles in renter occupied houses
Mean number of vehichles in renter occupied houses
Mortgage status - with mortgage (%)
Mortgage status - with second mortgage (%)
Mortgage status - with home equity loan (%)
Mortgage status - with both second mortgage and home equity loan (%)
Mortgage status - without a mortgage (%)
Average family size
Average family size - White
Average family size - Black or African American
Average family size - Asian
Average family size - Hispanic or Latino
Average family size - American Indian and Alaska Native
Average family size - Multirace
Average family size - Other Race
Geographical mobility - Same house 1 year ago (%)
Geographical mobility - Moved within same county (%)
Geographical mobility - Moved from different county within same state (%)
Geographical mobility - Moved from different state (%)
Geographical mobility - Moved from abroad (%)
Place of birth - Born in state of residence (%)
Place of birth - Born in other state (%)
Place of birth - Native, outside of US (%)
Place of birth - Foreign born (%)
Housing units in structures - 1, detached (%)
Housing units in structures - 1, attached (%)
Housing units in structures - 2 (%)
Housing units in structures - 3 or 4 (%)
Housing units in structures - 5 to 9 (%)
Housing units in structures - 10 to 19 (%)
Housing units in structures - 20 to 49 (%)
Housing units in structures - 50 or more (%)
Housing units in structures - Mobile home (%)
Housing units in structures - Boat, RV, van, etc. (%)
House/condo owner moved in on average (years ago)
Renter moved in on average (years ago)
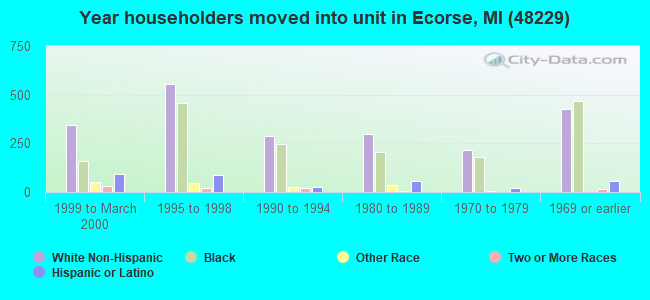
Year householder moved into unit - Moved in 1999 to March 2000 (%)
Year householder moved into unit - Moved in 1995 to 1998 (%)
Year householder moved into unit - Moved in 1990 to 1994 (%)
Year householder moved into unit - Moved in 1980 to 1989 (%)
Year householder moved into unit - Moved in 1970 to 1979 (%)
Year householder moved into unit - Moved in 1969 or earlier (%)
Means of transportation to work - Drove car alone (%)
Means of transportation to work - Carpooled (%)
Means of transportation to work - Public transportation (%)
Means of transportation to work - Bus or trolley bus (%)
Means of transportation to work - Streetcar or trolley car (%)
Means of transportation to work - Subway or elevated (%)
Means of transportation to work - Railroad (%)
Means of transportation to work - Ferryboat (%)
Means of transportation to work - Taxicab (%)
Means of transportation to work - Motorcycle (%)
Means of transportation to work - Bicycle (%)
Means of transportation to work - Walked (%)
Means of transportation to work - Other means (%)
Working at home (%)
Industry diversity
Most Common Industries - Agriculture, forestry, fishing and hunting, and mining (%)
Most Common Industries - Agriculture, forestry, fishing and hunting (%)
Most Common Industries - Mining, quarrying, and oil and gas extraction (%)
Most Common Industries - Construction (%)
Most Common Industries - Manufacturing (%)
Most Common Industries - Wholesale trade (%)
Most Common Industries - Retail trade (%)
Most Common Industries - Transportation and warehousing, and utilities (%)
Most Common Industries - Transportation and warehousing (%)
Most Common Industries - Utilities (%)
Most Common Industries - Information (%)
Most Common Industries - Finance and insurance, and real estate and rental and leasing (%)
Most Common Industries - Finance and insurance (%)
Most Common Industries - Real estate and rental and leasing (%)
Most Common Industries - Professional, scientific, and management, and administrative and waste management services (%)
Most Common Industries - Professional, scientific, and technical services (%)
Most Common Industries - Management of companies and enterprises (%)
Most Common Industries - Administrative and support and waste management services (%)
Most Common Industries - Educational services, and health care and social assistance (%)
Most Common Industries - Educational services (%)
Most Common Industries - Health care and social assistance (%)
Most Common Industries - Arts, entertainment, and recreation, and accommodation and food services (%)
Most Common Industries - Arts, entertainment, and recreation (%)
Most Common Industries - Accommodation and food services (%)
Most Common Industries - Other services, except public administration (%)
Most Common Industries - Public administration (%)
Occupation diversity
Most Common Occupations - Management, business, science, and arts occupations (%)
Most Common Occupations - Management, business, and financial occupations (%)
Most Common Occupations - Management occupations (%)
Most Common Occupations - Business and financial operations occupations (%)
Most Common Occupations - Computer, engineering, and science occupations (%)
Most Common Occupations - Computer and mathematical occupations (%)
Most Common Occupations - Architecture and engineering occupations (%)
Most Common Occupations - Life, physical, and social science occupations (%)
Most Common Occupations - Education, legal, community service, arts, and media occupations (%)
Most Common Occupations - Community and social service occupations (%)
Most Common Occupations - Legal occupations (%)
Most Common Occupations - Education, training, and library occupations (%)
Most Common Occupations - Arts, design, entertainment, sports, and media occupations (%)
Most Common Occupations - Healthcare practitioners and technical occupations (%)
Most Common Occupations - Health diagnosing and treating practitioners and other technical occupations (%)
Most Common Occupations - Health technologists and technicians (%)
Most Common Occupations - Service occupations (%)
Most Common Occupations - Healthcare support occupations (%)
Most Common Occupations - Protective service occupations (%)
Most Common Occupations - Fire fighting and prevention, and other protective service workers including supervisors (%)
Most Common Occupations - Law enforcement workers including supervisors (%)
Most Common Occupations - Food preparation and serving related occupations (%)
Most Common Occupations - Building and grounds cleaning and maintenance occupations (%)
Most Common Occupations - Personal care and service occupations (%)
Most Common Occupations - Sales and office occupations (%)
Most Common Occupations - Sales and related occupations (%)
Most Common Occupations - Office and administrative support occupations (%)
Most Common Occupations - Natural resources, construction, and maintenance occupations (%)
Most Common Occupations - Farming, fishing, and forestry occupations (%)
Most Common Occupations - Construction and extraction occupations (%)
Most Common Occupations - Installation, maintenance, and repair occupations (%)
Most Common Occupations - Production, transportation, and material moving occupations (%)
Most Common Occupations - Production occupations (%)
Most Common Occupations - Transportation occupations (%)
Most Common Occupations - Material moving occupations (%)
People in Group quarters - Institutionalized population (%)
People in Group quarters - Correctional institutions (%)
People in Group quarters - Federal prisons and detention centers (%)
People in Group quarters - Halfway houses (%)
People in Group quarters - Local jails and other confinement facilities (including police lockups) (%)
People in Group quarters - Military disciplinary barracks (%)
People in Group quarters - State prisons (%)
People in Group quarters - Other types of correctional institutions (%)
People in Group quarters - Nursing homes (%)
People in Group quarters - Hospitals/wards, hospices, and schools for the handicapped (%)
People in Group quarters - Hospitals/wards and hospices for chronically ill (%)
People in Group quarters - Hospices or homes for chronically ill (%)
People in Group quarters - Military hospitals or wards for chronically ill (%)
People in Group quarters - Other hospitals or wards for chronically ill (%)
People in Group quarters - Hospitals or wards for drug/alcohol abuse (%)
People in Group quarters - Mental (Psychiatric) hospitals or wards (%)
People in Group quarters - Schools, hospitals, or wards for the mentally retarded (%)
People in Group quarters - Schools, hospitals, or wards for the physically handicapped (%)
People in Group quarters - Institutions for the deaf (%)
People in Group quarters - Institutions for the blind (%)
People in Group quarters - Orthopedic wards and institutions for the physically handicapped (%)
People in Group quarters - Wards in general hospitals for patients who have no usual home elsewhere (%)
People in Group quarters - Wards in military hospitals for patients who have no usual home elsewhere (%)
People in Group quarters - Juvenile institutions (%)
People in Group quarters - Long-term care (%)
People in Group quarters - Homes for abused, dependent, and neglected children (%)
People in Group quarters - Residential treatment centers for emotionally disturbed children (%)
People in Group quarters - Training schools for juvenile delinquents (%)
People in Group quarters - Short-term care, detention or diagnostic centers for delinquent children (%)
People in Group quarters - Type of juvenile institution unknown (%)
People in Group quarters - Noninstitutionalized population (%)
People in Group quarters - College dormitories (includes college quarters off campus) (%)
People in Group quarters - Military quarters (%)
People in Group quarters - On base (%)
People in Group quarters - Barracks, unaccompanied personnel housing (UPH), (Enlisted/Officer), ;and similar group living quarters for military personnel (%)
People in Group quarters - Transient quarters for temporary residents (%)
People in Group quarters - Military ships (%)
People in Group quarters - Group homes (%)
People in Group quarters - Homes or halfway houses for drug/alcohol abuse (%)
People in Group quarters - Homes for the mentally ill (%)
People in Group quarters - Homes for the mentally retarded (%)
People in Group quarters - Homes for the physically handicapped (%)
People in Group quarters - Other group homes (%)
People in Group quarters - Religious group quarters (%)
People in Group quarters - Dormitories (%)
People in Group quarters - Agriculture workers' dormitories on farms (%)
People in Group quarters - Job Corps and vocational training facilities (%)
People in Group quarters - Other workers' dormitories (%)
People in Group quarters - Crews of maritime vessels (%)
People in Group quarters - Other nonhousehold living situations (%)
People in Group quarters - Other noninstitutional group quarters (%)
Residents speaking English at home (%)
Residents speaking English at home - Born in the United States (%)
Residents speaking English at home - Native, born elsewhere (%)
Residents speaking English at home - Foreign born (%)
Residents speaking Spanish at home (%)
Residents speaking Spanish at home - Born in the United States (%)
Residents speaking Spanish at home - Native, born elsewhere (%)
Residents speaking Spanish at home - Foreign born (%)
Residents speaking other language at home (%)
Residents speaking other language at home - Born in the United States (%)
Residents speaking other language at home - Native, born elsewhere (%)
Residents speaking other language at home - Foreign born (%)
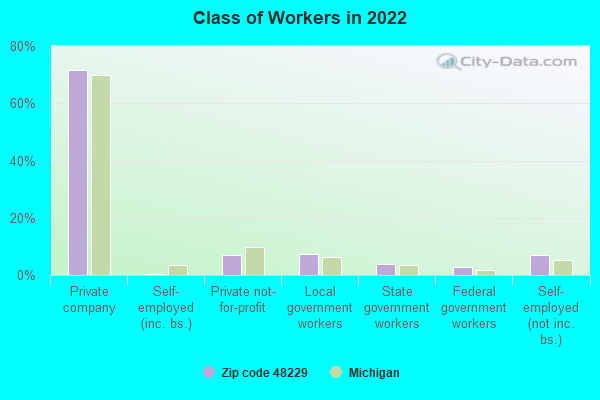
Class of Workers - Employee of private company (%)
Class of Workers - Self-employed in own incorporated business (%)
Class of Workers - Private not-for-profit wage and salary workers (%)
Class of Workers - Local government workers (%)
Class of Workers - State government workers (%)
Class of Workers - Federal government workers (%)
Class of Workers - Self-employed workers in own not incorporated business and Unpaid family workers (%)
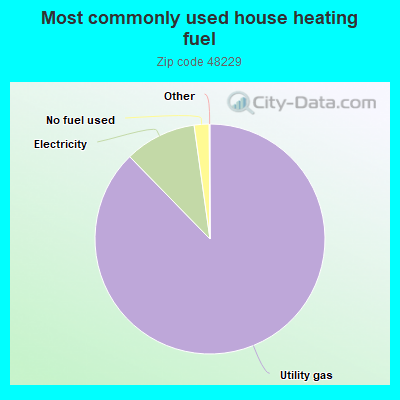
House heating fuel used in houses and condos - Utility gas (%)
House heating fuel used in houses and condos - Bottled, tank, or LP gas (%)
House heating fuel used in houses and condos - Electricity (%)
House heating fuel used in houses and condos - Fuel oil, kerosene, etc. (%)
House heating fuel used in houses and condos - Coal or coke (%)
House heating fuel used in houses and condos - Wood (%)
House heating fuel used in houses and condos - Solar energy (%)
House heating fuel used in houses and condos - Other fuel (%)
House heating fuel used in houses and condos - No fuel used (%)
House heating fuel used in apartments - Utility gas (%)
House heating fuel used in apartments - Bottled, tank, or LP gas (%)
House heating fuel used in apartments - Electricity (%)
House heating fuel used in apartments - Fuel oil, kerosene, etc. (%)
House heating fuel used in apartments - Coal or coke (%)
House heating fuel used in apartments - Wood (%)
House heating fuel used in apartments - Solar energy (%)
House heating fuel used in apartments - Other fuel (%)
House heating fuel used in apartments - No fuel used (%)
Armed forces status - In Armed Forces (%)
Armed forces status - Civilian (%)
Armed forces status - Civilian - Veteran (%)
Armed forces status - Civilian - Nonveteran (%)
Fatal accidents locations in years 2005-2021
Fatal accidents locations in 2005
Fatal accidents locations in 2006
Fatal accidents locations in 2007
Fatal accidents locations in 2008
Fatal accidents locations in 2009
Fatal accidents locations in 2010
Fatal accidents locations in 2011
Fatal accidents locations in 2012
Fatal accidents locations in 2013
Fatal accidents locations in 2014
Fatal accidents locations in 2015
Fatal accidents locations in 2016
Fatal accidents locations in 2017
Fatal accidents locations in 2018
Fatal accidents locations in 2019
Fatal accidents locations in 2020
Fatal accidents locations in 2021
Alcohol use - People drinking some alcohol every month (%)
Alcohol use - People not drinking at all (%)
Alcohol use - Average days/month drinking alcohol
Alcohol use - Average drinks/week
Alcohol use - Average days/year people drink much
Audiometry - Average condition of hearing (%)
Audiometry - People that can hear a whisper from across a quiet room (%)
Audiometry - People that can hear normal voice from across a quiet room (%)
Audiometry - Ears ringing, roaring, buzzing (%)
Audiometry - Had a job exposure to loud noise (%)
Audiometry - Had off-work exposure to loud noise (%)
Blood Pressure & Cholesterol - Has high blood pressure (%)
Blood Pressure & Cholesterol - Checking blood pressure at home (%)
Blood Pressure & Cholesterol - Frequently checking blood cholesterol (%)
Blood Pressure & Cholesterol - Has high cholesterol level (%)
Consumer Behavior - Money monthly spent on food at supermarket/grocery store
Consumer Behavior - Money monthly spent on food at other stores
Consumer Behavior - Money monthly spent on eating out
Consumer Behavior - Money monthly spent on carryout/delivered foods
Consumer Behavior - Income spent on food at supermarket/grocery store (%)
Consumer Behavior - Income spent on food at other stores (%)
Consumer Behavior - Income spent on eating out (%)
Consumer Behavior - Income spent on carryout/delivered foods (%)
Current Health Status - General health condition (%)
Current Health Status - Blood donors (%)
Current Health Status - Has blood ever tested for HIV virus (%)
Current Health Status - Left-handed people (%)
Dermatology - People using sunscreen (%)
Diabetes - Diabetics (%)
Diabetes - Had a blood test for high blood sugar (%)
Diabetes - People taking insulin (%)
Diet Behavior & Nutrition - Diet health (%)
Diet Behavior & Nutrition - Milk product consumption (# of products/month)
Diet Behavior & Nutrition - Meals not home prepared (#/week)
Diet Behavior & Nutrition - Meals from fast food or pizza place (#/week)
Diet Behavior & Nutrition - Ready-to-eat foods (#/month)
Diet Behavior & Nutrition - Frozen meals/pizza (#/month)
Drug Use - People that ever used marijuana or hashish (%)
Drug Use - Ever used hard drugs (%)
Drug Use - Ever used any form of cocaine (%)
Drug Use - Ever used heroin (%)
Drug Use - Ever used methamphetamine (%)
Health Insurance - People covered by health insurance (%)
Kidney Conditions-Urology - Avg. # of times urinating at night
Medical Conditions - People with asthma (%)
Medical Conditions - People with anemia (%)
Medical Conditions - People with psoriasis (%)
Medical Conditions - People with overweight (%)
Medical Conditions - Elderly people having difficulties in thinking or remembering (%)
Medical Conditions - People who ever received blood transfusion (%)
Medical Conditions - People having trouble seeing even with glass/contacts (%)
Medical Conditions - People with arthritis (%)
Medical Conditions - People with gout (%)
Medical Conditions - People with congestive heart failure (%)
Medical Conditions - People with coronary heart disease (%)
Medical Conditions - People with angina pectoris (%)
Medical Conditions - People who ever had heart attack (%)
Medical Conditions - People who ever had stroke (%)
Medical Conditions - People with emphysema (%)
Medical Conditions - People with thyroid problem (%)
Medical Conditions - People with chronic bronchitis (%)
Medical Conditions - People with any liver condition (%)
Medical Conditions - People who ever had cancer or malignancy (%)
Mental Health - People who have little interest in doing things (%)
Mental Health - People feeling down, depressed, or hopeless (%)
Mental Health - People who have trouble sleeping or sleeping too much (%)
Mental Health - People feeling tired or having little energy (%)
Mental Health - People with poor appetite or overeating (%)
Mental Health - People feeling bad about themself (%)
Mental Health - People who have trouble concentrating on things (%)
Mental Health - People moving or speaking slowly or too fast (%)
Mental Health - People having thoughts they would be better off dead (%)
Oral Health - Average years since last visit a dentist
Oral Health - People embarrassed because of mouth (%)
Oral Health - People with gum disease (%)
Oral Health - General health of teeth and gums (%)
Oral Health - Average days a week using dental floss/device
Oral Health - Average days a week using mouthwash for dental problem
Oral Health - Average number of teeth
Pesticide Use - Households using pesticides to control insects (%)
Pesticide Use - Households using pesticides to kill weeds (%)
Physical Activity - People doing vigorous-intensity work activities (%)
Physical Activity - People doing moderate-intensity work activities (%)
Physical Activity - People walking or bicycling (%)
Physical Activity - People doing vigorous-intensity recreational activities (%)
Physical Activity - People doing moderate-intensity recreational activities (%)
Physical Activity - Average hours a day doing sedentary activities
Physical Activity - Average hours a day watching TV or videos
Physical Activity - Average hours a day using computer
Physical Functioning - People having limitations keeping them from working (%)
Physical Functioning - People limited in amount of work they can do (%)
Physical Functioning - People that need special equipment to walk (%)
Physical Functioning - People experiencing confusion/memory problems (%)
Physical Functioning - People requiring special healthcare equipment (%)
Prescription Medications - Average number of prescription medicines taking
Preventive Aspirin Use - Adults 40+ taking low-dose aspirin (%)
Reproductive Health - Vaginal deliveries (%)
Reproductive Health - Cesarean deliveries (%)
Reproductive Health - Deliveries resulted in a live birth (%)
Reproductive Health - Pregnancies resulted in a delivery (%)
Reproductive Health - Women breastfeeding newborns (%)
Reproductive Health - Women that had a hysterectomy (%)
Reproductive Health - Women that had both ovaries removed (%)
Reproductive Health - Women that have ever taken birth control pills (%)
Reproductive Health - Women taking birth control pills (%)
Reproductive Health - Women that have ever used Depo-Provera or injectables (%)
Reproductive Health - Women that have ever used female hormones (%)
Sexual Behavior - People 18+ that ever had sex (vaginal, anal, or oral) (%)
Sexual Behavior - Males 18+ that ever had vaginal sex with a woman (%)
Sexual Behavior - Males 18+ that ever performed oral sex on a woman (%)
Sexual Behavior - Males 18+ that ever had anal sex with a woman (%)
Sexual Behavior - Males 18+ that ever had any sex with a man (%)
Sexual Behavior - Females 18+ that ever had vaginal sex with a man (%)
Sexual Behavior - Females 18+ that ever performed oral sex on a man (%)
Sexual Behavior - Females 18+ that ever had anal sex with a man (%)
Sexual Behavior - Females 18+ that ever had any kind of sex with a woman (%)
Sexual Behavior - Average age people first had sex
Sexual Behavior - Average number of female sex partners in lifetime (males 18+)
Sexual Behavior - Average number of female vaginal sex partners in lifetime (males 18+)
Sexual Behavior - Average age people first performed oral sex on a woman (18+)
Sexual Behavior - Average number of woman performed oral sex on in lifetime (18+)
Sexual Behavior - Average number of male sex partners in lifetime (males 18+)
Sexual Behavior - Average number of male anal sex partners in lifetime (males 18+)
Sexual Behavior - Average age people first performed oral sex on a man (18+)
Sexual Behavior - Average number of male oral sex partners in lifetime (18+)
Sexual Behavior - People using protection when performing oral sex (%)
Sexual Behavior - Average number of times people have vaginal or anal sex a year
Sexual Behavior - People having sex without condom (%)
Sexual Behavior - Average number of male sex partners in lifetime (females 18+)
Sexual Behavior - Average number of male vaginal sex partners in lifetime (females 18+)
Sexual Behavior - Average number of female sex partners in lifetime (females 18+)
Sexual Behavior - Circumcised males 18+ (%)
Sleep Disorders - Average hours sleeping at night
Sleep Disorders - People that has trouble sleeping (%)
Smoking-Cigarette Use - People smoking cigarettes (%)
Taste & Smell - People 40+ having problems with smell (%)
Taste & Smell - People 40+ having problems with taste (%)
Taste & Smell - People 40+ that ever had wisdom teeth removed (%)
Taste & Smell - People 40+ that ever had tonsils teeth removed (%)
Taste & Smell - People 40+ that ever had a loss of consciousness because of a head injury (%)
Taste & Smell - People 40+ that ever had a broken nose or other serious injury to face or skull (%)
Taste & Smell - People 40+ that ever had two or more sinus infections (%)
Weight - Average height (inches)
Weight - Average weight (pounds)
Weight - Average BMI
Weight - People that are obese (%)
Weight - People that ever were obese (%)
Weight - People trying to lose weight (%)
100%
urban population.
Estimated median house/condo value in 2022: $58,025
48229:
$58,025Michigan:
$224,400
Median resident age: This zip code:
35.1 yearsMichigan median age:
40.3 years
Average household size: This zip code:
2.6 peopleMichigan:
2.4 people
Averages for the 2020 tax year for zip code 48229, filed in 2021:
Average Adjusted Gross Income (AGI) in 2020: $30,038 (Individual Income Tax Returns) Here:
$30,038State:
$68,945
Salary/wage: $28,180 (reported on 74.3% of returns )Here:
$28,180State:
$57,142
(% of AGI for various income ranges: 888.6% for AGIs below $25k , 3044.3% for AGIs $25k-50k , 6778.8% for AGIs $50k-75k , 9830.0% for AGIs $75k-100k , 16007.1% for AGIs $100k-200k ) Taxable interest for individuals: $307 (reported on 11.3% of returns )This zip code:
$307Michigan:
$1,630
(% of AGI for various income ranges: 1.9% for AGIs below $25k , 2.5% for AGIs $25k-50k , 23.5% for AGIs $50k-75k , 11.1% for AGIs $75k-100k , 12.9% for AGIs $100k-200k ) Ordinary dividends: $790 (reported on 2.6% of returns )(% of AGI for various income ranges: 1.0% for AGIs below $25k , 0.8% for AGIs $25k-50k , 3.1% for AGIs $50k-75k , 53.3% for AGIs $75k-100k ) Net capital gain/loss in AGI: +$938 (reported on 2.1% of returns )(% of AGI for various income ranges: 0.5% for AGIs below $25k , 5.7% for AGIs $25k-50k , 14.4% for AGIs $75k-100k ) Profit/loss from business: +$2,557 (reported on 17.8% of returns )Here:
+$2,557State:
+$11,172
(% of AGI for various income ranges: 94.2% for AGIs below $25k , 8.8% for AGIs $25k-50k , 70.4% for AGIs $50k-75k , 86.7% for AGIs $75k-100k ) Taxable individual retirement arrangement distribution: $11,655 (reported on 2.9% of returns )48229:
$11,655Michigan:
$19,803
(% of AGI for various income ranges: 16.4% for AGIs below $25k , 24.3% for AGIs $25k-50k , 102.7% for AGIs $50k-75k , 601.1% for AGIs $75k-100k ) Total itemized deductions: $23,271 (reported on 1.8% of returns )Here:
$23,271State:
$34,117
(% of AGI for various income ranges: 29.3% for AGIs below $25k , 203.1% for AGIs $50k-75k , 742.2% for AGIs $75k-100k ) Charity contributions: $10,467 (reported on 1.6% of returns )Here:
$10,467State:
$13,548
(% of AGI for various income ranges: 33.7% for AGIs $25k-50k , 342.2% for AGIs $75k-100k ) Taxes paid: $5,986 (reported on 1.8% of returns )(% of AGI for various income ranges: 7.2% for AGIs below $25k , 47.7% for AGIs $50k-75k , 210.0% for AGIs $75k-100k ) Earned income credit: $2,776 (reported on 33.9% of returns )(% of AGI for various income ranges: 167.1% for AGIs below $25k , 116.6% for AGIs $25k-50k ) Percentage of individuals using paid preparers for their 2020 taxes: 92.1%(% for various income ranges: 92.6% for AGIs below $25k , 93.0% for AGIs $25k-50k , 89.2% for AGIs $50k-75k , 92.3% for AGIs $75k-100k , 83.3% for AGIs $100k-200k )
Averages for the 2012 tax year for zip code 48229, filed in 2013:
Average Adjusted Gross Income (AGI) in 2012: $25,215 (Individual Income Tax Returns) Here:
$25,215State:
$55,609
Salary/wage: $24,192 (reported on 77.1% of returns )Here:
$24,192State:
$46,782
(% of AGI for various income ranges: 66.1% for AGIs below $25k , 79.3% for AGIs $25k-50k , 80.6% for AGIs $50k-75k , 78.0% for AGIs $75k-100k , 65.0% for AGIs $100k-200k ) Taxable interest for individuals: $433 (reported on 13.1% of returns )This zip code:
$433Michigan:
$1,491
(% of AGI for various income ranges: 0.4% for AGIs below $25k , 0.1% for AGIs $25k-50k , 0.2% for AGIs $50k-75k , 0.1% for AGIs $75k-100k , 0.1% for AGIs $100k-200k ) Ordinary dividends: $493 (reported on 3.8% of returns )(% of AGI for various income ranges: 0.1% for AGIs below $25k ) Profit/loss from business: +$7,900 (reported on 17.4% of returns )Here:
+$7,900State:
+$11,523
(% of AGI for various income ranges: 15.5% for AGIs below $25k , 1.9% for AGIs $25k-50k , 0.9% for AGIs $75k-100k ) Taxable individual retirement arrangement distribution: $7,793 (reported on 3.8% of returns )48229:
$7,793Michigan:
$15,298
(% of AGI for various income ranges: 1.1% for AGIs below $25k , 1.2% for AGIs $25k-50k , 2.5% for AGIs $50k-75k ) Total itemized deductions: $14,211 (25% of AGI, reported on 12.3% of returns )Here:
$14,211State:
$21,628
Here:
24.7% of AGIState:
18.4% of AGI
(% of AGI for various income ranges: 3.2% for AGIs below $25k , 6.6% for AGIs $25k-50k , 9.2% for AGIs $50k-75k , 10.2% for AGIs $75k-100k , 11.5% for AGIs $100k-200k ) Charity contributions: $4,024 (reported on 10.4% of returns )(% of AGI for various income ranges: 0.5% for AGIs below $25k , 1.5% for AGIs $25k-50k , 2.5% for AGIs $50k-75k , 2.5% for AGIs $75k-100k , 3.1% for AGIs $100k-200k ) Taxes paid: $4,762 (reported on 12.3% of returns )(% of AGI for various income ranges: 0.8% for AGIs below $25k , 1.9% for AGIs $25k-50k , 3.3% for AGIs $50k-75k , 3.8% for AGIs $75k-100k , 4.8% for AGIs $100k-200k ) Earned income credit: $2,897 (reported on 39.8% of returns )(% of AGI for various income ranges: 13.3% for AGIs below $25k , 1.5% for AGIs $25k-50k ) Percentage of individuals using paid preparers for their 2012 taxes: 60.2%(% for various income ranges: 60.3% for AGIs below $25k , 59.2% for AGIs $25k-50k , 62.1% for AGIs $50k-75k , 61.5% for AGIs $75k-100k , 57.1% for AGIs $100k-200k )
Averages for the 2004 tax year for zip code 48229, filed in 2005:
Average Adjusted Gross Income (AGI) in 2004: $27,376 (Individual Income Tax Returns) Here:
$27,376State:
$48,204
Salary/wage: $26,545 (reported on 84.4% of returns )Here:
$26,545State:
$42,791
(% of AGI for various income ranges: 74.0% for AGIs below $10k , 75.4% for AGIs $10k-25k , 84.7% for AGIs $25k-50k , 88.7% for AGIs $50k-75k , 82.7% for AGIs $75k-100k , 70.5% for AGIs over 100k ) Taxable interest for individuals: $698 (reported on 26.6% of returns )This zip code:
$698Michigan:
$1,725
(% of AGI for various income ranges: 1.8% for AGIs below $10k , 1.1% for AGIs $10k-25k , 0.5% for AGIs $25k-50k , 0.5% for AGIs $50k-75k , 0.2% for AGIs $75k-100k , 0.9% for AGIs over 100k ) Taxable dividends: $981 (reported on 7.8% of returns )(% of AGI for various income ranges: 0.9% for AGIs below $10k , 0.4% for AGIs $10k-25k , 0.1% for AGIs $25k-50k , 0.2% for AGIs $50k-75k , 0.1% for AGIs $75k-100k , 0.7% for AGIs over 100k ) Net capital gain/loss: +$1,070 (reported on 3.5% of returns )Here:
+$1,070State:
+$8,532
(% of AGI for various income ranges: -0.2% for AGIs below $10k , 0.1% for AGIs $10k-25k , 0.3% for AGIs $25k-50k , 0.1% for AGIs $50k-75k , -0.0% for AGIs $75k-100k , 0.2% for AGIs over 100k ) Profit/loss from business: +$3,307 (reported on 8.7% of returns )Here:
+$3,307State:
+$9,547
(% of AGI for various income ranges: 11.4% for AGIs below $10k , 2.8% for AGIs $10k-25k , -0.2% for AGIs $25k-50k , 0.5% for AGIs $50k-75k , -0.3% for AGIs $75k-100k ) IRA payment deduction: $2,045 (reported on 0.5% of returns )48229:
$2,045Michigan:
$2,875
Total itemized deductions: $12,835 (25% of AGI, reported on 17.8% of returns )Here:
$12,835State:
$18,509
Here:
25.4% of AGIState:
20.7% of AGI
(% of AGI for various income ranges: 5.6% for AGIs below $10k , 4.9% for AGIs $10k-25k , 8.4% for AGIs $25k-50k , 9.3% for AGIs $50k-75k , 9.9% for AGIs $75k-100k , 13.1% for AGIs over 100k ) Charity contributions deductions: $3,205 (6% of AGI, reported on 15.7% of returns )Here:
6.1% of AGIState:
3.6% of AGI
(% of AGI for various income ranges: 0.5% for AGIs below $10k , 0.8% for AGIs $10k-25k , 1.6% for AGIs $25k-50k , 2.4% for AGIs $50k-75k , 2.5% for AGIs $75k-100k , 3.9% for AGIs over 100k ) Total tax: $3,344 (reported on 61.3% of returns )(% of AGI for various income ranges: 2.0% for AGIs below $10k , 2.8% for AGIs $10k-25k , 6.2% for AGIs $25k-50k , 9.7% for AGIs $50k-75k , 12.1% for AGIs $75k-100k , 15.0% for AGIs over 100k ) Earned income credit: $1,955 (reported on 32.1% of returns )Percentage of individuals using paid preparers for their 2004 taxes: 66.9%(% for various income ranges: 64.5% for AGIs below $10k , 70.3% for AGIs $10k-25k , 65.1% for AGIs $25k-50k , 66.9% for AGIs $50k-75k , 66.9% for AGIs $75k-100k , 65.7% for AGIs over 100k )
Estimated median household income in 2022: This zip code:
$44,509Michigan:
$66,986
Nearest zip codes: 48218 ,
48217 ,
48146 ,
48192 ,
48122 ,
48209 .
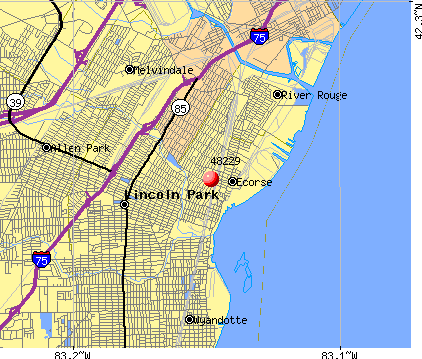
Lincoln Park Zip Code Map
Percentage of family households: This zip code:
34.5%Michigan:
43.3%
Percentage of households with unmarried partners: This zip code:
7.3%Michigan:
45.7%
No gay or lesbian households reported
Household received Food Stamps/SNAP in the past 12 months: 1,209Household did not receive Food Stamps/SNAP in the past 12 months: 2,349
Women who had a birth in the past 12 months: 146 (110 now married , 36 unmarried) Women who did not have a birth in the past 12 months: 1,827 (471 now married , 1,361 unmarried)
Housing units in zip code 48229 with a mortgage: 602 (55
second mortgage , 48
both second mortgage and home equity loan )
Median monthly owner costs for units with a mortgage: $1,064
Median monthly owner costs for units without a mortgage: $435
Residents with income below the poverty level in 2022:
This zip code:
25.6%Whole state:
13.4%
Residents with income below 50% of the poverty level in 2022:
This zip code:
12.4%Whole state:
6.9%
Median number of rooms in houses and condos: Median number of rooms in apartments: Notable locations in this zip code not listed on our city pages
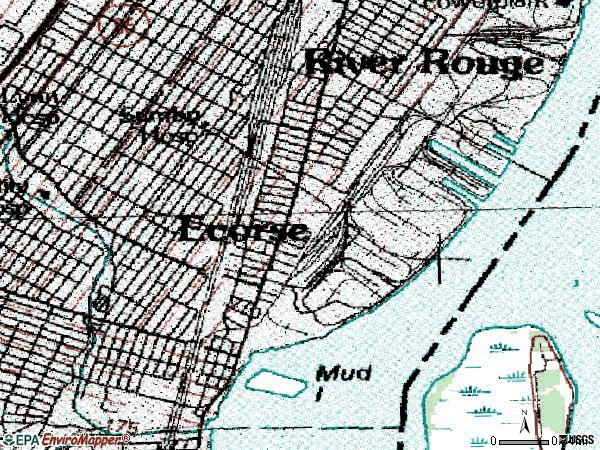
Click to draw/clear zip code borders Notable locations in zip code 48229: (A) , Rivers Edge Marina Incorporated (B) , Ecorse City Hall (C) , Ecorse Library (D) , Ecorse Police Station (E) , Ecorse Fire Department (F) . Display/hide their locations on the map
Churches in zip code 48229 include: (A) , Little Ida Church (B) , More Light Baptist Church (C) , Seventh Street Free Will Baptist Church of Ecorse (D) , First Baptist Church of Ecorse (E) . Display/hide their locations on the map
Cemetery: (1) . Display/hide its location on the map
Parks in zip code 48229 include: (1) , Bernard Popp Memorial Park (2) . Display/hide their locations on the map
Year house built (houses)
17 2020 or later120 2010 to 2019192 2000 to 200971 1990 to 199947 1980 to 1989342 1970 to 1979550 1960 to 19691,004 1950 to 1959480 1940 to 19491,278 1939 or earlier
Zip code 48229 household income distribution in 2022 312 Less than $10,000460 $10,000 to $14,999216 $15,000 to $19,999233 $20,000 to $24,999135 $25,000 to $29,99978 $30,000 to $34,999212 $35,000 to $39,999102 $40,000 to $44,999228 $45,000 to $49,999506 $50,000 to $59,999343 $60,000 to $74,999272 $75,000 to $99,999173 $100,000 to $124,99957 $125,000 to $149,999106 $150,000 to $199,99960 $200,000 or moreEstimate of home value of owner-occupied houses/condos in 2022 in zip code 48229 188 Less than $10,00061 $10,000 to $14,99948 $15,000 to $19,999135 $20,000 to $24,99921 $25,000 to $29,999151 $30,000 to $34,99943 $35,000 to $39,999270 $40,000 to $49,999312 $50,000 to $59,99999 $60,000 to $69,999159 $70,000 to $79,999162 $80,000 to $89,99971 $90,000 to $99,999129 $100,000 to $124,99943 $125,000 to $149,9998 $150,000 to $174,99917 $175,000 to $199,99912 $400,000 to $499,9995 $500,000 to $749,99930 $750,000 to $999,999Rent paid by renters in 2022 in zip code 48229 22 Less than $10029 $100 to $14920 $150 to $19997 $200 to $24946 $250 to $29922 $350 to $39926 $400 to $44910 $450 to $499197 $500 to $549110 $550 to $59937 $600 to $64960 $650 to $699125 $700 to $74948 $750 to $799115 $800 to $89995 $900 to $99966 $1,000 to $1,24962 No cash rent
Median gross rent in 2022: $841.
Median price asked for vacant for-sale houses and condos in 2022: $179,732.
Estimated median house (or condo) value in 2022 for: White Non-Hispanic householders: $55,900Black or African American householders: $62,672Some other race householders: $50,721Two or more races householders: $70,240Hispanic or Latino householders: $51,784Estimated median house or condo value in 2022: $58,025
48229:
$58,025Michigan:
$224,400
Lower value quartile - upper value quartile: $34,829 - $87,251
Mean price in 2022: Detached houses: $165,259Here:
$165,259State:
$280,038
Townhouses or other attached units: $18,348Here:
$18,348State:
$239,520
In 2-unit structures: $240,435Here:
$240,435State:
$219,481
Mobile homes: $20,750Here:
$20,750State:
$72,868
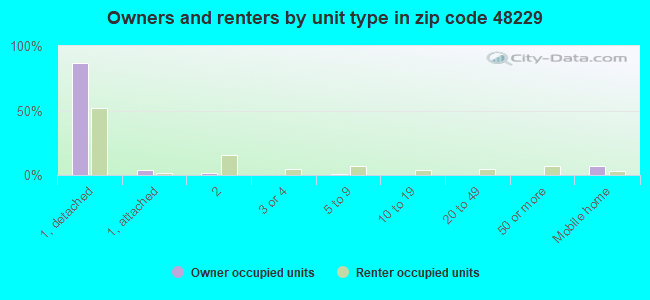
Housing units in structures:
One, detached: 3,062One, attached: 112Two: 3173 or 4: 1335 to 9: 10210 to 19: 5820 to 49: 6050 or more: 86Mobile homes: 206Unemployment : 8.0%
Means of transportation to work in zip code 48229 74.1% 2,454 Drove a car alone6.6% 220 Carpooled1.5% 50 Bus or trolley bus3.3% 108 Walked0.3% 11 Other means13.8% 456 Worked at homeTravel time to work (commute) in zip code 48229 51 Less than 5 minutes138 5 to 9 minutes376 10 to 14 minutes509 15 to 19 minutes627 20 to 24 minutes281 25 to 29 minutes397 30 to 34 minutes89 35 to 39 minutes49 40 to 44 minutes219 45 to 59 minutes95 60 to 89 minutes21 90 or more minutes
Neighborhoods in zip code 48229: Percentage of zip code residents living and working in this county: 87.9%
Household type by relationship:
Households: 9,266
Male householders: 1,556 (750 living alone ), Female householders: 1,952 (605 living alone )710 spouses (693 opposite-sex spouses ), 267 unmarried partners , (255 opposite-sex unmarried partners ), 3,253 children (3,143 natural , 0 adopted , 114 stepchildren ), 613 grandchildren , 391 brothers or sisters , 103 parents , 0 foster children , 74 other relatives , 278 non-relatives In group quarters: 42 (-1 institutionalized population )
Size of family households: 712 2-persons , 519 3-persons , 409 4-persons , 175 5-persons , 89 6-persons , 62 7-or-more-persons
Size of nonfamily households: 1,352 1-person , 97 2-persons , 73 3-persons
983 married couples with children. single-parent households (243 men , 798 women ).
89.3% of residents of 48229 zip code speak English at home. of residents speak Spanish at home (81% very well, 13% well, 4% not well, 2% not at all ).of residents speak other Indo-European language at home (100% very well ).of residents speak other language at home (96% very well, 4% well ).
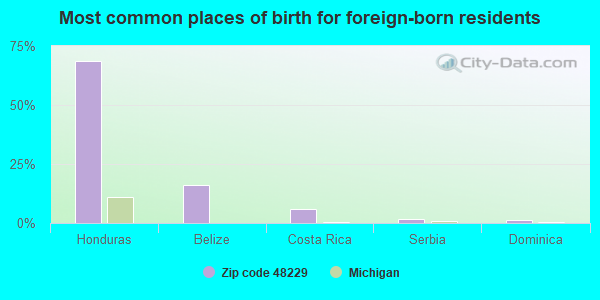
Foreign born population: 184 (2.0%)
(21.6%
of them are naturalized citizens )
This zip code:
2.0%Whole state:
6.9%
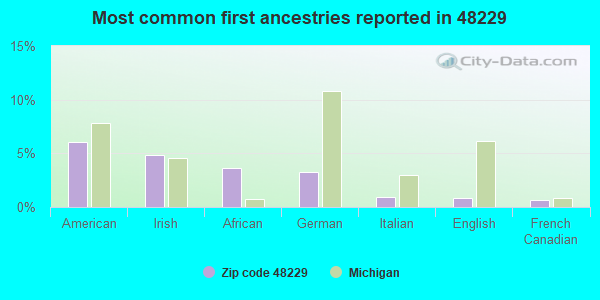
69% Honduras 16% Belize 6% Costa Rica 2% Serbia 1% Dominica 6% American 5% Irish 4% African 3% German 1% Italian 1% English 1% French Canadian
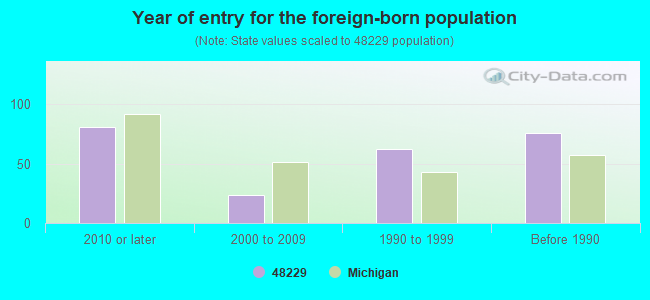
Year of entry for the foreign-born population
81 2010 or later 24 2000 to 2009 62 1990 to 1999 76 Before 1990
Major facilities with environmental interests located in this zip code:
ALLSTATE INDUSTRIAL EQUIPMENT (4534 WEBSTER in ECORSE, MI)
(Integrated Compliance Information System) - ICIS-05-2004-0092, FORMAL ENFORCEMENT ACTION, ICIS-05-2005-0053, ENFORCEMENT/COMPLIANCE ACTIVITY (Integrated Compliance Information System) - ICIS-05-2004-0092, FORMAL ENFORCEMENT ACTION, ICIS-05-2005-0053, ENFORCEMENT/COMPLIANCE ACTIVITY
ECORSE HIGH SCHOOL (27385 W. OUTER DRIVE in ECORSE, MI)
(Geographic Names Information System) (National Center for Education Statistics) - STATE ID-01069 Organizations: ECORSE PUBLIC SCHOOL DISTRICT (SCHOOL DISTRICT)
GRANDPORT ELEMENTARY (4536 6TH STREET in ECORSE, MI)
(National Center for Education Statistics) - STATE ID-03414 Organizations: ECORSE PUBLIC SCHOOL DISTRICT (SCHOOL DISTRICT)
GREAT LAKES STEEL MICHIGAN STE (MILL ST 2BLKS W OF JEFFERSON in ECORSE, MI)
(Integrated Compliance Information System) - ICIS-05-1986-0397, FORMAL ENFORCEMENT ACTION
AMOCO OIL CO 2301 JACKSON & SON SVC (4446 W JEFFERSON in ECORSE, MI)
(Resource Conservation and Recovery Act (tracking hazardous waste)) Organizations: AMOCO OIL COMPANY (CONTACT/OWNER)
BENNETT CORP (4647 4TH ST in ECORSE, MI)
(Resource Conservation and Recovery Act (tracking hazardous waste)) Organizations: BURLHOM JOHN (CONTACT/OWNER)
MI DEPT/TRANSPORTATION (M-5 FROM MARENE ST TO M-102 in ECORSE, MI)
(Resource Conservation and Recovery Act (tracking hazardous waste)) Organizations: MDOT (CONTACT/OWNER)
Housing units lacking complete plumbing facilities: 3.5%
Housing units lacking complete kitchen facilities: 6.2%
87.7% Utility gas 10.1% Electricity 2.1% No fuel used
Population in 1990: 12,164.
Place of birth for U.S.-born residents:
This state: 7,557Northeast: 116Midwest: 196South: 946West: 181
65% of the 48229 zip code residents lived in the same house 5 years ago.
Out of people who lived in different houses, 86% lived in this county.
Out of people who lived in different counties, 50% lived in Michigan.
89% of the 48229 zip code residents lived in the same house 1 year ago.
Out of people who lived in different houses, 70% moved from this county.
Out of people who lived in different houses, 9% moved from different county within same state.
Out of people who lived in different houses, 13% moved from different state.
Out of people who lived in different houses, 7% moved from abroad.
Private vs. public school enrollment:
Students in private schools in grades 1 to 8 (elementary and middle school): 18
Students in private schools in grades 9 to 12 (high school): 51
Students in private undergraduate colleges: 15
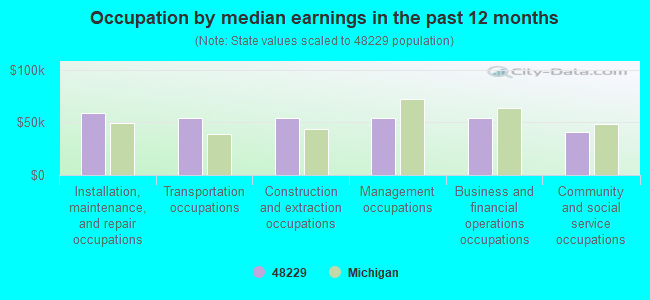
Occupation by median earnings in the past 12 months ($)
58,526 Installation, maintenance, and repair occupations 54,548 Transportation occupations 54,363 Construction and extraction occupations 53,987 Management occupations 53,838 Business and financial operations occupations 40,711 Community and social service occupations
Companies with federal contracts located in this zip code:
NICHOLSON TERMINAL & DOCK CO (360 EAST GREAT LAKES AVE in ECORSE, MI) in 2 contracts in 2005
$8,304 with U.S. Army Corps of Engineers - civil program financing only for Maintenance, Repair and Rebuilding of Equipment -- Ships, Small Craft, Pontoons, and Floating Docks. Signed on 2005-04-08. Completion date: 2005-04-11.
with Army for Maintenance, Repair and Rebuilding of Equipment -- Ships, Small Craft, Pontoons, and Floating Docks. Signed on 2005-04-08. Completion date: 2005-04-11.
Top industries in this zip code by the number of employees in 2005:
Accommodation and Food Services: Limited-Service Restaurants (50-99 employees: 1 establishment, 20-49 employees: 2 establishments, 10-19 employees: 1 establishment, 1-4 employees: 1 establishment)Administrative and Support and Waste Management and Remediation Services: Janitorial Services (50-99: 1)Other Services (except Public Administration): Religious Organizations (20-49: 1, 10-19: 1, 5-9: 1, 1-4: 1)Finance and Insurance: Credit Unions (20-49: 1, 10-19: 1)
People in group quarters in 2010:
13 people in group homes intended for adults
11 people in correctional residential facilities
People in group quarters in 2000:
15 people in other types of correctional institutions
9 people in local jails and other confinement facilities (including police lockups)
7 people in other noninstitutional group quarters
6 people in homes for the mentally ill
6 people in homes for the mentally retarded
5 people in other group homes
Fatal accident statistics in 2012:
Fatal accident count: 2Vehicles involved in fatal accidents: 3Fatal accidents caused by drunken drivers: 0Fatalities: 2Persons involved in fatal accidents: 6Pedestrians involved in fatal accidents: 0
Fatal accident statistics in 2010:
Fatal accident count: 1Vehicles involved in fatal accidents: 1Fatal accidents caused by drunken drivers: 1Fatalities: 1Persons involved in fatal accidents: 2Pedestrians involved in fatal accidents: 0
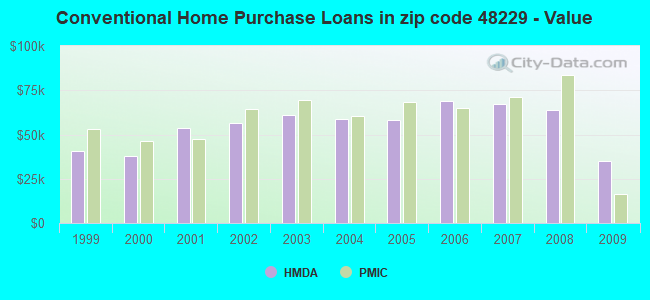
Home Mortgage Disclosure Act Aggregated Statistics For Year 2009(Based on 4 full and 6 partial tracts) A) FHA, FSA/RHS & VA B) Conventional C) Refinancings D) Home Improvement Loans F) Non-occupant Loans on G) Loans On Manufactured Number Average Value Number Average Value Number Average Value Number Average Value Number Average Value Number Average Value
LOANS ORIGINATED 6 $30,918 3 $35,230 11 $53,509 12 $5,556 1 $22,300 2 $975 APPLICATIONS APPROVED, NOT ACCEPTED 0 $0 2 $60,555 2 $65,385 2 $5,955 0 $0 2 $60,555 APPLICATIONS DENIED 0 $0 2 $48,795 36 $65,442 27 $25,379 0 $0 0 $0 APPLICATIONS WITHDRAWN 2 $38,715 0 $0 18 $64,014 0 $0 4 $56,535 0 $0 FILES CLOSED FOR INCOMPLETENESS 0 $0 0 $0 2 $47,650 0 $0 2 $47,650 0 $0
Aggregated Statistics For Year 2008(Based on 4 full and 4 partial tracts) A) FHA, FSA/RHS & VA B) Conventional C) Refinancings D) Home Improvement Loans E) Loans on Dwellings For 5+ Families F) Non-occupant Loans on G) Loans On Manufactured Number Average Value Number Average Value Number Average Value Number Average Value Number Average Value Number Average Value Number Average Value
LOANS ORIGINATED 14 $60,854 11 $63,790 61 $60,888 32 $22,421 0 $0 20 $44,659 2 $7,940 APPLICATIONS APPROVED, NOT ACCEPTED 0 $0 0 $0 13 $59,411 7 $25,267 0 $0 4 $53,605 0 $0 APPLICATIONS DENIED 4 $44,175 23 $44,130 149 $68,166 72 $29,908 2 $111,180 53 $56,101 7 $32,657 APPLICATIONS WITHDRAWN 2 $70,480 15 $63,961 33 $75,576 2 $12,045 0 $0 13 $71,529 0 $0 FILES CLOSED FOR INCOMPLETENESS 1 $67,910 1 $68,920 9 $84,097 0 $0 0 $0 4 $60,900 0 $0
Aggregated Statistics For Year 2007(Based on 4 full and 6 partial tracts) A) FHA, FSA/RHS & VA B) Conventional C) Refinancings D) Home Improvement Loans E) Loans on Dwellings For 5+ Families F) Non-occupant Loans on G) Loans On Manufactured Number Average Value Number Average Value Number Average Value Number Average Value Number Average Value Number Average Value Number Average Value
LOANS ORIGINATED 9 $76,727 88 $67,281 160 $66,340 44 $27,729 3 $205,323 74 $60,120 0 $0 APPLICATIONS APPROVED, NOT ACCEPTED 0 $0 33 $77,530 59 $66,562 10 $29,230 0 $0 22 $77,152 0 $0 APPLICATIONS DENIED 6 $50,527 149 $77,250 326 $69,490 92 $28,338 0 $0 119 $70,641 4 $10,735 APPLICATIONS WITHDRAWN 3 $90,900 16 $63,432 86 $78,195 6 $77,342 0 $0 7 $66,894 0 $0 FILES CLOSED FOR INCOMPLETENESS 2 $58,555 9 $68,452 38 $76,344 0 $0 0 $0 13 $66,762 0 $0
Aggregated Statistics For Year 2006(Based on 4 full and 4 partial tracts) A) FHA, FSA/RHS & VA B) Conventional C) Refinancings D) Home Improvement Loans E) Loans on Dwellings For 5+ Families F) Non-occupant Loans on G) Loans On Manufactured Number Average Value Number Average Value Number Average Value Number Average Value Number Average Value Number Average Value Number Average Value
LOANS ORIGINATED 22 $76,075 200 $69,070 314 $60,452 49 $26,619 1 $72,980 121 $59,931 4 $36,595 APPLICATIONS APPROVED, NOT ACCEPTED 0 $0 98 $67,157 92 $73,378 6 $24,593 0 $0 36 $61,013 4 $32,205 APPLICATIONS DENIED 11 $64,625 231 $71,513 394 $74,904 86 $28,025 0 $0 117 $64,598 4 $31,952 APPLICATIONS WITHDRAWN 10 $76,723 50 $69,562 175 $77,541 14 $46,156 0 $0 31 $64,227 0 $0 FILES CLOSED FOR INCOMPLETENESS 0 $0 4 $61,160 48 $76,858 0 $0 0 $0 6 $66,687 0 $0
Aggregated Statistics For Year 2005(Based on 4 full and 6 partial tracts) A) FHA, FSA/RHS & VA B) Conventional C) Refinancings D) Home Improvement Loans F) Non-occupant Loans on G) Loans On Manufactured Number Average Value Number Average Value Number Average Value Number Average Value Number Average Value Number Average Value
LOANS ORIGINATED 29 $73,675 206 $58,101 424 $67,059 66 $31,472 175 $65,301 2 $19,520 APPLICATIONS APPROVED, NOT ACCEPTED 4 $81,002 108 $63,028 104 $61,761 10 $19,446 36 $63,533 1 $23,310 APPLICATIONS DENIED 5 $79,634 167 $60,972 497 $71,852 95 $25,003 86 $62,145 8 $44,649 APPLICATIONS WITHDRAWN 6 $85,970 107 $68,928 251 $76,876 36 $97,673 41 $73,333 0 $0 FILES CLOSED FOR INCOMPLETENESS 0 $0 25 $45,148 83 $65,884 2 $19,855 9 $38,166 0 $0
Aggregated Statistics For Year 2004(Based on 4 full and 4 partial tracts) A) FHA, FSA/RHS & VA B) Conventional C) Refinancings D) Home Improvement Loans E) Loans on Dwellings For 5+ Families F) Non-occupant Loans on G) Loans On Manufactured Number Average Value Number Average Value Number Average Value Number Average Value Number Average Value Number Average Value Number Average Value
LOANS ORIGINATED 48 $80,991 172 $59,032 439 $61,657 70 $38,567 2 $218,395 146 $56,402 0 $0 APPLICATIONS APPROVED, NOT ACCEPTED 2 $61,480 66 $64,342 154 $64,610 11 $31,210 2 $218,395 37 $61,258 0 $0 APPLICATIONS DENIED 8 $66,595 98 $66,093 421 $70,359 66 $24,326 2 $253,140 84 $61,699 2 $24,845 APPLICATIONS WITHDRAWN 15 $75,803 35 $52,315 183 $68,636 7 $60,227 0 $0 15 $54,919 0 $0 FILES CLOSED FOR INCOMPLETENESS 7 $97,531 10 $59,988 43 $69,795 0 $0 0 $0 2 $5,270 0 $0
Aggregated Statistics For Year 2003(Based on 4 full and 6 partial tracts) A) FHA, FSA/RHS & VA B) Conventional C) Refinancings D) Home Improvement Loans E) Loans on Dwellings For 5+ Families F) Non-occupant Loans on Number Average Value Number Average Value Number Average Value Number Average Value Number Average Value Number Average Value
LOANS ORIGINATED 58 $67,451 148 $60,909 549 $55,356 62 $14,567 1 $395,300 146 $53,637 APPLICATIONS APPROVED, NOT ACCEPTED 2 $53,675 44 $66,816 142 $66,746 12 $26,331 0 $0 31 $57,712 APPLICATIONS DENIED 10 $75,561 72 $62,182 349 $60,639 103 $15,801 2 $567,615 56 $49,036 APPLICATIONS WITHDRAWN 15 $68,943 13 $53,231 209 $62,462 3 $38,610 0 $0 18 $53,624 FILES CLOSED FOR INCOMPLETENESS 5 $80,486 18 $59,561 42 $71,222 1 $67,910 0 $0 5 $52,058
Aggregated Statistics For Year 2002(Based on 4 full and 6 partial tracts) A) FHA, FSA/RHS & VA B) Conventional C) Refinancings D) Home Improvement Loans F) Non-occupant Loans on Number Average Value Number Average Value Number Average Value Number Average Value Number Average Value
LOANS ORIGINATED 73 $66,024 125 $56,337 492 $54,365 65 $9,993 126 $46,952 APPLICATIONS APPROVED, NOT ACCEPTED 5 $64,674 26 $59,646 119 $55,090 17 $12,228 15 $51,010 APPLICATIONS DENIED 11 $59,005 53 $55,861 353 $53,488 125 $8,836 54 $37,537 APPLICATIONS WITHDRAWN 6 $81,010 17 $49,057 196 $58,335 14 $27,592 27 $46,952 FILES CLOSED FOR INCOMPLETENESS 2 $59,560 5 $67,584 52 $57,882 0 $0 0 $0
Aggregated Statistics For Year 2001(Based on 4 full and 6 partial tracts) A) FHA, FSA/RHS & VA B) Conventional C) Refinancings D) Home Improvement Loans F) Non-occupant Loans on Number Average Value Number Average Value Number Average Value Number Average Value Number Average Value
LOANS ORIGINATED 114 $61,072 87 $53,509 454 $50,717 128 $11,822 73 $38,600 APPLICATIONS APPROVED, NOT ACCEPTED 1 $50,680 22 $63,327 80 $59,009 57 $11,834 17 $45,314 APPLICATIONS DENIED 17 $50,346 76 $48,001 424 $53,784 200 $11,675 34 $39,110 APPLICATIONS WITHDRAWN 12 $56,271 17 $53,948 192 $51,904 8 $16,851 8 $47,591 FILES CLOSED FOR INCOMPLETENESS 2 $33,880 7 $64,730 50 $51,054 2 $24,400 3 $47,897
Aggregated Statistics For Year 2000(Based on 4 full and 6 partial tracts) A) FHA, FSA/RHS & VA B) Conventional C) Refinancings D) Home Improvement Loans E) Loans on Dwellings For 5+ Families F) Non-occupant Loans on Number Average Value Number Average Value Number Average Value Number Average Value Number Average Value Number Average Value
LOANS ORIGINATED 83 $53,149 81 $37,787 291 $44,448 126 $11,518 5 $185,118 62 $37,271 APPLICATIONS APPROVED, NOT ACCEPTED 4 $64,410 24 $49,046 94 $48,287 44 $17,754 0 $0 12 $45,826 APPLICATIONS DENIED 7 $36,141 98 $40,540 246 $43,860 233 $10,427 0 $0 42 $42,319 APPLICATIONS WITHDRAWN 7 $55,086 27 $33,514 115 $45,180 6 $22,580 1 $45,610 15 $49,295 FILES CLOSED FOR INCOMPLETENESS 0 $0 8 $41,172 42 $43,789 4 $32,693 0 $0 11 $38,570
Aggregated Statistics For Year 1999(Based on 2 full and 3 partial tracts) A) FHA, FSA/RHS & VA B) Conventional C) Refinancings D) Home Improvement Loans F) Non-occupant Loans on Number Average Value Number Average Value Number Average Value Number Average Value Number Average Value
LOANS ORIGINATED 55 $49,763 37 $40,949 191 $40,826 49 $11,546 32 $32,119 APPLICATIONS APPROVED, NOT ACCEPTED 2 $28,760 6 $37,287 61 $43,356 27 $16,449 6 $34,167 APPLICATIONS DENIED 2 $63,055 36 $46,178 115 $45,499 83 $8,834 9 $31,039 APPLICATIONS WITHDRAWN 2 $53,395 9 $48,234 83 $42,874 9 $26,516 8 $45,215 FILES CLOSED FOR INCOMPLETENESS 0 $0 2 $45,970 19 $43,089 0 $0 4 $31,050
Private Mortgage Insurance Companies Aggregated Statistics For Year 2009(Based on 2 partial tracts) A) Conventional Number Average Value
LOANS ORIGINATED 1 $16,220 APPLICATIONS APPROVED, NOT ACCEPTED 0 $0 APPLICATIONS DENIED 0 $0 APPLICATIONS WITHDRAWN 0 $0 FILES CLOSED FOR INCOMPLETENESS 0 $0
Aggregated Statistics For Year 2008(Based on 4 full and 4 partial tracts) A) Conventional B) Refinancings C) Non-occupant Loans on Number Average Value Number Average Value Number Average Value
LOANS ORIGINATED 3 $83,790 4 $72,300 2 $54,210 APPLICATIONS APPROVED, NOT ACCEPTED 2 $75,445 3 $117,863 0 $0 APPLICATIONS DENIED 2 $71,475 0 $0 0 $0 APPLICATIONS WITHDRAWN 1 $38,520 0 $0 1 $38,520 FILES CLOSED FOR INCOMPLETENESS 0 $0 0 $0 0 $0
Aggregated Statistics For Year 2007(Based on 4 full and 4 partial tracts) A) Conventional B) Refinancings C) Non-occupant Loans on Number Average Value Number Average Value Number Average Value
LOANS ORIGINATED 38 $71,023 25 $76,307 8 $67,092 APPLICATIONS APPROVED, NOT ACCEPTED 13 $90,682 6 $72,217 0 $0 APPLICATIONS DENIED 0 $0 0 $0 0 $0 APPLICATIONS WITHDRAWN 5 $97,936 5 $95,406 3 $91,660 FILES CLOSED FOR INCOMPLETENESS 0 $0 0 $0 0 $0
Aggregated Statistics For Year 2006(Based on 4 full and 4 partial tracts) A) Conventional B) Refinancings C) Non-occupant Loans on Number Average Value Number Average Value Number Average Value
LOANS ORIGINATED 22 $64,780 10 $72,911 6 $49,545 APPLICATIONS APPROVED, NOT ACCEPTED 2 $15,060 6 $68,165 2 $15,060 APPLICATIONS DENIED 3 $74,787 0 $0 0 $0 APPLICATIONS WITHDRAWN 0 $0 2 $62,540 0 $0 FILES CLOSED FOR INCOMPLETENESS 0 $0 0 $0 0 $0
Aggregated Statistics For Year 2005(Based on 4 full and 4 partial tracts) A) Conventional B) Refinancings C) Non-occupant Loans on Number Average Value Number Average Value Number Average Value
LOANS ORIGINATED 25 $68,417 26 $76,616 15 $55,353 APPLICATIONS APPROVED, NOT ACCEPTED 15 $82,029 7 $74,200 6 $86,398 APPLICATIONS DENIED 0 $0 0 $0 0 $0 APPLICATIONS WITHDRAWN 4 $92,692 2 $66,360 0 $0 FILES CLOSED FOR INCOMPLETENESS 0 $0 0 $0 0 $0
Aggregated Statistics For Year 2004(Based on 4 full and 4 partial tracts) A) Conventional B) Refinancings C) Non-occupant Loans on Number Average Value Number Average Value Number Average Value
LOANS ORIGINATED 57 $60,485 18 $70,136 23 $54,593 APPLICATIONS APPROVED, NOT ACCEPTED 19 $70,668 9 $72,707 8 $88,286 APPLICATIONS DENIED 2 $53,605 0 $0 2 $53,605 APPLICATIONS WITHDRAWN 5 $63,058 0 $0 4 $67,530 FILES CLOSED FOR INCOMPLETENESS 0 $0 0 $0 0 $0
Aggregated Statistics For Year 2003(Based on 4 full and 6 partial tracts) A) Conventional B) Refinancings C) Non-occupant Loans on Number Average Value Number Average Value Number Average Value
LOANS ORIGINATED 47 $69,415 42 $74,666 20 $60,989 APPLICATIONS APPROVED, NOT ACCEPTED 8 $79,655 26 $81,033 4 $85,372 APPLICATIONS DENIED 4 $81,250 2 $67,505 2 $87,360 APPLICATIONS WITHDRAWN 4 $69,002 2 $110,275 3 $38,003 FILES CLOSED FOR INCOMPLETENESS 3 $58,100 2 $52,615 1 $65,880
Aggregated Statistics For Year 2002(Based on 4 full and 4 partial tracts) A) Conventional B) Refinancings C) Non-occupant Loans on Number Average Value Number Average Value Number Average Value
LOANS ORIGINATED 41 $64,302 50 $64,938 23 $57,559 APPLICATIONS APPROVED, NOT ACCEPTED 16 $59,132 11 $83,083 10 $54,938 APPLICATIONS DENIED 2 $85,880 5 $71,852 0 $0 APPLICATIONS WITHDRAWN 1 $70,950 2 $77,430 1 $70,950 FILES CLOSED FOR INCOMPLETENESS 0 $0 1 $66,900 0 $0
Aggregated Statistics For Year 2001(Based on 4 full and 4 partial tracts) A) Conventional B) Refinancings C) Non-occupant Loans on Number Average Value Number Average Value Number Average Value
LOANS ORIGINATED 21 $47,697 21 $64,624 14 $45,979 APPLICATIONS APPROVED, NOT ACCEPTED 10 $58,530 7 $58,626 3 $41,660 APPLICATIONS DENIED 1 $109,470 4 $52,698 5 $64,052 APPLICATIONS WITHDRAWN 2 $39,150 0 $0 2 $39,150 FILES CLOSED FOR INCOMPLETENESS 0 $0 0 $0 0 $0
Aggregated Statistics For Year 2000(Based on 4 full and 4 partial tracts) A) Conventional B) Refinancings C) Non-occupant Loans on Number Average Value Number Average Value Number Average Value
LOANS ORIGINATED 34 $46,549 34 $51,007 19 $33,663 APPLICATIONS APPROVED, NOT ACCEPTED 2 $49,665 15 $65,459 3 $45,173 APPLICATIONS DENIED 3 $51,693 0 $0 2 $36,995 APPLICATIONS WITHDRAWN 2 $98,275 0 $0 2 $98,275 FILES CLOSED FOR INCOMPLETENESS 0 $0 0 $0 0 $0
Aggregated Statistics For Year 1999(Based on 2 full and 2 partial tracts) A) Conventional B) Refinancings C) Non-occupant Loans on Number Average Value Number Average Value Number Average Value
LOANS ORIGINATED 11 $52,838 10 $50,740 3 $47,837 APPLICATIONS APPROVED, NOT ACCEPTED 1 $27,470 1 $34,840 1 $27,470 APPLICATIONS DENIED 0 $0 2 $63,020 1 $24,420 APPLICATIONS WITHDRAWN 0 $0 0 $0 0 $0 FILES CLOSED FOR INCOMPLETENESS 0 $0 0 $0 0 $0
2002 - 2018 National Fire Incident Reporting System (NFIRS) incidents See full 2006 National Fire Incident Reporting System statistics for zip code 48229, Michigan
Most common first names in zip code 48229 among deceased individuals Name Count Lived (average)
John 130 72.6 years James 118 69.7 years William 103 68.1 years Mary 102 76.6 years Robert 78 68.0 years Charles 64 67.3 years Joseph 59 71.7 years George 57 70.2 years Willie 48 70.6 years Frank 40 75.9 years
Most common last names in zip code 48229 among deceased individuals Last name Count Lived (average)
Smith 67 69.3 years Johnson 44 72.7 years Williams 43 73.9 years Jones 34 71.3 years Brown 32 71.4 years Davis 27 72.5 years Thomas 22 71.2 years White 21 72.7 years Jackson 20 68.9 years Harris 20 74.7 years
Businesses in zip code 48229
Burger King: 1CVS: 1McDonald's: 1


 Nearest zip codes: 48218, 48217, 48146, 48192, 48122, 48209.
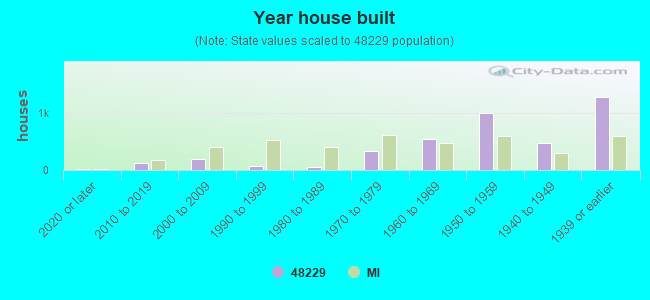


 According to the data from the years 2002 - 2018 the average number of fires per year is 29. The highest number of fires - 74 took place in 2014, and the least - 0 in 2008. The data has a growing trend.
 When looking into fire subcategories, the most reports belonged to: Structure Fires (51.6%), and Outside Fires (23.3%).