Estimated zip code population in 2022: 7,186 Zip code population in 2010: 7,903 Zip code population in 2000: 10,060
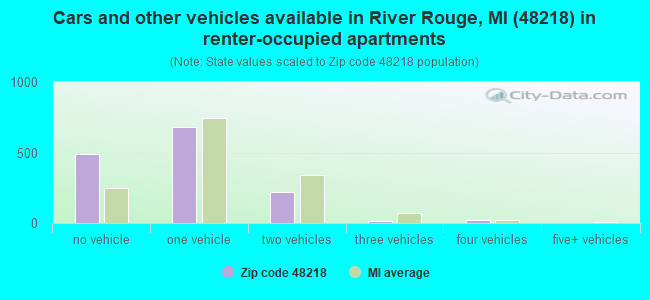
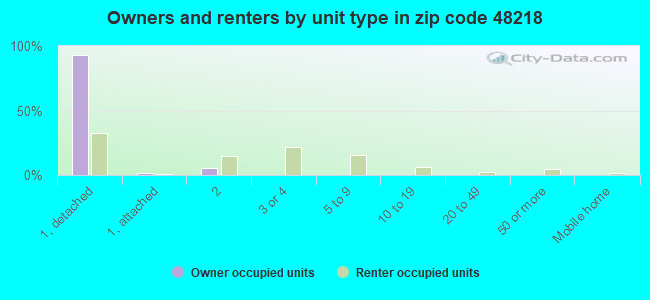
Houses and condos: 3,501 Renter-occupied apartments: 1,429
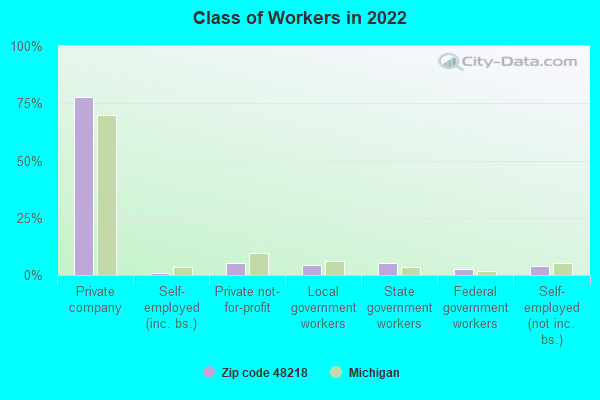
% of renters here:
49%
State:
27%
March 2022 cost of living index in zip code 48218: 93.2 (less than average, U.S. average is 100)
Land area: 2.7 sq. mi. Water area: 0.1 sq. mi.
Population density: 2,708 people per square mile
(average).
OSM Map
General Map
Google Map
MSN Map
OSM Map
General Map
Google Map
MSN Map
OSM Map
General Map
Google Map
MSN Map
OSM Map
General Map
Google Map
MSN Map
Please wait while loading the map...
Real estate property taxes paid for housing units in 2022:
This zip code:
2.8% ($1,519)
Michigan:
1.2% ($2,746)
Median real estate property taxes paid for housing units with mortgages in 2022: $2,263 (2.6%) Median real estate property taxes paid for housing units with no mortgage in 2022: $1,400 (2.8%)
Business Search- 14 Million verified businesses
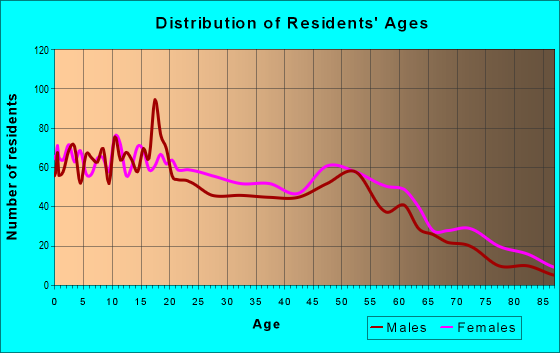
Males: 3,708
(51.6%)
Females: 3,478
(48.4%)
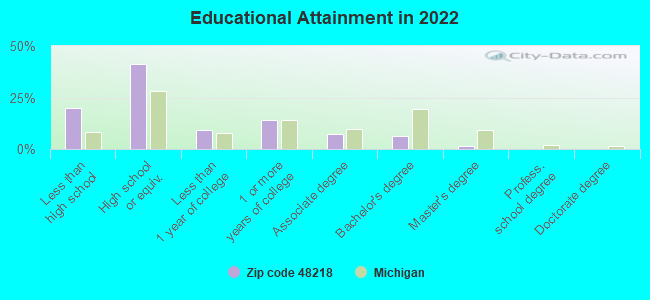
For population 25 years and over in 48218:
High school or higher: 79.4%
Bachelor's degree or higher: 8.3%
Graduate or professional degree: 2.0%
Unemployed: 10.7%
Mean travel time to work (commute): 23.0 minutes
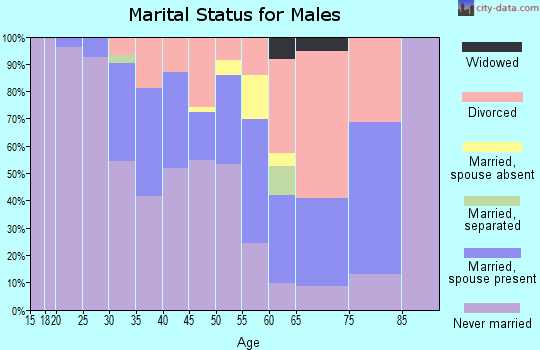
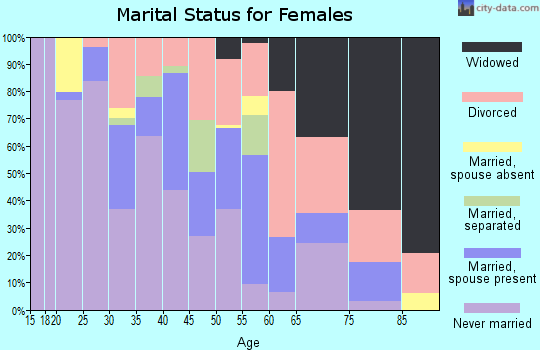
For population 15 years and over in 48218:
Never married: 53.1%
Now married: 25.5%
Separated: 0.2%
Widowed: 5.4%
Divorced: 15.7%
Zip code 48218 compared to state average:
Median household income significantly below state average.
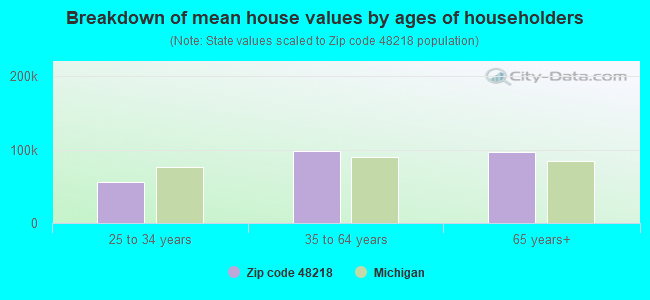
Median house value significantly below state average.
Unemployed percentage above state average.
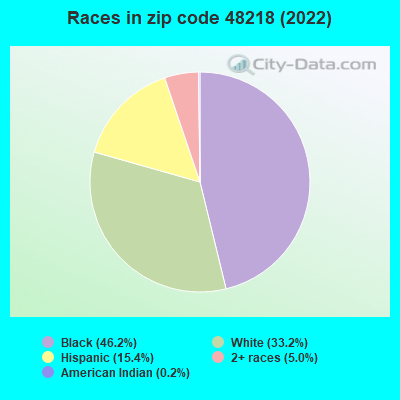
Black race population percentage significantly above state average.
Hispanic race population percentage above state average.
Median age below state average.
Foreign-born population percentage below state average.
Renting percentage above state average.
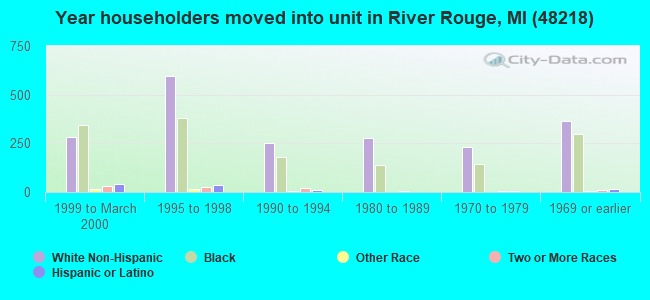
Length of stay since moving in significantly above state average.
House age above state average.
Number of college students below state average.
Percentage of population with a bachelor's degree or higher significantly below state average.
Averages for the 2020 tax year for zip code 48218, filed in 2021:
Average Adjusted Gross Income (AGI) in 2020: $30,079 (Individual Income Tax Returns)
Here:
$30,079
State:
$68,945
Salary/wage: $27,577 (reported on 77.2% of returns)
Here:
$27,577
State:
$57,142
(% of AGI for various income ranges: 906.2% for AGIs below $25k, 3048.6% for AGIs $25k-50k, 6548.6% for AGIs $50k-75k, 9341.2% for AGIs $75k-100k, 19640.0% for AGIs $100k-200k)
Taxable interest for individuals: $212 (reported on 10.3% of returns)
This zip code:
$212
Michigan:
$1,630
(% of AGI for various income ranges: 3.1% for AGIs below $25k, 1.4% for AGIs $25k-50k, 4.1% for AGIs $50k-75k, 22.5% for AGIs $100k-200k)
Ordinary dividends: $786 (reported on 2.3% of returns)
Here:
$786
State:
$6,972
(% of AGI for various income ranges: 1.0% for AGIs below $25k, 1.7% for AGIs $25k-50k, 36.2% for AGIs $75k-100k)
Net capital gain/loss in AGI: +$450 (reported on 1.9% of returns)
Here:
+$450
State:
+$20,064
(% of AGI for various income ranges: 0.3% for AGIs below $25k, 10.5% for AGIs $50k-75k)
Profit/loss from business: +$1,558 (reported on 17.7% of returns)
Here:
+$1,558
State:
+$11,172
(% of AGI for various income ranges: 76.3% for AGIs below $25k, 17.0% for AGIs $25k-50k)
Taxable individual retirement arrangement distribution: $12,229 (reported on 2.3% of returns)
48218:
$12,229
Michigan:
$19,803
(% of AGI for various income ranges: 23.5% for AGIs below $25k, 257.7% for AGIs $50k-75k)
Total itemized deductions: $23,850 (reported on 1.9% of returns)
Here:
$23,850
State:
$34,117
(% of AGI for various income ranges: 85.7% for AGIs $25k-50k, 900.0% for AGIs $75k-100k)
Charity contributions: $9,420 (reported on 1.6% of returns)
Here:
$9,420
State:
$13,548
(% of AGI for various income ranges: 22.5% for AGIs $25k-50k, 355.0% for AGIs $75k-100k)
Taxes paid: $5,550 (reported on 1.9% of returns)
48218:
$5,550
State:
$7,972
(% of AGI for various income ranges: 18.0% for AGIs $25k-50k, 230.0% for AGIs $75k-100k)
Earned income credit: $2,808 (reported on 36.0% of returns)
Here:
$2,808
State:
$2,251
(% of AGI for various income ranges: 169.6% for AGIs below $25k, 127.6% for AGIs $25k-50k)
Percentage of individuals using paid preparers for their 2020 taxes: 92.3%
Here:
92%
State:
93%
(% for various income ranges: 93.2% for AGIs below $25k, 92.9% for AGIs $25k-50k, 90.3% for AGIs $50k-75k, 81.8% for AGIs $75k-100k, 87.5% for AGIs $100k-200k)
Averages for the 2012 tax year for zip code 48218, filed in 2013:
Average Adjusted Gross Income (AGI) in 2012: $25,470 (Individual Income Tax Returns)
Here:
$25,470
State:
$55,609
Salary/wage: $24,016 (reported on 78.1% of returns)
Here:
$24,016
State:
$46,782
(% of AGI for various income ranges: 65.9% for AGIs below $25k, 78.8% for AGIs $25k-50k, 78.5% for AGIs $50k-75k, 80.5% for AGIs $75k-100k, 63.6% for AGIs $100k-200k)
Taxable interest for individuals: $626 (reported on 13.9% of returns)
This zip code:
$626
Michigan:
$1,491
(% of AGI for various income ranges: 0.5% for AGIs below $25k, 0.4% for AGIs $25k-50k, 0.2% for AGIs $50k-75k, 0.1% for AGIs $75k-100k)
Ordinary dividends: $838 (reported on 4.3% of returns)
Here:
$838
State:
$6,225
(% of AGI for various income ranges: 0.3% for AGIs below $25k, 0.2% for AGIs $50k-75k)
Net capital gain/loss in AGI: +$600 (reported on 2.3% of returns)
Here:
+$600
State:
+$9,326
(% of AGI for various income ranges: 0.3% for AGIs $50k-75k)
Profit/loss from business: +$7,576 (reported on 19.2% of returns)
Here:
+$7,576
State:
+$11,523
(% of AGI for various income ranges: 18.1% for AGIs below $25k, 0.8% for AGIs $25k-50k, 0.6% for AGIs $50k-75k)
Taxable individual retirement arrangement distribution: $7,108 (reported on 4.0% of returns)
48218:
$7,108
Michigan:
$15,298
(% of AGI for various income ranges: 1.2% for AGIs below $25k, 1.0% for AGIs $25k-50k, 2.3% for AGIs $50k-75k)
Total itemized deductions: $14,200 (26% of AGI, reported on 11.9% of returns)
Here:
$14,200
State:
$21,628
Here:
26.0% of AGI
State:
18.4% of AGI
(% of AGI for various income ranges: 2.5% for AGIs below $25k, 7.4% for AGIs $25k-50k, 10.0% for AGIs $50k-75k, 8.7% for AGIs $75k-100k, 8.0% for AGIs $100k-200k)
Charity contributions: $3,904 (reported on 8.9% of returns)
Here:
$3,904
State:
$4,225
(% of AGI for various income ranges: 0.3% for AGIs below $25k, 1.3% for AGIs $25k-50k, 2.4% for AGIs $50k-75k, 2.2% for AGIs $75k-100k, 1.8% for AGIs $100k-200k)
Taxes paid: $5,063 (reported on 11.6% of returns)
48218:
$5,063
State:
$8,327
(% of AGI for various income ranges: 0.5% for AGIs below $25k, 2.3% for AGIs $25k-50k, 3.4% for AGIs $50k-75k, 3.8% for AGIs $75k-100k, 3.9% for AGIs $100k-200k)
Earned income credit: $2,865 (reported on 42.1% of returns)
Here:
$2,865
State:
$2,306
(% of AGI for various income ranges: 14.3% for AGIs below $25k, 1.6% for AGIs $25k-50k)
Percentage of individuals using paid preparers for their 2012 taxes: 59.9%
Here:
60%
State:
57%
(% for various income ranges: 61.3% for AGIs below $25k, 55.1% for AGIs $25k-50k, 64.0% for AGIs $50k-75k, 55.6% for AGIs $75k-100k, 60.0% for AGIs $100k-200k)
Averages for the 2004 tax year for zip code 48218, filed in 2005:
Average Adjusted Gross Income (AGI) in 2004: $27,319 (Individual Income Tax Returns)
Here:
$27,319
State:
$48,204
Salary/wage: $26,251 (reported on 85.2% of returns)
Here:
$26,251
State:
$42,791
(% of AGI for various income ranges: 74.6% for AGIs below $10k, 77.7% for AGIs $10k-25k, 84.8% for AGIs $25k-50k, 84.9% for AGIs $50k-75k, 82.8% for AGIs $75k-100k, 71.6% for AGIs over 100k)
Taxable interest for individuals: $713 (reported on 27.2% of returns)
This zip code:
$713
Michigan:
$1,725
(% of AGI for various income ranges: 1.9% for AGIs below $10k, 1.0% for AGIs $10k-25k, 0.5% for AGIs $25k-50k, 1.0% for AGIs $50k-75k, 0.3% for AGIs $75k-100k, 0.2% for AGIs over 100k)
Taxable dividends: $780 (reported on 7.3% of returns)
Here:
$780
State:
$3,420
(% of AGI for various income ranges: 0.2% for AGIs below $10k, 0.4% for AGIs $10k-25k, 0.1% for AGIs $25k-50k, 0.3% for AGIs $50k-75k, 0.1% for AGIs $75k-100k, 0.0% for AGIs over 100k)
Net capital gain/loss: +$142 (reported on 3.4% of returns)
Here:
+$142
State:
+$8,532
(% of AGI for various income ranges: -0.5% for AGIs below $10k, 0.1% for AGIs $10k-25k, 0.0% for AGIs $25k-50k, 0.1% for AGIs $50k-75k, -0.0% for AGIs $75k-100k)
Profit/loss from business: +$4,488 (reported on 7.2% of returns)
Here:
+$4,488
State:
+$9,547
(% of AGI for various income ranges: 7.2% for AGIs below $10k, 2.7% for AGIs $10k-25k, 0.6% for AGIs $25k-50k, 0.6% for AGIs $50k-75k, 0.1% for AGIs $75k-100k)
IRA payment deduction: $1,562 (reported on 0.5% of returns)
48218:
$1,562
Michigan:
$2,875
Total itemized deductions: $12,651 (25% of AGI, reported on 19.2% of returns)
Here:
$12,651
State:
$18,509
Here:
25.0% of AGI
State:
20.7% of AGI
(% of AGI for various income ranges: 2.3% for AGIs below $10k, 4.7% for AGIs $10k-25k, 9.5% for AGIs $25k-50k, 11.6% for AGIs $50k-75k, 10.2% for AGIs $75k-100k, 9.6% for AGIs over 100k)
Charity contributions deductions: $3,166 (6% of AGI, reported on 16.6% of returns)
Here:
$3,166
State:
$3,365
Here:
6.0% of AGI
State:
3.6% of AGI
(% of AGI for various income ranges: 0.6% for AGIs $10k-25k, 2.0% for AGIs $25k-50k, 2.7% for AGIs $50k-75k, 2.4% for AGIs $75k-100k, 2.9% for AGIs over 100k)
Total tax: $3,478 (reported on 59.5% of returns)
48218:
$3,478
State:
$7,691
(% of AGI for various income ranges: 1.8% for AGIs below $10k, 3.6% for AGIs $10k-25k, 6.0% for AGIs $25k-50k, 9.3% for AGIs $50k-75k, 11.3% for AGIs $75k-100k, 17.2% for AGIs over 100k)
Earned income credit: $1,895 (reported on 31.0% of returns)
Here:
$1,895
State:
$1,737
Percentage of individuals using paid preparers for their 2004 taxes: 66.4%
Here:
66%
State:
60%
(% for various income ranges: 62.7% for AGIs below $10k, 70.3% for AGIs $10k-25k, 65.6% for AGIs $25k-50k, 70.7% for AGIs $50k-75k, 61.9% for AGIs $75k-100k, 54.7% for AGIs over 100k)
Household received Food Stamps/SNAP in the past 12 months: 1,343 Household did not receive Food Stamps/SNAP in the past 12 months: 1,690
Women who had a birth in the past 12 months: 51 (16 now married, 33 unmarried) Women who did not have a birth in the past 12 months: 1,836 (353 now married, 1,491 unmarried)
Housing units in zip code 48218 with a mortgage: 371 (18 second mortgage, 5 both second mortgage and home equity loan) Median monthly owner costs for units with a mortgage: $1,037 Median monthly owner costs for units without a mortgage: $447
Residents with income below the poverty level in 2022:
This zip code:
44.9%
Whole state:
13.4%
Residents with income below 50% of the poverty level in 2022:
This zip code:
20.8%
Whole state:
6.9%
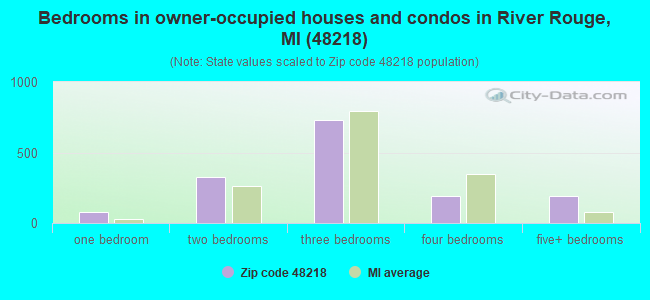
Median number of rooms in houses and condos:
Here:
6.0
State:
6.5
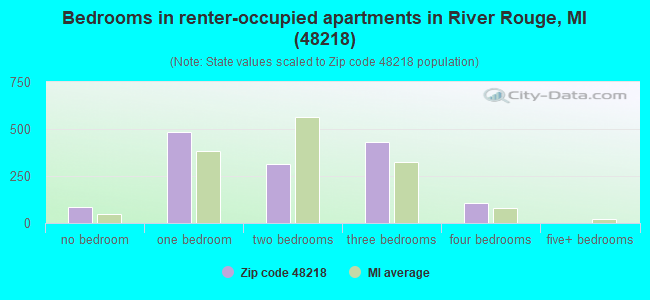
Median number of rooms in apartments:
Here:
4.5
State:
4.3
Notable locations in this zip code not listed on our city pages
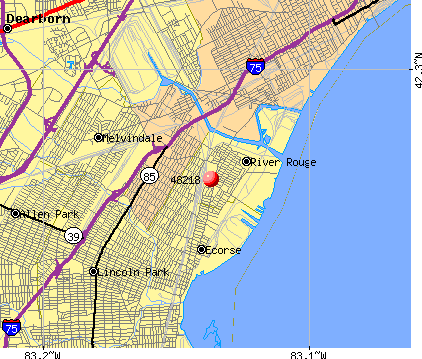
Notable locations in zip code 48218: River Rouge City Hall (A), City of River Rouge Fire Department (B), River Rouge Fire Station (C), River Rouge Police Station (D). Display/hide their locations on the map
Churches in zip code 48218 include: Church of Christ Holford (A), Union Second Baptist Church (B), Rouge Free Will Baptist Church (C), Love Joy Missionary Baptist Church (D), Saint Hilda's Episcopal Church (E), Few Memorial Christian Methodist Episcopal Church (F), Goodell Street Missionary Baptist Church (G), Gordy Memorial Church of God in Christ (H). Display/hide their locations on the map
In group quarters: 2 (-1 institutionalized population)
Size of family households: 607 2-persons, 258 3-persons, 252 4-persons, 62 5-persons, 127 6-persons, 63 7-or-more-persons
Size of nonfamily households: 1,430 1-person, 152 2-persons, 16 6-persons
360 married couples with children.
908 single-parent households (223 men, 685 women).
87.5% of residents of 48218 zip code speak English at home.
11.2% of residents speak Spanish at home (62% very well, 17% well, 7% not well, 14% not at all).
0.7% of residents speak other Indo-European language at home (100% very well).
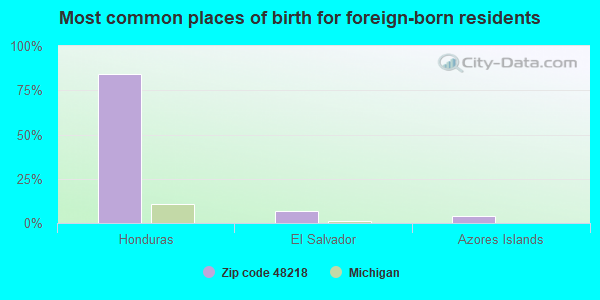
Foreign born population: 312 (4.3%) (50.2% of them are naturalized citizens)
This zip code:
4.3%
Whole state:
6.9%
84%Honduras
7%El Salvador
4%Azores Islands
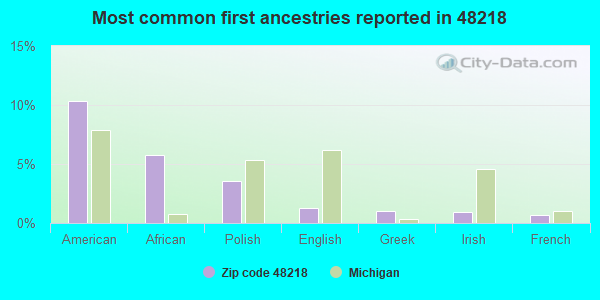
10%American
6%African
4%Polish
1%English
1%Greek
1%Irish
1%French
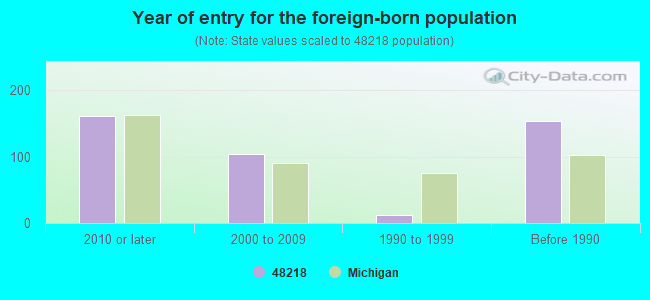
Year of entry for the foreign-born population
1622010 or later
1042000 to 2009
121990 to 1999
154Before 1990
Major facilities with environmental interests located in this zip code:
DETROIT EDISON RIVER ROUGE POWER PLANT (1 BELANGER PARK DR. in RIVER ROUGE, MI)
AIR MAJOR (AIRS/AFS) AIR PROGRAM (Clean Air Markets Division Business System) ENFORCEMENT/COMPLIANCE ACTIVITY (Integrated Compliance Information System) CRITERIA AND HAZARDOUS AIR POLLUTANT INVENTORY (Inventory of air pollution sources) National Pollutant Discharge Elimination System MAJOR (Tracking pollutant discharge elimination systems) - permit Conditionally Exempt Small Quantity Generators, less than 100 kg/month of hazardous waste (Resource Conservation and Recovery Act (tracking hazardous waste)) - notification USED OIL PROGRAM (Resource Conservation and Recovery Act (tracking hazardous waste)) COMMUNITY WATER SYSTEM (SDWIS) TRI REPORTER (Tracking of toxic chemicals releasing facilities) Business SIC classification: ELECTRIC SERVICES; ELECTRIC AND OTHER SERVICES COMBINED Business NAICS classification: FOSSIL FUEL ELECTRIC POWER GENERATION. Organizations: DETROIT EDISON COMPANY (CONTACT/GENERAL)
, DTE RIVER ROUGE NO. 1, LLC (CONTACT/OPERATOR)
, DTE RIVER ROUGE NO. 1, LLC (OWNER/OPERATOR)
Alternative names: DECO-RIVER ROUGE PLANT, DETROIT EDISON CO RIVER ROUGE, DETROIT EDISON CO RIVER ROUGE PWR PLT, DETROIT EDISON - ENV. MGT. & RESOURCES, RIVER ROUGE PLANT
FRITZ PRODUCTS INC. (255 MARION in RIVER ROUGE, MI)
AIR MINOR (AIRS/AFS) - ICIS-, ENFORCEMENT/COMPLIANCE ACTIVITY ENFORCEMENT/COMPLIANCE ACTIVITY (Integrated Compliance Information System) CRITERIA AND HAZARDOUS AIR POLLUTANT INVENTORY (Inventory of air pollution sources) TRI REPORTER (Tracking of toxic chemicals releasing facilities) Business SIC classification: SECONDARY SMELTING AND REFINING OF NONFERROUS METALS
ES & R INC (225 MARION RD in RIVER ROUGE, MI)
(Integrated Compliance Information System) - ICIS-05-1996-0365, FORMAL ENFORCEMENT ACTION (Resource Conservation and Recovery Act (tracking hazardous waste)) Business NAICS classification: RESIDENTIAL REMODELERS.
ANN VISGER PRIMARY SCHOOL (11121 W. JEFFERSON AVENUE in RIVER ROUGE, MI)
(National Center for Education Statistics) - STATE ID-00105 Organizations: RIVER ROUGE SCHOOL DISTRICT (SCHOOL DISTRICT)
DUNN MIDDLE SCHOOL (163 BURKE STREET in RIVER ROUGE, MI)
(National Center for Education Statistics) - STATE ID-00970 Organizations: RIVER ROUGE SCHOOL DISTRICT (SCHOOL DISTRICT)
GREAT LAKES STEEL 80 MILL (GREAT LAKE AVE in RIVER ROUGE, MI)
(Integrated Compliance Information System) - ICIS-05-1979-0005, FORMAL ENFORCEMENT ACTION Business SIC classification: STEEL WORKS, BLAST FURNACES (INCLUDING COKE OVENS), AND ROLLING MILLS
GREAT LAKES STEEL ZUG ISLAND (ZUG ISLAND DR 2BLKS E OF JEFF in RIVER ROUGE, MI)
(Integrated Compliance Information System) - ICIS-05-1978-0049, FORMAL ENFORCEMENT ACTION, ICIS-05-1979-0005, ICIS-05-1982-0057, ICIS-05-1983-0029, Business SIC classification: STEEL WORKS, BLAST FURNACES (INCLUDING COKE OVENS), AND ROLLING MILLS
FABRICON PRODUCTS INC (1721 W. PLEASANT in RIVER ROUGE, MI)
AIR SYNTHETIC MINOR (AIRS/AFS) CRITERIA AND HAZARDOUS AIR POLLUTANT INVENTORY (Inventory of air pollution sources) HAZARDOUS WASTE BIENNIAL REPORTER (Resource Conservation and Recovery Act (tracking hazardous waste)) Large Quantity Generators, more that 1000 kg of hazardous waste/month (Resource Conservation and Recovery Act (tracking hazardous waste)) Business SIC classification: PACKAGING PAPER AND PLASTICS FILM, COATED AND LAMINATED Business NAICS classification: COMMERCIAL FLEXOGRAPHIC PRINTING.
AMOCO OIL CO 5169 (16093 W JEFFERSON in RIVER ROUGE, MI)
(Resource Conservation and Recovery Act (tracking hazardous waste)) Organizations: AMOCO OIL COMPANY (CONTACT/OWNER)
AMOCO OIL CO 5284 (6150 CHALMER AND HARPER in DETROIT, MI)
(Resource Conservation and Recovery Act (tracking hazardous waste)) Organizations: AMOCO OIL COMPANY (CONTACT/OWNER)
BASF NICHOLSON TERMINAL AND DOCK (360 GREAT LAKES AVE in RIVER ROUGE, MI)
(Resource Conservation and Recovery Act (tracking hazardous waste))
GREAT LAKES RAIL CAR REPAIR SERVICES INC (250 HALTINER ST in RIVER ROUGE, MI)
Conditionally Exempt Small Quantity Generators, less than 100 kg/month of hazardous waste (Resource Conservation and Recovery Act (tracking hazardous waste)) Organizations: MARK KORTE (CONTACT/OPERATOR)
, MATTHEW KORTE (CONTACT/OPERATOR)
, MARK A. KORTE, PRESIDENT (CONTACT/OPERATOR)
AMERICAN STEEL WORKS (130 W PLEASANT in RIVER ROUGE, MI)
Conditionally Exempt Small Quantity Generators, less than 100 kg/month of hazardous waste (Resource Conservation and Recovery Act (tracking hazardous waste)) Organizations: GREAT LAKES WELDING CO (CONTACT/OWNER)
, GREAT LAKES WELDING (CONTACT/OWNER)
Housing units lacking complete plumbing facilities: 4.2% Housing units lacking complete kitchen facilities: 6.6%
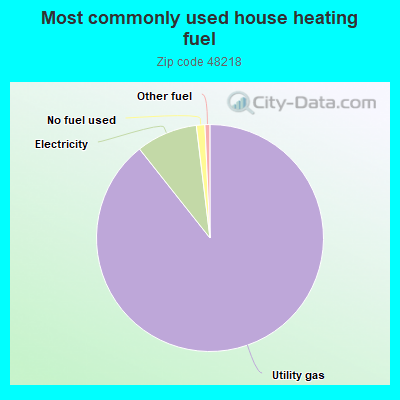
88.9%Utility gas
8.7%Electricity
1.2%No fuel used
0.7%Other fuel
Population in 1990: 11,314.
Place of birth for U.S.-born residents:
This state: 5,766
Northeast: 169
Midwest: 278
South: 470
West: 56
58% of the 48218 zip code residents lived in the same house 5 years ago. Out of people who lived in different houses, 91% lived in this county. Out of people who lived in different counties, 50% lived in Michigan.
90% of the 48218 zip code residents lived in the same house 1 year ago. Out of people who lived in different houses, 90% moved from this county. Out of people who lived in different houses, 1% moved from different county within same state. Out of people who lived in different houses, 6% moved from abroad.
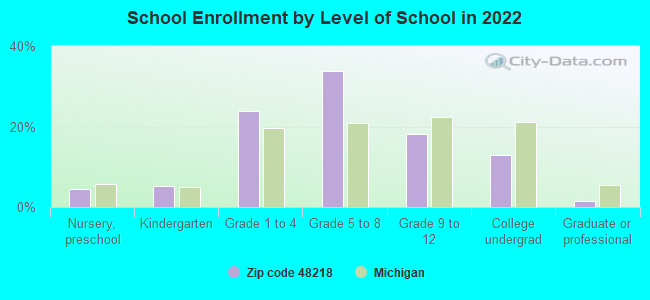
Private vs. public school enrollment:
Students in private schools in grades 1 to 8 (elementary and middle school): 78
Here:
9.1%
Michigan:
12.4%
Students in private schools in grades 9 to 12 (high school): 5
Here:
2.1%
Michigan:
9.8%
Students in private undergraduate colleges:
Here:
0.0%
Michigan:
14.9%
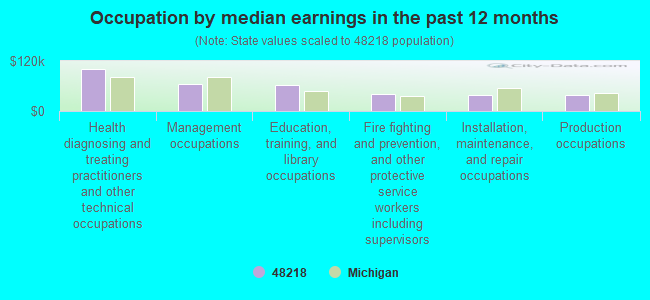
Occupation by median earnings in the past 12 months ($)
101,607Health diagnosing and treating practitioners and other technical occupations
63,956Management occupations
62,691Education, training, and library occupations
41,917Fire fighting and prevention, and other protective service workers including supervisors
38,678Installation, maintenance, and repair occupations
38,003Production occupations
Top industries in this zip code by the number of employees in 2005:
2002 - 2018 National Fire Incident Reporting System (NFIRS) incidents
Based on the data from the years 2002 - 2018 the average number of fires per year is 22. The highest number of fires - 75 took place in 2004, and the least - 0 in 2008. The data has a decreasing trend.
When looking into fire subcategories, the most reports belonged to: Structure Fires (49.3%), and Outside Fires (22.1%).
Fire incident types reported to NFIRS in Zip Code 48218
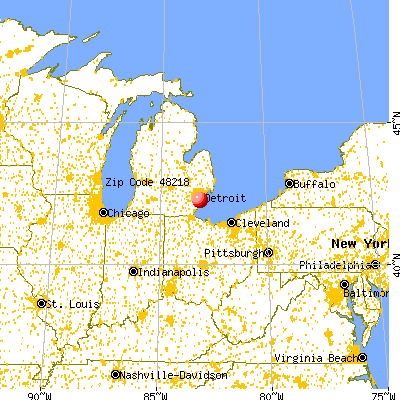


 Nearest zip codes: 48229, 48217, 48209, 48122, 48120, 48146.
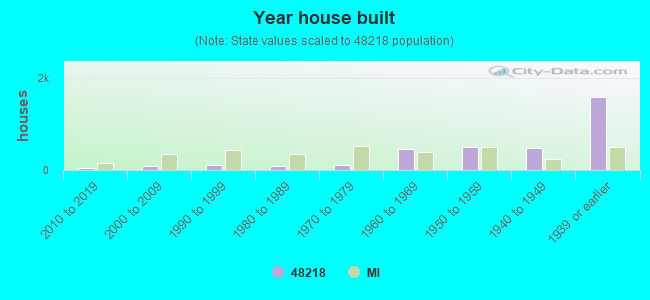


 Based on the data from the years 2002 - 2018 the average number of fires per year is 22. The highest number of fires - 75 took place in 2004, and the least - 0 in 2008. The data has a decreasing trend.
 When looking into fire subcategories, the most reports belonged to: Structure Fires (49.3%), and Outside Fires (22.1%).