Estimated zip code population in 2022: 22,029 Zip code population in 2010: 21,273 Zip code population in 2000: 22,648
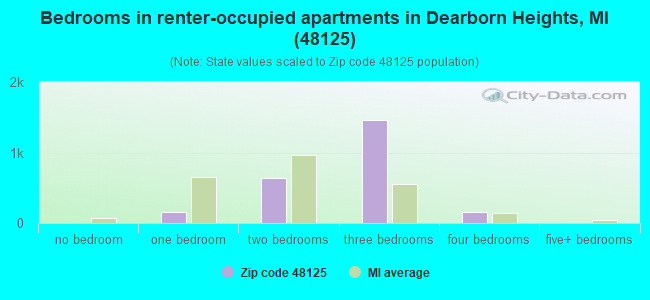
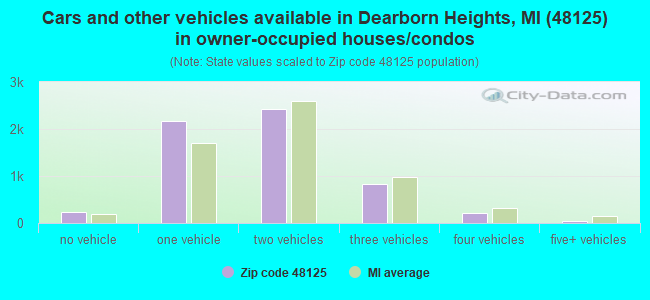
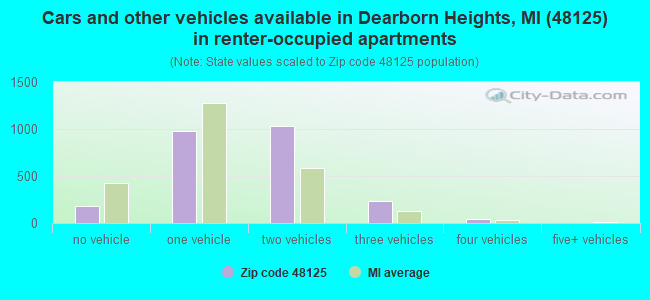
Houses and condos: 8,843 Renter-occupied apartments: 2,478
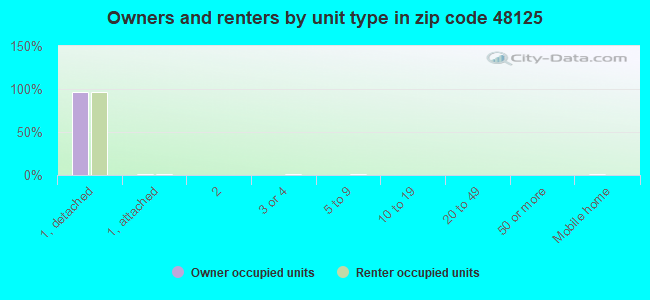
% of renters here:
30%
State:
27%
March 2022 cost of living index in zip code 48125: 95.4 (near average, U.S. average is 100)
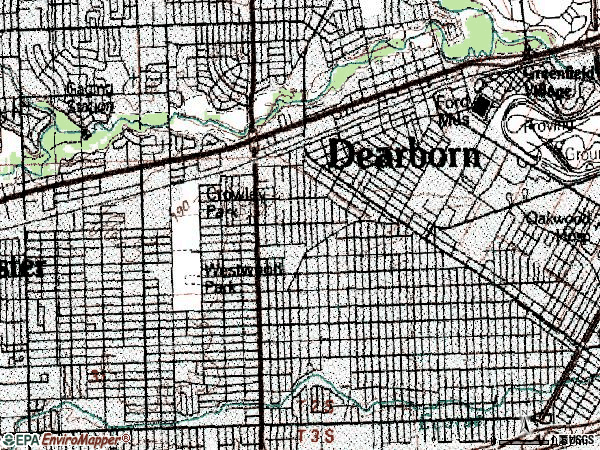
Land area: 4.0 sq. mi. Water area: 0.0 sq. mi.
Population density: 5,439 people per square mile
(average).
OSM Map
General Map
Google Map
MSN Map
OSM Map
General Map
Google Map
MSN Map
OSM Map
General Map
Google Map
MSN Map
OSM Map
General Map
Google Map
MSN Map
Please wait while loading the map...
Real estate property taxes paid for housing units in 2022:
This zip code:
1.9% ($2,310)
Michigan:
1.2% ($2,746)
Median real estate property taxes paid for housing units with mortgages in 2022: $2,432 (1.9%) Median real estate property taxes paid for housing units with no mortgage in 2022: $2,183 (1.9%)
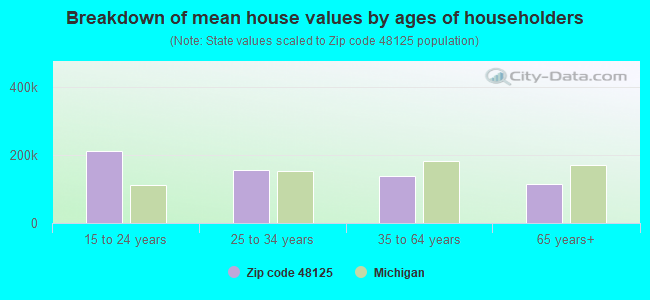
Estimated median house/condo value in 2022: $119,286
48125:
$119,286
Michigan:
$224,400
According to our research of Michigan and other state lists, there were 55 registered sex offenders living in 48125 zip code as of April 27, 2024. The ratio of all residents to sex offenders in zip code 48125 is 375 to 1. The ratio of registered sex offenders to all residents in this zip code is near the state average.
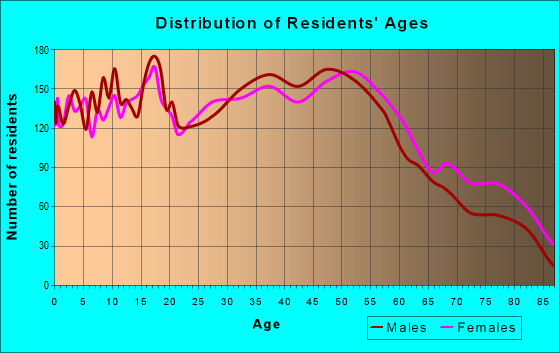
Median resident age:
This zip code:
38.9 years
Michigan median age:
40.3 years
Average household size:
This zip code:
2.6 people
Michigan:
2.4 people
Averages for the 2020 tax year for zip code 48125, filed in 2021:
Average Adjusted Gross Income (AGI) in 2020: $40,910 (Individual Income Tax Returns)
Here:
$40,910
State:
$68,945
Salary/wage: $38,572 (reported on 75.6% of returns)
Here:
$38,572
State:
$57,142
(% of AGI for various income ranges: 849.6% for AGIs below $25k, 3181.5% for AGIs $25k-50k, 6420.0% for AGIs $50k-75k, 9643.5% for AGIs $75k-100k, 15369.8% for AGIs $100k-200k)
Taxable interest for individuals: $587 (reported on 20.9% of returns)
This zip code:
$587
Michigan:
$1,630
(% of AGI for various income ranges: 10.7% for AGIs below $25k, 12.7% for AGIs $25k-50k, 19.6% for AGIs $50k-75k, 20.5% for AGIs $75k-100k, 44.2% for AGIs $100k-200k)
Ordinary dividends: $2,132 (reported on 9.3% of returns)
Here:
$2,132
State:
$6,972
(% of AGI for various income ranges: 11.1% for AGIs below $25k, 14.3% for AGIs $25k-50k, 24.5% for AGIs $50k-75k, 52.6% for AGIs $75k-100k, 134.0% for AGIs $100k-200k)
Net capital gain/loss in AGI: +$4,338 (reported on 8.6% of returns)
Here:
+$4,338
State:
+$20,064
(% of AGI for various income ranges: 4.6% for AGIs below $25k, 18.6% for AGIs $25k-50k, 26.5% for AGIs $50k-75k, 120.4% for AGIs $75k-100k, 348.8% for AGIs $100k-200k)
Profit/loss from business: +$5,311 (reported on 15.5% of returns)
Here:
+$5,311
State:
+$11,172
(% of AGI for various income ranges: 126.8% for AGIs below $25k, 89.4% for AGIs $25k-50k, 67.4% for AGIs $50k-75k, 86.8% for AGIs $75k-100k, 304.7% for AGIs $100k-200k)
Taxable individual retirement arrangement distribution: $11,926 (reported on 6.0% of returns)
48125:
$11,926
Michigan:
$19,803
(% of AGI for various income ranges: 42.3% for AGIs below $25k, 54.8% for AGIs $25k-50k, 113.0% for AGIs $50k-75k, 246.8% for AGIs $75k-100k, 527.0% for AGIs $100k-200k)
Total itemized deductions: $24,871 (reported on 2.2% of returns)
Here:
$24,871
State:
$34,117
(% of AGI for various income ranges: 17.2% for AGIs below $25k, 43.0% for AGIs $25k-50k, 122.2% for AGIs $50k-75k, 162.1% for AGIs $75k-100k, 431.6% for AGIs $100k-200k)
Charity contributions: $7,233 (reported on 1.6% of returns)
Here:
$7,233
State:
$13,548
(% of AGI for various income ranges: 7.8% for AGIs $25k-50k, 32.7% for AGIs $50k-75k, 31.4% for AGIs $75k-100k, 120.0% for AGIs $100k-200k)
Taxes paid: $5,979 (reported on 2.2% of returns)
48125:
$5,979
State:
$7,972
(% of AGI for various income ranges: 2.3% for AGIs below $25k, 8.0% for AGIs $25k-50k, 36.3% for AGIs $50k-75k, 37.9% for AGIs $75k-100k, 114.4% for AGIs $100k-200k)
Earned income credit: $2,451 (reported on 21.1% of returns)
Here:
$2,451
State:
$2,251
(% of AGI for various income ranges: 109.1% for AGIs below $25k, 81.5% for AGIs $25k-50k, 1.4% for AGIs $50k-75k)
Percentage of individuals using paid preparers for their 2020 taxes: 93.5%
Here:
93%
State:
93%
(% for various income ranges: 93.6% for AGIs below $25k, 93.8% for AGIs $25k-50k, 93.0% for AGIs $50k-75k, 93.8% for AGIs $75k-100k, 92.6% for AGIs $100k-200k, 83.3% for AGIs over 200k)
Averages for the 2012 tax year for zip code 48125, filed in 2013:
Average Adjusted Gross Income (AGI) in 2012: $36,466 (Individual Income Tax Returns)
Here:
$36,466
State:
$55,609
Salary/wage: $34,811 (reported on 79.9% of returns)
Here:
$34,811
State:
$46,782
(% of AGI for various income ranges: 64.1% for AGIs below $25k, 77.7% for AGIs $25k-50k, 80.3% for AGIs $50k-75k, 82.2% for AGIs $75k-100k, 79.3% for AGIs $100k-200k, 51.8% for AGIs over 200k)
Taxable interest for individuals: $731 (reported on 28.4% of returns)
This zip code:
$731
Michigan:
$1,491
(% of AGI for various income ranges: 1.1% for AGIs below $25k, 0.5% for AGIs $25k-50k, 0.4% for AGIs $50k-75k, 0.5% for AGIs $75k-100k, 0.4% for AGIs $100k-200k, 0.2% for AGIs over 200k)
Ordinary dividends: $1,903 (reported on 12.4% of returns)
Here:
$1,903
State:
$6,225
(% of AGI for various income ranges: 1.0% for AGIs below $25k, 0.4% for AGIs $25k-50k, 0.6% for AGIs $50k-75k, 0.4% for AGIs $75k-100k, 1.2% for AGIs $100k-200k)
Net capital gain/loss in AGI: +$45 (reported on 8.1% of returns)
Here:
+$45
State:
+$9,326
(% of AGI for various income ranges: 0.4% for AGIs $100k-200k)
Profit/loss from business: +$7,731 (reported on 11.4% of returns)
Here:
+$7,731
State:
+$11,523
(% of AGI for various income ranges: 9.8% for AGIs below $25k, 1.9% for AGIs $25k-50k, 0.5% for AGIs $50k-75k, 1.3% for AGIs $75k-100k, 0.4% for AGIs $100k-200k)
Taxable individual retirement arrangement distribution: $10,903 (reported on 9.1% of returns)
48125:
$10,903
Michigan:
$15,298
(% of AGI for various income ranges: 2.8% for AGIs below $25k, 1.8% for AGIs $25k-50k, 2.4% for AGIs $50k-75k, 2.9% for AGIs $75k-100k, 5.2% for AGIs $100k-200k)
Total itemized deductions: $14,630 (23% of AGI, reported on 21.1% of returns)
Here:
$14,630
State:
$21,628
Here:
22.5% of AGI
State:
18.4% of AGI
(% of AGI for various income ranges: 6.1% for AGIs below $25k, 7.5% for AGIs $25k-50k, 8.7% for AGIs $50k-75k, 8.7% for AGIs $75k-100k, 10.4% for AGIs $100k-200k, 15.4% for AGIs over 200k)
Charity contributions: $2,288 (reported on 17.1% of returns)
Here:
$2,288
State:
$4,225
(% of AGI for various income ranges: 0.6% for AGIs below $25k, 0.8% for AGIs $25k-50k, 1.2% for AGIs $50k-75k, 1.3% for AGIs $75k-100k, 1.6% for AGIs $100k-200k, 1.0% for AGIs over 200k)
Taxes paid: $4,846 (reported on 21.1% of returns)
48125:
$4,846
State:
$8,327
(% of AGI for various income ranges: 1.2% for AGIs below $25k, 2.1% for AGIs $25k-50k, 3.0% for AGIs $50k-75k, 3.2% for AGIs $75k-100k, 4.4% for AGIs $100k-200k, 5.2% for AGIs over 200k)
Earned income credit: $2,374 (reported on 22.4% of returns)
Here:
$2,374
State:
$2,306
(% of AGI for various income ranges: 7.4% for AGIs below $25k, 1.1% for AGIs $25k-50k)
Percentage of individuals using paid preparers for their 2012 taxes: 59.9%
Here:
60%
State:
57%
(% for various income ranges: 59.6% for AGIs below $25k, 58.7% for AGIs $25k-50k, 61.7% for AGIs $50k-75k, 59.1% for AGIs $75k-100k, 64.4% for AGIs $100k-200k, 75.0% for AGIs over 200k)
Averages for the 2004 tax year for zip code 48125, filed in 2005:
Average Adjusted Gross Income (AGI) in 2004: $37,565 (Individual Income Tax Returns)
Here:
$37,565
State:
$48,204
Salary/wage: $36,710 (reported on 83.9% of returns)
Here:
$36,710
State:
$42,791
(% of AGI for various income ranges: 70.6% for AGIs below $10k, 63.8% for AGIs $10k-25k, 82.2% for AGIs $25k-50k, 86.1% for AGIs $50k-75k, 89.2% for AGIs $75k-100k, 79.5% for AGIs over 100k)
Taxable interest for individuals: $1,093 (reported on 44.7% of returns)
This zip code:
$1,093
Michigan:
$1,725
(% of AGI for various income ranges: 4.8% for AGIs below $10k, 2.8% for AGIs $10k-25k, 1.1% for AGIs $25k-50k, 1.0% for AGIs $50k-75k, 0.8% for AGIs $75k-100k, 1.1% for AGIs over 100k)
Taxable dividends: $1,453 (reported on 18.8% of returns)
Here:
$1,453
State:
$3,420
(% of AGI for various income ranges: 1.8% for AGIs below $10k, 1.3% for AGIs $10k-25k, 0.6% for AGIs $25k-50k, 0.7% for AGIs $50k-75k, 0.3% for AGIs $75k-100k, 1.1% for AGIs over 100k)
Net capital gain/loss: +$1,811 (reported on 11.8% of returns)
Here:
+$1,811
State:
+$8,532
(% of AGI for various income ranges: -1.6% for AGIs below $10k, -0.2% for AGIs $10k-25k, 0.3% for AGIs $25k-50k, 0.3% for AGIs $50k-75k, 0.5% for AGIs $75k-100k, 2.9% for AGIs over 100k)
Profit/loss from business: +$5,084 (reported on 9.8% of returns)
Here:
+$5,084
State:
+$9,547
(% of AGI for various income ranges: 5.7% for AGIs below $10k, 4.8% for AGIs $10k-25k, 1.0% for AGIs $25k-50k, 0.9% for AGIs $50k-75k, 0.8% for AGIs $75k-100k, 0.1% for AGIs over 100k)
IRA payment deduction: $2,399 (reported on 1.4% of returns)
48125:
$2,399
Michigan:
$2,875
(% of AGI for various income ranges: 0.2% for AGIs $10k-25k, 0.1% for AGIs $25k-50k, 0.1% for AGIs $50k-75k, 0.1% for AGIs $75k-100k)
Self-employed pension: $2,727 (reported on 0.1% of returns)
Here:
$2,727
Michigan:
$13,826
Total itemized deductions: $13,469 (23% of AGI, reported on 38.0% of returns)
Here:
$13,469
State:
$18,509
Here:
23.5% of AGI
State:
20.7% of AGI
(% of AGI for various income ranges: 12.5% for AGIs below $10k, 10.8% for AGIs $10k-25k, 13.7% for AGIs $25k-50k, 14.4% for AGIs $50k-75k, 13.9% for AGIs $75k-100k, 14.1% for AGIs over 100k)
Charity contributions deductions: $1,855 (3% of AGI, reported on 33.2% of returns)
Here:
$1,855
State:
$3,365
Here:
3.1% of AGI
State:
3.6% of AGI
(% of AGI for various income ranges: 0.8% for AGIs below $10k, 1.2% for AGIs $10k-25k, 1.4% for AGIs $25k-50k, 1.7% for AGIs $50k-75k, 2.0% for AGIs $75k-100k, 1.9% for AGIs over 100k)
Total tax: $4,367 (reported on 76.8% of returns)
48125:
$4,367
State:
$7,691
(% of AGI for various income ranges: 2.3% for AGIs below $10k, 4.1% for AGIs $10k-25k, 7.0% for AGIs $25k-50k, 9.2% for AGIs $50k-75k, 10.7% for AGIs $75k-100k, 14.8% for AGIs over 100k)
Earned income credit: $1,560 (reported on 13.0% of returns)
Here:
$1,560
State:
$1,737
Percentage of individuals using paid preparers for their 2004 taxes: 61.3%
Here:
61%
State:
60%
(% for various income ranges: 55.1% for AGIs below $10k, 62.8% for AGIs $10k-25k, 61.6% for AGIs $25k-50k, 64.2% for AGIs $50k-75k, 62.8% for AGIs $75k-100k, 65.0% for AGIs over 100k)
Likely homosexual households (counted as self-reported same-sex unmarried-partner households)
Lesbian couples: 0.0% of all households
Gay men: 0.0% of all households
Household received Food Stamps/SNAP in the past 12 months: 1,658 Household did not receive Food Stamps/SNAP in the past 12 months: 6,752
Women who had a birth in the past 12 months: 268 (207 now married, 62 unmarried) Women who did not have a birth in the past 12 months: 4,709 (1,636 now married, 3,078 unmarried)
Housing units in zip code 48125 with a mortgage: 2,914 (326 second mortgage, 312 both second mortgage and home equity loan) Houses without a mortgage: 40
Median monthly owner costs for units with a mortgage: $1,095 Median monthly owner costs for units without a mortgage: $479
Residents with income below the poverty level in 2022:
This zip code:
22.4%
Whole state:
13.4%
Residents with income below 50% of the poverty level in 2022:
This zip code:
10.2%
Whole state:
6.9%
Median number of rooms in houses and condos:
Here:
5.6
State:
6.5
Median number of rooms in apartments:
Here:
5.2
State:
4.3
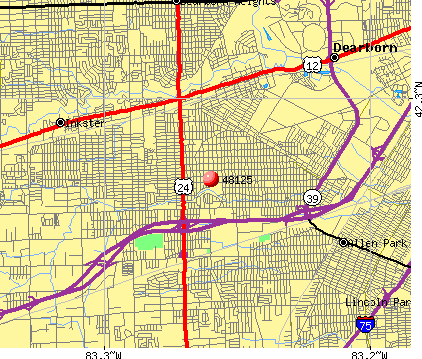
Notable locations in this zip code not listed on our city pages
Notable locations in zip code 48125: John F Kennedy Junior Library (A), Dearborn Heights Fire Department Station 1 (B). Display/hide their locations on the map
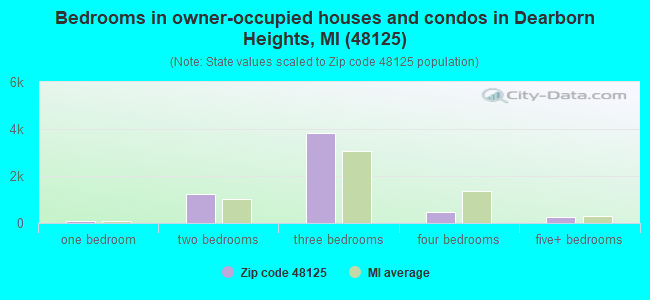
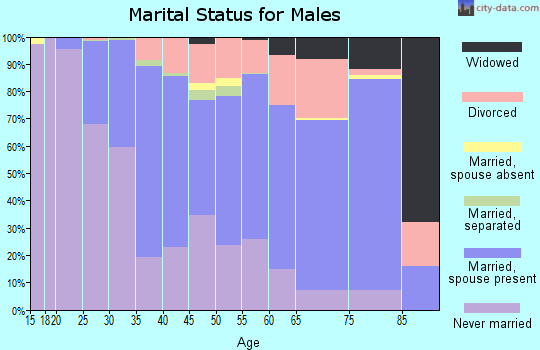
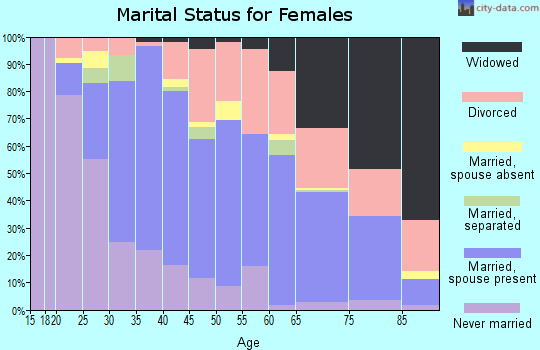
3,070 married couples with children.
1,341 single-parent households (378 men, 963 women).
84.3% of residents of 48125 zip code speak English at home.
3.6% of residents speak Spanish at home (60% very well, 14% well, 23% not well, 3% not at all).
1.6% of residents speak other Indo-European language at home (93% very well, 2% well, 5% not well).
0.3% of residents speak Asian or Pacific Island language at home (25% very well, 73% well, 1% not at all).
9.8% of residents speak other language at home (63% very well, 26% well, 9% not well, 2% not at all).
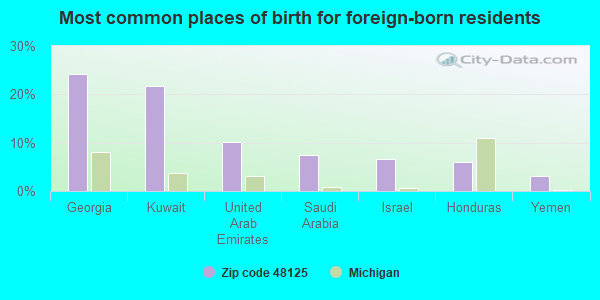
Foreign born population: 1,764 (8.0%) (59.3% of them are naturalized citizens)
This zip code:
8.0%
Whole state:
6.9%
24%Georgia
22%Kuwait
10%United Arab Emirates
7%Saudi Arabia
7%Israel
6%Honduras
3%Yemen
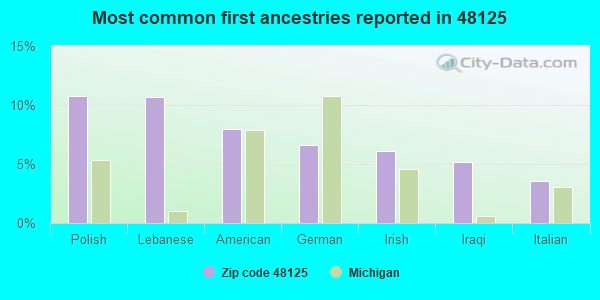
11%Polish
11%Lebanese
8%American
7%German
6%Irish
5%Iraqi
4%Italian
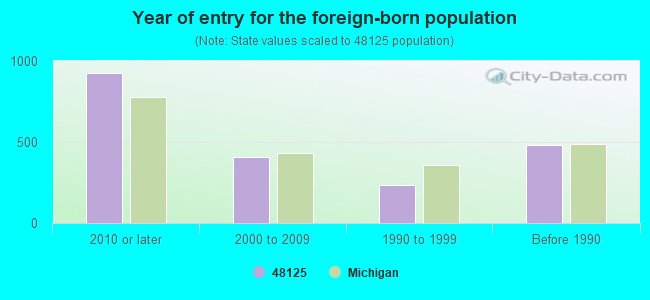
Year of entry for the foreign-born population
9272010 or later
4102000 to 2009
2331990 to 1999
481Before 1990
Major facilities with environmental interests located in this zip code:
ANCOTECH INCORPORATED (2525 BEECH DALY ROAD in DEARBORN HEIGHTS, MI)
(Integrated Compliance Information System) - ICIS-05-1998-0698, FORMAL ENFORCEMENT ACTION HAZARDOUS WASTE BIENNIAL REPORTER (Resource Conservation and Recovery Act (tracking hazardous waste)) - ICIS-, ENFORCEMENT/COMPLIANCE ACTIVITY, Large Quantity Generators, more that 1000 kg of hazardous waste/month (Resource Conservation and Recovery Act (tracking hazardous waste)) - notification - ICIS-, ENFORCEMENT/COMPLIANCE ACTIVITY, TRI REPORTER (Tracking of toxic chemicals releasing facilities) Business SIC classification: ROLLING, DRAWING, AND EXTRUDING OF NONFERROUS METALS, EXCEPT COPPER AND ALUMINUM; NONCLASSIFIABLE ESTABLISHMENTS Organizations: ANCO-TECH INC (CONTACT/OPERATOR)
, KAZUO SAITO (CONTACT/OWNER)
CENTRAL WAYNE COUNTY SANITATION AUTHORIT (4901 S INKSTER RD in DEARBORN HEIGHTS, MI)
AIR MAJOR (AIRS/AFS) (Integrated Compliance Information System) - ICIS-05-1982-0022, FORMAL ENFORCEMENT ACTION CRITERIA AND HAZARDOUS AIR POLLUTANT INVENTORY (Inventory of air pollution sources) AIR MAJOR ("Best Available" air pollution technologies tracking) Business SIC classification: ELECTRIC SERVICES; SEWERAGE SYSTEMS; REFUSE SYSTEMS Alternative names: CENTRAL WAYNE COMPANY SANITATION AUTHORITY, CENTRAL WAYNE ENERGY RECOVERY LIMITED PARTNERSHIP, CENTRAL WAYNE ENERGY RECOVERY, CENTRAL WAYNE ENERGY RECOVERY LIMITED PARTNERSHIP
ANNAPOLIS HIGH SCHOOL (4650 CLIPPERT STREET in DEARBORN HEIGHTS, MI)
(Geographic Names Information System) (National Center for Education Statistics) - STATE ID-04950 Organizations: DEARBORN HEIGHTS SCHOOL DISTRICT #7 (SCHOOL DISTRICT)
BEDFORD SCHOOL (4650 CROISSANT STREET in DEARBORN HEIGHTS, MI)
(Geographic Names Information System) (National Center for Education Statistics) - STATE ID-00249 Organizations: DEARBORN HEIGHTS SCHOOL DISTRICT #7 (SCHOOL DISTRICT)
ACADEMY FOR BUSINESS & TECHNOLOGY (26104 ETON AVENUE in DEARBORN HEIGHTS, MI)
(National Center for Education Statistics) - STATE ID-08435
FEDERAL ELEMENTARY SCHOOL (27280 POWERS AVENUE in DEARBORN HEIGHTS, MI)
(National Center for Education Statistics) - STATE ID-01212 Organizations: TAYLOR SCHOOL DISTRICT (SCHOOL DISTRICT)
BEECH SERVICES LLC (2801 SOUTH BEECH DALY STREET in DEARBORN HEIGHTS, MI)
AIR MINOR (AIRS/AFS) CRITERIA AND HAZARDOUS AIR POLLUTANT INVENTORY (Inventory of air pollution sources) Conditionally Exempt Small Quantity Generators, less than 100 kg/month of hazardous waste (Resource Conservation and Recovery Act (tracking hazardous waste)) - notification TRI REPORTER (Tracking of toxic chemicals releasing facilities) Business SIC classification: MOTORS AND GENERATORS; ARMATURE REWINDING SHOPS Alternative names: AMETEK PRESTOLITE MOTORS, BEECH ELECTRIC, PRESTOLITE ELECTRIC INC. BEECH ELECTRIC DIV., PRESTOLITE ELECTRIC OF MI
ELLEFSON & SONS BUILDING COMPANY, INC. (4492 VASSAR in DEARBORN HEIGHTS, MI)
(Integrated Compliance Information System) - ICIS-05-1999-0574, FORMAL ENFORCEMENT ACTION, ICIS-05-1999-0181, Business SIC classification: GENERAL CONTRACTORS-SINGLE-FAMILY HOUSES
ELLEFSON BUILDING DEMOLITION COMPANY (26276 VAN BUREN in DEARBORN HEIGHTS, MI)
(Integrated Compliance Information System) - ICIS-05-2000-0753, FORMAL ENFORCEMENT ACTION Business SIC classification: NONCLASSIFIABLE ESTABLISHMENTS Alternative names: EBDC INC., D/B/A ELLEFSON BUILDING DEMOLITION CO.
FOSTER CLEANER (5153 BEECH DALY in DEARBORN HEIGHTS, MI)
Conditionally Exempt Small Quantity Generators, less than 100 kg/month of hazardous waste (Resource Conservation and Recovery Act (tracking hazardous waste)) (Resource Conservation and Recovery Act (tracking hazardous waste)) Organizations: KYONG C YUK (CONTACT/OWNER)
BEECH DALY CLINIC PC (4245 BEECH DALY RD in DEARBORN HEIGHTS, MI)
(Resource Conservation and Recovery Act (tracking hazardous waste))
MI DEPT/TRANSPORTATION BRIDGE P09-82025 (I-94 UNDER REDFORD ST PEDWALK in DETROIT, MI)
(Resource Conservation and Recovery Act (tracking hazardous waste)) Organizations: MICH DEPT OF TRANSPORTATION (CONTACT/OPERATOR)
Alternative names: MIDOT BRIDGE I-94 UNDER REDFORD PEDWALK
FISHER ROOFING (5471 SYLVIA in DEARBORN HEIGHTS, MI)
(Resource Conservation and Recovery Act (tracking hazardous waste)) Organizations: ROBERT FISHER (CONTACT/OWNER)
Housing units lacking complete plumbing facilities: 0.5% Housing units lacking complete kitchen facilities: 0.7%
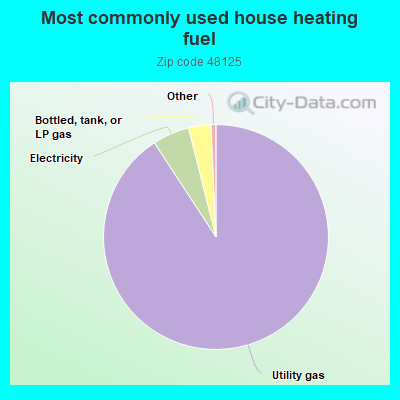
90.8%Utility gas
5.3%Electricity
3.2%Bottled, tank, or LP gas
Population in 1990: 24,715.
Place of birth for U.S.-born residents:
This state: 17,430
Northeast: 438
Midwest: 730
South: 912
West: 478
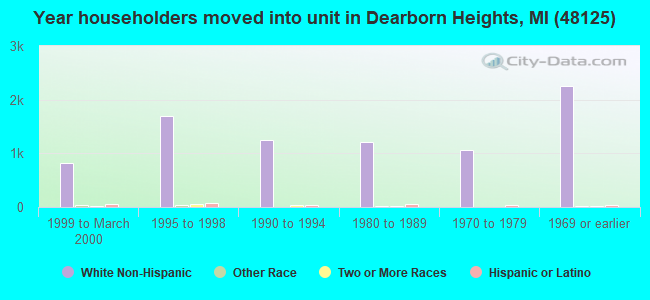
69% of the 48125 zip code residents lived in the same house 5 years ago. Out of people who lived in different houses, 80% lived in this county. Out of people who lived in different counties, 50% lived in Michigan.
89% of the 48125 zip code residents lived in the same house 1 year ago. Out of people who lived in different houses, 84% moved from this county. Out of people who lived in different houses, 6% moved from different county within same state. Out of people who lived in different houses, 3% moved from different state. Out of people who lived in different houses, 5% moved from abroad.
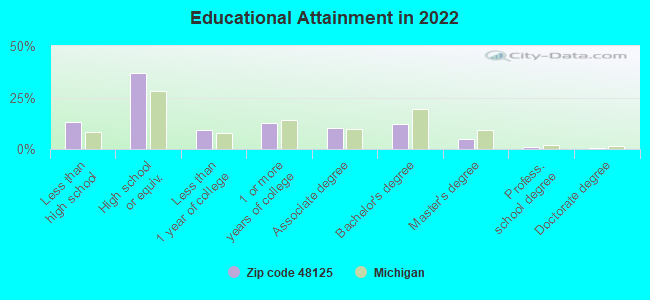
Private vs. public school enrollment:
Students in private schools in grades 1 to 8 (elementary and middle school): 116
Here:
5.8%
Michigan:
12.4%
Students in private schools in grades 9 to 12 (high school): 76
Here:
6.5%
Michigan:
9.8%
Students in private undergraduate colleges: 109
Here:
15.3%
Michigan:
14.9%
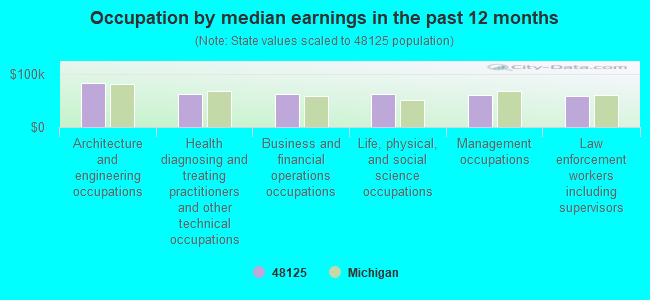
Occupation by median earnings in the past 12 months ($)
83,036Architecture and engineering occupations
63,096Health diagnosing and treating practitioners and other technical occupations
62,118Business and financial operations occupations
61,593Life, physical, and social science occupations
59,564Management occupations
59,037Law enforcement workers including supervisors
Companies with federal contracts located in this zip code:
UNITED PRECISION PRODUCTS CO , (25040 VAN BORN in DEARBORN HEIGH, MI; small business) : $186,168 in 24 contractsfrom 2004 to 2006
Contracts for Nails, Machine Keys, and Pins, Studs, Bolts by Defense Logistics Agency Signed by year:2000: $0; 2001: $0; 2002: $0; 2003: $0; 2004: $27,805; 2005: $128,311; 2006: $30,052.
Biggest contracts:
$72,324 with Defense Logistics Agency for Nails, Machine Keys, and Pins. Signed on 2005-03-29. Completion date: 2005-08-02.
$13,316 with Defense Logistics Agency for Studs. Signed on 2004-10-18. Completion date: 2005-02-02.
$10,750 with Defense Logistics Agency for Nails, Machine Keys, and Pins. Signed on 2004-10-22. Completion date: 2005-02-05.
$8,902, same as above.Signed on 2006-02-07. Completion date: 2006-05-22.
ALLIED WASTE NORTH AMERICA, IN (26500 VAN BORN RD in DEARBORN HEIGH, MI)
$63,922 with Army for Trash/Garbage Collection Services - Including Portable Sanitation Services. Signed on 2000-10-11. Completion date: 2001-09-30.
Top industries in this zip code by the number of employees in 2005:
Health Care and Social Assistance: Nursing Care Facilities (250-499 employees: 1 establishment)
Administrative and Support and Waste Management and Remediation Services: Professional Employer Organizations (100-249: 2)
2002 - 2018 National Fire Incident Reporting System (NFIRS) incidents
Based on the data from the years 2002 - 2018 the average number of fires per year is 47. The highest number of reported fire incidents - 68 took place in 2003, and the least - 18 in 2015. The data has a declining trend.
When looking into fire subcategories, the most incidents belonged to: Structure Fires (44.0%), and Outside Fires (28.1%).
Fire incident types reported to NFIRS in Zip Code 48125
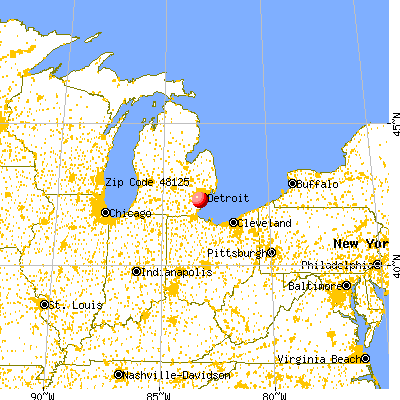


 Nearest zip codes: 48124, 48128, 48180, 48101, 48141, 48127.


 Based on the data from the years 2002 - 2018 the average number of fires per year is 47. The highest number of reported fire incidents - 68 took place in 2003, and the least - 18 in 2015. The data has a declining trend.
 When looking into fire subcategories, the most incidents belonged to: Structure Fires (44.0%), and Outside Fires (28.1%).