Huntwood Park neighborhood in Davis, California (CA), 95616 detailed profile
Settings
X

Business Search - 14 Million verified businesses
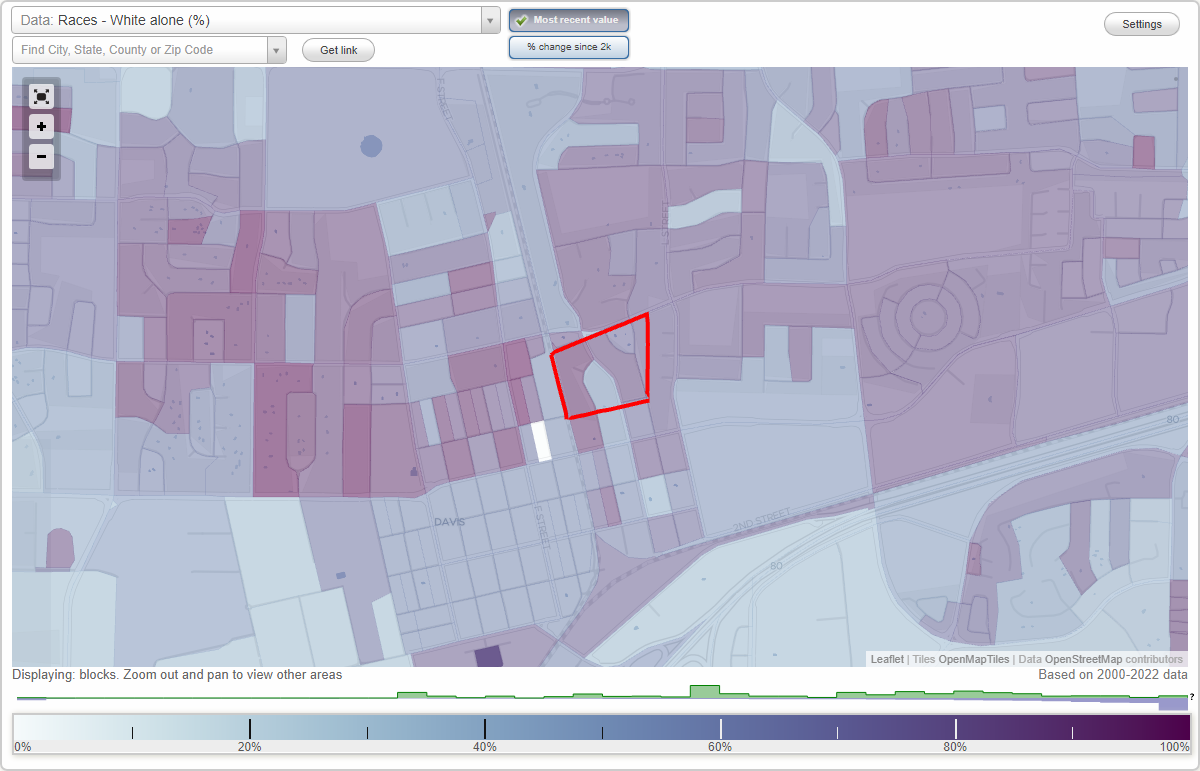
Area: 0.038 square miles
Population: 281
Population density:
| Huntwood Park: | 7,490 people per square mile |
| Davis: | 6,415 people per square mile |

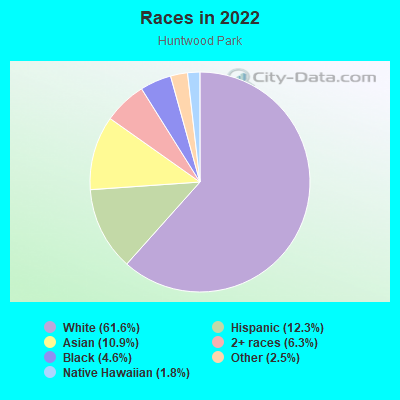
- 17561.6%White
- 3512.3%Hispanic or Latino
- 3110.9%Asian
- 186.3%Two or more races
- 134.6%Black
- 72.5%Some other race
- 51.8%Native Hawaiian and Other
Pacific Islander
Median household income in 2022:
| Huntwood Park: | $69,033 |
| Davis: | $67,373 |
Distribution of median household income
![Distribution of median household income]()
- 5Less than $10,000
- 25$10,000 to $19,999
- 16$20,000 to $29,999
- 7$30,000 to $39,999
- 10$40,000 to $49,999
- 5$50,000 to $59,999
- 23$60,000 to $74,999
- 19$75,000 to $99,999
- 2$100,000 to $124,999
- 7$125,000 to $149,999
- 16$150,000 to $199,999
- 11$200,000 or more

Distribution of owner-occupied house/condo value
![Distribution of owner-occupied house/condo value]()
- 3Less than $50,000
- 3$50,000 to $99,999
- 1$300,000 to $399,999
- 3$400,000 to $499,999
- 18$500,000 to $749,999
- 7$750,000 to $999,999
- 2$1,000,000 or more

Distribution of rent paid by renters
![Distribution of rent paid by renters]()
- 3$100 to $199
- 3$200 to $299
- 1$300 to $399
- 5$500 to $599
- 1$600 to $699
- 6$700 to $799
- 1$800 to $899
- 5$900 to $999
- 8$1,000 to $1,249
- 9$1,250 to $1,499
- 64$1,500 to $1,999
- 9$2,000 or more

Median rent in 2022:
| Huntwood Park: | $1,641 |
| Davis: | $1,865 |
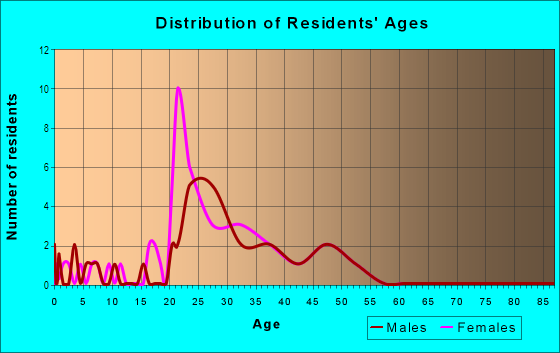
| Males: | 159 |
| Females: | 122 |
Males:
| This neighborhood: | 33.7 years |
| Whole city: | 24.9 years |
| This neighborhood: | 28.3 years |
| Whole city: | 26.5 years |
Average household size:
| Huntwood Park: | 2.0 people |
| Davis: | 2.5 people |
Percentage of family households:
| Huntwood Park: | 29.7% |
| Davis: | 31.5% |
| Here: | 32.4% |
| Davis: | 35.7% |
Percentage of married-couple families with children (among all households):
| Huntwood Park: | 42.6% |
| Davis: | 28.9% |
Percentage of single-mother households (among all households):
| Huntwood Park: | 10.3% |
| Davis: | 7.2% |
Percentage of never married males 15 years old and over:
Percentage of never married females 15 years old and over:
| Huntwood Park: | 27.0% |
| Davis: | 25.7% |
Percentage of never married females 15 years old and over:
| Huntwood Park: | 24.6% |
| city: | 29.9% |
Percentage of people that speak English not well or not at all:
| Huntwood Park: | 5.8% |
| Davis: | 2.8% |
Percentage of people born in this state:
Percentage of people born in another U.S. state:
Percentage of native residents but born outside the U.S.:
Percentage of foreign born residents:
| Here: | 60.9% |
| Davis: | 59.5% |
Percentage of people born in another U.S. state:
| Huntwood Park: | 17.1% |
| Davis: | 19.1% |
Percentage of native residents but born outside the U.S.:
| Here: | 1.7% |
| city: | 0.9% |
Percentage of foreign born residents:
| Here: | 20.4% |
| Davis: | 20.5% |
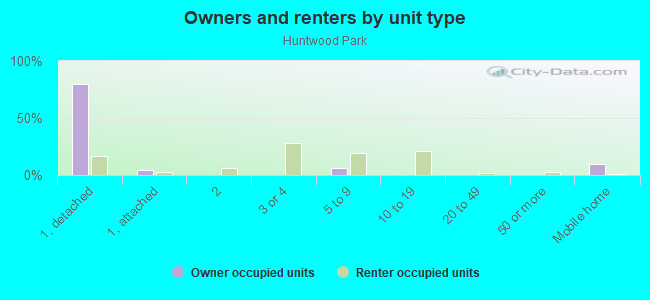
Owner-occupied
Renter-occupied

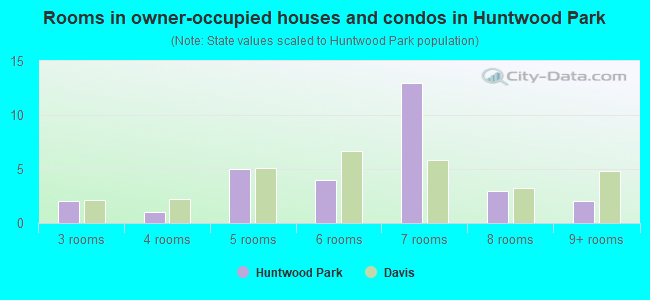
- Rooms in owner-occupied houses and condos in Huntwood Park
- 01 room
- 02 rooms
- 23 rooms
- 14 rooms
- 55 rooms
- 46 rooms
- 137 rooms
- 38 rooms
- 29+ rooms
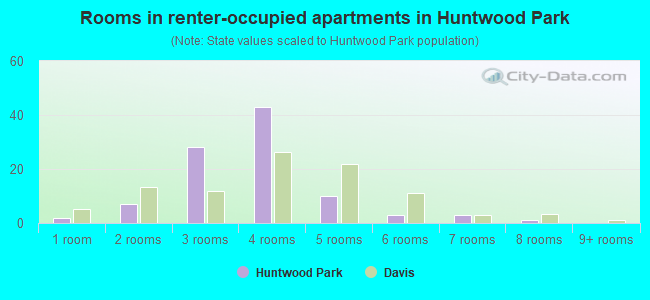
- Rooms in renter-occupied apartments in Huntwood Park
- 21 room
- 72 rooms
- 283 rooms
- 434 rooms
- 105 rooms
- 36 rooms
- 37 rooms
- 18 rooms
- 09+ rooms
Owner-occupied
Renter-occupied
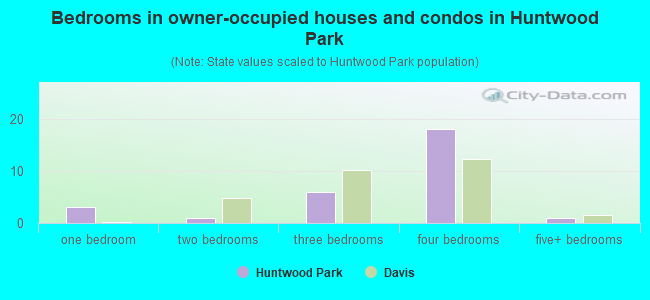
- Bedrooms in owner-occupied houses and condos in Huntwood Park
- 0no bedroom
- 31 bedroom
- 12 bedrooms
- 63 bedrooms
- 184 bedrooms
- 15+ bedrooms
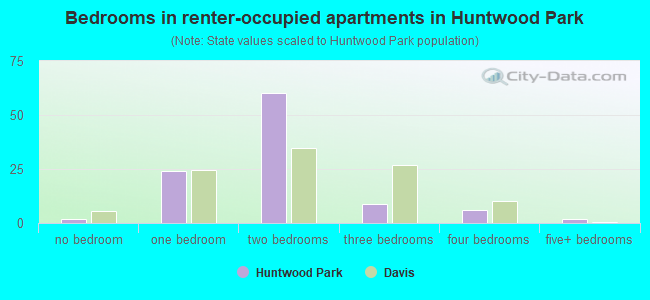
- Bedrooms in renter-occupied apartments in Huntwood Park
- 2no bedroom
- 241 bedroom
- 602 bedrooms
- 93 bedrooms
- 64 bedrooms
- 25+ bedrooms
Average number of cars or other vehicles available in houses/condos:
Average number of cars or other vehicles available in apartments:
| This neighborhood: | 1.9 |
| Davis: | 2.0 |
Average number of cars or other vehicles available in apartments:
| Here: | 1.7 |
| city: | 1.7 |
Percentage of units with a mortgage:
| Huntwood Park: | 56.3% |
| Davis: | 61.8% |
Average estimated value of detached houses in 2022 (35.3% of all units):
| Huntwood Park: | $701,256 |
| Davis: | $1,006,726 |
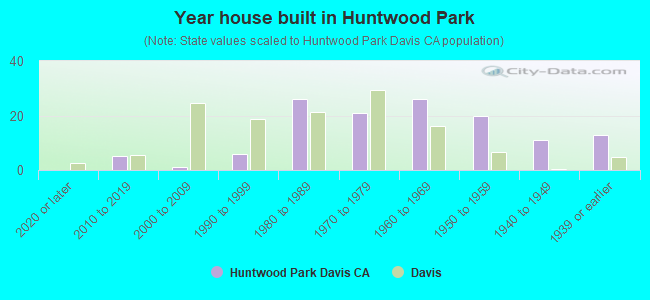
- Year house built in Huntwood Park
- 02020 or later
- 52010 to 2019
- 12000 to 2009
- 61990 to 1999
- 261980 to 1989
- 211970 to 1979
- 261960 to 1969
- 201950 to 1959
- 111940 to 1949
- 131939 or earlier
City-data.com crime index for city in 2020 (higher means more crime):
| City: | 213.3 |
| U.S. average: | 219.5 |
Travel time to work (commute)
![Travel time to work (commute)]()
- 2Less than 5 minutes
- 245 to 9 minutes
- 3310 to 14 minutes
- 2015 to 19 minutes
- 2220 to 24 minutes
- 425 to 29 minutes
- 1430 to 34 minutes
- 335 to 39 minutes
- 640 to 44 minutes
- 545 to 59 minutes
- 1260 to 89 minutes
- 290 or more minutes

Means of transportation to work
![Means of transportation to work]()
- 27.9%50Drove a car alone
- 5.0%9Carpooled
- 3.9%7Bus
- 0.6%1Long-distance train or commuter rail
- 0.6%1Motorcycle
- 21.2%38Bicycle
- 4.5%8Walked
- 7.8%14Other means
- 31.8%57Worked at home

Time leaving home to go to work
![Time leaving home to go to work]()
- 412:00 a.m. to 4:59 a.m.
- 45:00 a.m. to 5:29 a.m.
- 65:30 a.m. to 5:59 a.m.
- 106:00 a.m. to 6:29 a.m.
- 26:30 a.m. to 6:59 a.m.
- 137:00 a.m. to 7:29 a.m.
- 217:30 a.m. to 7:59 a.m.
- 168:00 a.m. to 8:29 a.m.
- 188:30 a.m. to 8:59 a.m.
- 169:00 a.m. to 9:59 a.m.
- 1010:00 a.m. to 10:59 a.m.
- 111:00 a.m. to 11:59 a.m.
- 912:00 p.m. to 3:59 p.m.
- 154:00 p.m. to 11:59 p.m.

Occupations of males:
- Percentage of males in management occupations (except farmers):
Here: 7.0% city: 9.8%
- Percentage of males in business and financial operations occupations:
Here: 4.0% city: 5.9%
- Percentage of males in computer and mathematical occupations:
Here: 1.1% city: 5.6%
- Percentage of males in architecture and engineering occupations:
Here: 9.2% city: 5.7%
- Percentage of males in life, physical, and social science occupations:
Here: 4.2% city: 7.8%
- Percentage of males in legal occupations:
Here: 1.1% city: 2.7%
- Percentage of males in education, training, and library occupations:
Here: 21.1% city: 18.9%
- Percentage of males in arts, design, entertainment, sports, and media occupations:
Here: 5.8% city: 2.1%
- Percentage of males in service occupations:
Here: 9.0% city: 11.9%
- Percentage of males in sales and office occupations:
Here: 24.3% city: 10.8%
- Percentage of males in production occupations:
Here: 4.8% city: 2.8%
- Percentage of males in transportation occupations:
Here: 12.1% city: 4.5%
- Percentage of males in material moving occupations:
Here: 5.8% city: 2.0%
Occupations of females:
- Percentage of females in management occupations (except farmers):
Here: 14.9% city: 7.9%
- Percentage of females in computer and mathematical occupations:
Here: 4.3% city: 2.0%
- Percentage of females in community and social services occupations:
Here: 1.1% city: 2.7%
- Percentage of females in legal occupations:
Here: 21.4% city: 3.0%
- Percentage of females in education, training, and library occupations:
Here: 36.3% city: 19.0%
- Percentage of females in healthcare practitioners and technical occupations:
Here: 3.7% city: 9.1%
- Percentage of females in service occupations:
Here: 8.8% city: 18.1%
- Percentage of females in sales and office occupations:
Here: 14.7% city: 16.0%
- Percentage of females in production occupations:
Here: 1.3% city: 1.7%
- Percentage of females in transportation occupations:
Here: 4.0% city: 1.2%
- Percentage of females in material moving occupations:
Here: 1.4% city: 0.8%
Percentage of people 16-64 in Armed Forces:
| Huntwood Park: | 0.5% |
| Davis: | 0.2% |
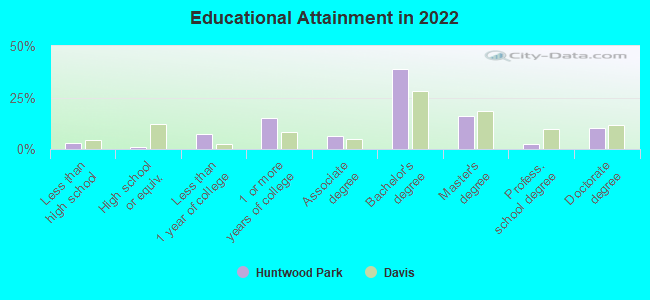
Education in this neighborhood (subdivision or community):
- Percentage of people 3 years and older in K-12 schools:
Huntwood Park: 9.3% Davis: 10.0%
- Percentage of people 3 years and older in undergraduate colleges:
Huntwood Park: 12.1% Davis: 24.3%
- Percentage of people 3 years and older in grad. or professional schools:
Huntwood Park: 8.9% Davis: 8.2%
- Percentage of students K-12 enrolled in private schools:
Huntwood Park: 0.0% Davis: 11.2%
Percentage of population below poverty level:
| Huntwood Park: | 32.9% |
| Davis: | 27.0% |
Median year owner moved in (as recorded in 2022):
Median year renter moved in (as recorded in 2022):
| Huntwood Park: | 2006 |
| Davis: | 2009 |
Median year renter moved in (as recorded in 2022):
| Huntwood Park: | 2019 |
| Davis: | 2022 |
Percentage of married-couple families with both working:
| Huntwood Park: | 100.0% |
| Davis: | 71.8% |
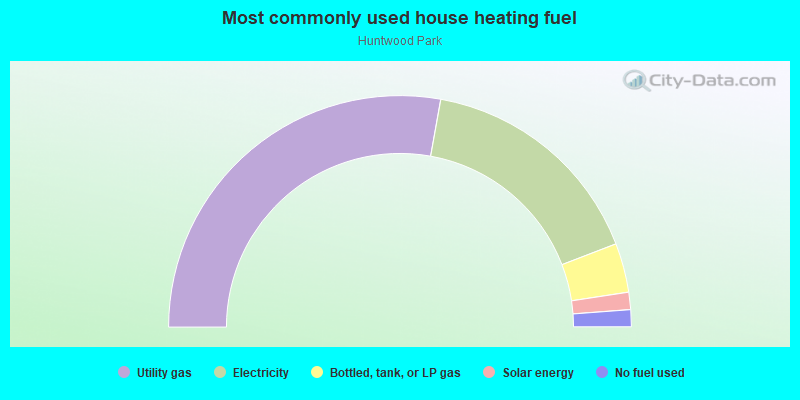
- 55.7%Utility gas
- 32.7%Electricity
- 6.9%Bottled, tank, or LP gas
- 2.4%Solar energy
- 2.4%No fuel used
Roads and streets:
J St
Length: 0.13 miles
Directions: N-S, SE-NW
Address range: 600 to 699
Directions: N-S, SE-NW
Address range: 600 to 699
K St
Length: 0.11 miles
Directions: N-S, SE-NW
Address range: 600 to 699
Directions: N-S, SE-NW
Address range: 600 to 699
Yale Dr
Length: 0.08 miles
Direction: E-W
Address range: 1100 to 1199
Direction: E-W
Address range: 1100 to 1199
I St
Length: 0.04 miles
Direction: SW-NE
Address range: 620 to 799
Direction: SW-NE
Address range: 620 to 799
Boyer Cir
Length: 0.04 miles
Direction: E-W
Direction: E-W
Railroad features:
California Northern RR
Length: 0.12 miles
Direction: N-S
Direction: N-S