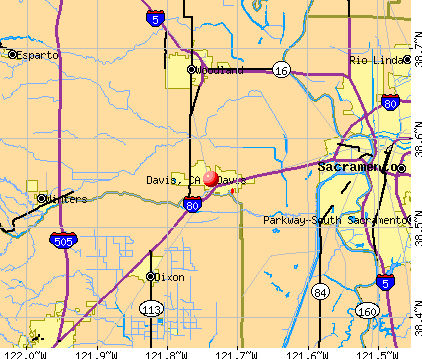
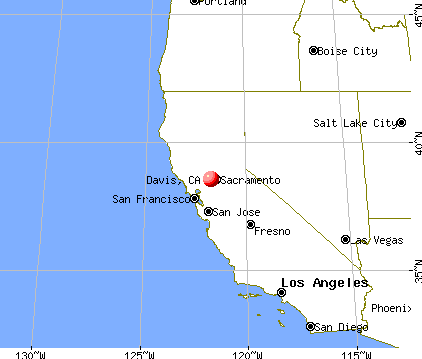
Davis, California
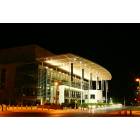
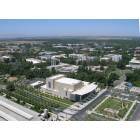
Davis: Mondavi Center, Davis California
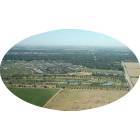
Davis: Golf Course from my model airplane
Davis: City of Davis City Hall
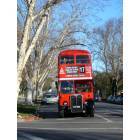
Davis: Unitrans in Davis uses a double decker Bus from London.
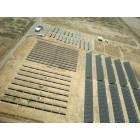
Davis: Solar Plant from my model airplane
Davis: University of California, Davis
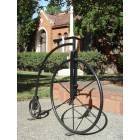
Davis: bikes
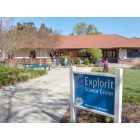
Davis: Explorit Science Center
Davis: The Jack Rabbits are running scared in Sunrise Neighborhood.... In what used to be a horse pasture of an old family farm the wildlife habitat is being destroyed to build new homes.... Who will be able to afford these new homes? Certainly not the wildlife that currently lives there. Hawks, owls, wild turkeys, rabbits, ground squirrels, etc...
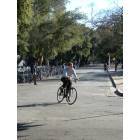
Davis: bikes
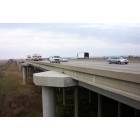
Davis: Yolo Causeway Now
- add
your
Submit your own pictures of this city and show them to the world
- OSM Map
- General Map
- Google Map
- MSN Map
Population change since 2000: +11.2%
 |
| Males: 32,224 | |
| Females: 34,824 |
| Median resident age: | 25.6 years |
| California median age: | 37.9 years |
Zip codes: 95616, 95618, 95776.
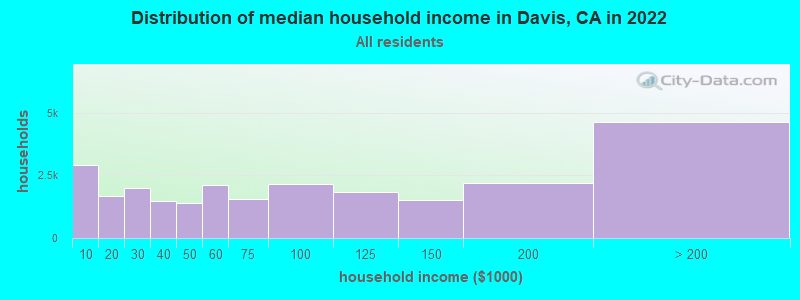
Davis Zip Code Map| Davis: | $67,373 |
| CA: | $91,551 |
Estimated per capita income in 2022: $44,672 (it was $22,937 in 2000)
Davis city income, earnings, and wages data
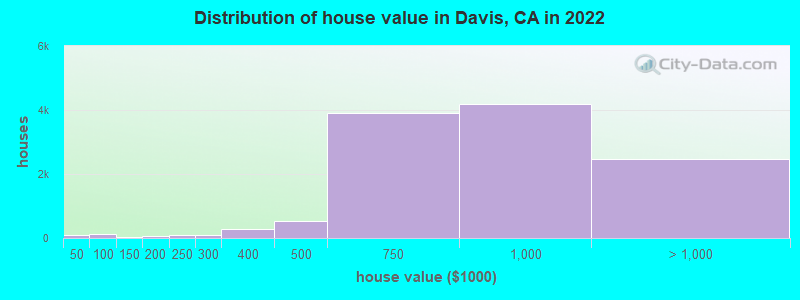
Estimated median house or condo value in 2022: $830,600 (it was $233,000 in 2000)
| Davis: | $830,600 |
| CA: | $715,900 |
Mean prices in 2022: all housing units: $834,853; detached houses: $926,672; townhouses or other attached units: $545,794; in 3-to-4-unit structures: $193,922; in 5-or-more-unit structures: $475,152; mobile homes: $118,394
Median gross rent in 2022: $1,920.
(23.0% for White Non-Hispanic residents, 38.2% for Black residents, 31.6% for Hispanic or Latino residents, 27.2% for American Indian residents, 9.0% for Native Hawaiian and other Pacific Islander residents, 37.7% for other race residents, 21.2% for two or more races residents)
Detailed information about poverty and poor residents in Davis, CA


Compare current foreclosures near Davis, CA:
| Photo | Address | Area | Beds / Baths | Price | Details |
|---|---|---|---|---|---|

|
#1
Monte Vista Ave
Davis, CA 95618
|
- sq. feet
|
- baths - beds |
$33,636
|
show details |

|
#2
Westernesse Rd
Davis, CA 95616
|
- sq. feet
|
2 baths 3 beds |
show details | |

|
#3
Hamel Ln
Davis, CA 95618
|
- sq. feet
|
- baths - beds |
show details | |

|
#4
Ashland Ter Apt A
Davis, CA 95618
|
- sq. feet
|
- baths - beds |
show details | |

|
#5
J St Apt 145
Davis, CA 95616
|
- sq. feet
|
- baths - beds |
show details | |

|
#6
F St Apt 104
Davis, CA 95616
|
- sq. feet
|
- baths - beds |
show details | |

|
#7
G St Apt 5
Davis, CA 95616
|
- sq. feet
|
- baths - beds |
show details | |

|
#8
Celadon St, # 408
Davis, CA 95616
|
- sq. feet
|
- baths - beds |
show details | |

|
#9
Overhill Ln
Davis, CA 95616
|
- sq. feet
|
- baths - beds |
show details | |

|
#10
Oak Ave
Davis, CA 95616
|
- sq. feet
|
- baths - beds |
show details |
| Photo | Address | Area | Beds / Baths | Price | Details |
|---|---|---|---|---|---|

|
#11
Muir Woods Pl
Davis, CA 95616
|
- sq. feet
|
- baths - beds |
show details | |

|
#12
Cresta Ct
Davis, CA 95618
|
- sq. feet
|
- baths - beds |
show details | |

|
#13
N St
Sacramento, CA 95816
|
3,115 sq. feet
|
3 baths 4 beds |
show details | |

|
#14
Claudia Ct
West Sacramento, CA 95691
|
- sq. feet
|
2 baths 3 beds |
$40,177
|
show details |

|
#15
La Fleur Way
Sacramento, CA 95831
|
3,287 sq. feet
|
5 baths 5 beds |
show details | |

|
#16
Summer Stroll Cir
Sacramento, CA 95823
|
1,885 sq. feet
|
2 baths 4 beds |
show details | |

|
#17
Pocket Rd
Sacramento, CA 95831
|
924 sq. feet
|
2 baths 2 beds |
show details | |

|
#18
W F St
Dixon, CA 95620
|
949 sq. feet
|
1 baths 3 beds |
show details | |

|
#19
Ben Ali St
Sacramento, CA 95815
|
- sq. feet
|
2 baths 3 beds |
show details | |

|
#20
Charity Ln
Dixon, CA 95620
|
1,688 sq. feet
|
2 baths 3 beds |
show details |
| Photo | Address | Area | Beds / Baths | Price | Details |
|---|---|---|---|---|---|

|
#21
Satellite Pkwy
Sacramento, CA 95823
|
1,216 sq. feet
|
2 baths 3 beds |
show details | |

|
#22
2nd Ave
Sacramento, CA 95817
|
1,580 sq. feet
|
2 baths 3 beds |
show details | |

|
#23
66th Ave
Sacramento, CA 95822
|
1,260 sq. feet
|
2 baths 3 beds |
show details | |

|
#24
Walnut Park Ave
Dixon, CA 95620
|
1,946 sq. feet
|
2 baths 4 beds |
show details | |

|
#25
Long Warf Pl
Sacramento, CA 95835
|
1,722 sq. feet
|
3 baths 3 beds |
show details | |

|
#26
Tamoshanter Way
Sacramento, CA 95822
|
1,248 sq. feet
|
2 baths 4 beds |
show details | |

|
#27
Willie Hausey Way
Sacramento, CA 95838
|
- sq. feet
|
2 baths 5 beds |
show details | |

|
#28
Circle Pkwy
Sacramento, CA 95823
|
1,120 sq. feet
|
1 baths 3 beds |
show details | |

|
#29
Wiegand Ct
Dixon, CA 95620
|
2,044 sq. feet
|
2 baths 4 beds |
show details | |

|
#30
Davidson Court
Dixon, CA 95620
|
2,338 sq. feet
|
3 baths 4 beds |
show details |
| Photo | Address | Area | Beds / Baths | Price | Details |
|---|---|---|---|---|---|

|
#31
Greg Thatch Cir
Sacramento, CA 95835
|
- sq. feet
|
- baths - beds |
$500,000
|
show details |

|
#32
Barnhart Cir
Sacramento, CA 95835
|
2,362 sq. feet
|
3 baths 4 beds |
show details | |

|
#33
Circle Pkwy
Sacramento, CA 95823
|
1,540 sq. feet
|
2 baths 3 beds |
show details | |

|
#34
18th Ave
Sacramento, CA 95820
|
1,196 sq. feet
|
2 baths 4 beds |
show details | |

|
#35
Duncan Cir
Woodland, CA 95776
|
1,073 sq. feet
|
2 baths 3 beds |
show details | |

|
#36
Moonstone Ave
Sacramento, CA 95835
|
2,069 sq. feet
|
2 baths 4 beds |
show details | |

|
#37
Danjac Cir
Sacramento, CA 95822
|
4,218 sq. feet
|
2 baths 3 beds |
show details | |

|
#38
Bathford St
Sacramento, CA 95833
|
1,960 sq. feet
|
2 baths 3 beds |
show details | |

|
#39
Rio Norte Way
Sacramento, CA 95834
|
1,054 sq. feet
|
1 baths 2 beds |
show details | |

|
#40
36th St
Sacramento, CA 95820
|
733 sq. feet
|
1 baths 2 beds |
show details |
| Photo | Address | Area | Beds / Baths | Price | Details |
|---|---|---|---|---|---|

|
#41
San Marin Ln
Sacramento, CA 95835
|
1,399 sq. feet
|
2 baths 2 beds |
show details | |

|
#42
Putnam Way
Sacramento, CA 95822
|
1,295 sq. feet
|
2 baths 3 beds |
show details | |

|
#43
6th Ave
Sacramento, CA 95818
|
734 sq. feet
|
1 baths 2 beds |
show details | |

|
#44
Belden St
Sacramento, CA 95815
|
1,100 sq. feet
|
2 baths 3 beds |
show details | |

|
#45
Sarazen Ave
Sacramento, CA 95822
|
1,164 sq. feet
|
2 baths 3 beds |
show details | |

|
#46
Athena Ave
Sacramento, CA 95833
|
1,001 sq. feet
|
1 baths 3 beds |
show details | |

|
#47
21st St
Sacramento, CA 95822
|
1,012 sq. feet
|
1 baths 3 beds |
show details | |

|
#48
Hermosa St
Sacramento, CA 95822
|
624 sq. feet
|
1 baths 2 beds |
show details | |

|
#49
Freeport Blvd
Sacramento, CA 95832
|
1,454 sq. feet
|
1 baths 3 beds |
show details | |

|
Check over 1 million property listings on Foreclosure.com!
|
browse all offers | |||


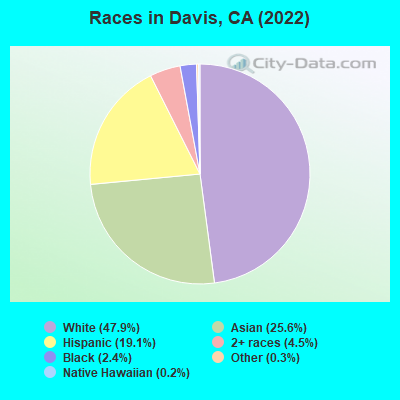
- 32,11347.9%White alone
- 17,14425.6%Asian alone
- 12,81119.1%Hispanic
- 3,0424.5%Two or more races
- 1,6062.4%Black alone
- 2120.3%Other race alone
- 1290.2%Native Hawaiian and Other
Pacific Islander alone
According to our research of California and other state lists, there were 19 registered sex offenders living in Davis, California as of April 27, 2024.
The ratio of all residents to sex offenders in Davis is 3,585 to 1.
The ratio of registered sex offenders to all residents in this city is much lower than the state average.
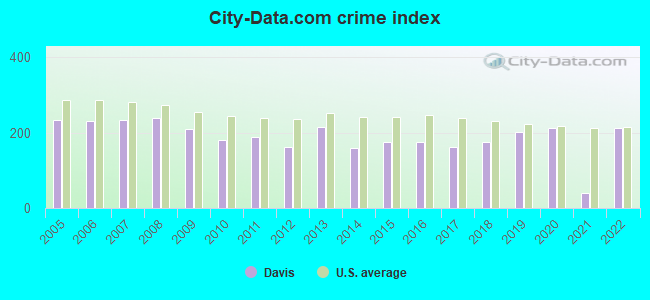
The City-Data.com crime index weighs serious crimes and violent crimes more heavily. Higher means more crime, U.S. average is 246.1. It adjusts for the number of visitors and daily workers commuting into cities.
- means the value is smaller than the state average.- means the value is about the same as the state average.
- means the value is bigger than the state average.
- means the value is much bigger than the state average.
Crime rate in Davis detailed stats: murders, rapes, robberies, assaults, burglaries, thefts, arson
Full-time law enforcement employees in 2021, including police officers: 55 (55 officers - 47 male; 8 female).
| Officers per 1,000 residents here: | 0.80 |
| California average: | 2.30 |
 Recent articles from our blog. Our writers, many of them Ph.D. graduates or candidates, create easy-to-read articles on a wide variety of topics.

 | University of California Davis, Sacramento Campus (15 replies) |
| Salary range in Davis? (4 replies) |
| Cigna PPO in Davis - Urgent Care? (1 reply) |
| Thinking about taking a springtime trip to Davis, a few quick questions. (1 reply) |
| Retirement life in Davis? (9 replies) |
| Retirement life in Davis? (8 replies) |
Latest news from Davis, CA collected exclusively by city-data.com from local newspapers, TV, and radio stations
Ancestries: European (14.1%), English (3.7%), German (2.9%), Irish (2.6%), American (2.1%), Italian (1.8%).
Current Local Time: PST time zone
Elevation: 50 feet
Land area: 10.5 square miles.
Population density: 6,414 people per square mile (high).
14,108 residents are foreign born (15.0% Asia, 2.7% Latin America, 2.1% Europe).
| This city: | 20.5% |
| California: | 26.5% |
Median real estate property taxes paid for housing units with mortgages in 2022: $7,735 (0.9%)
Median real estate property taxes paid for housing units with no mortgage in 2022: $4,756 (0.7%)
Nearest city with pop. 200,000+: Sacramento, CA  (14.6 miles , pop. 407,018).
Nearest city with pop. 1,000,000+: Los Angeles, CA (361.3 miles , pop. 3,694,820).
Nearest cities:
), ), ), ), Latitude: 38.55 N, Longitude: 121.74 W
Daytime population change due to commuting: -9,640 (-14.4%)
Workers who live and work in this city: 15,106 (43.7%)
Area code: 530

Davis, California accommodation & food services, waste management - Economy and Business Data
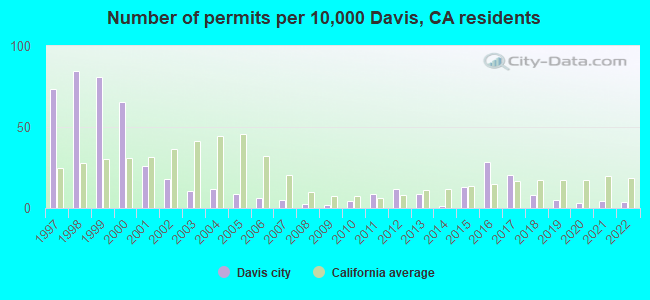
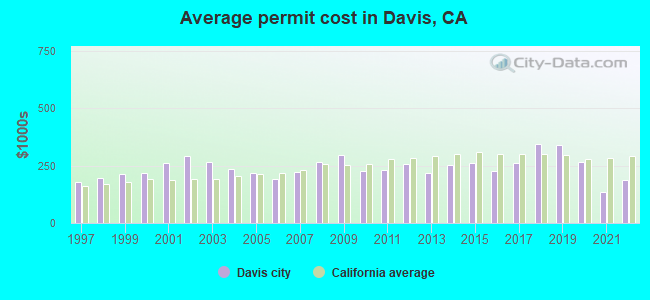
Single-family new house construction building permits:
- 2022: 23 buildings, average cost: $187,200
- 2021: 27 buildings, average cost: $137,200
- 2020: 18 buildings, average cost: $267,500
- 2019: 28 buildings, average cost: $339,600
- 2018: 47 buildings, average cost: $343,800
- 2017: 123 buildings, average cost: $261,300
- 2016: 173 buildings, average cost: $228,200
- 2015: 79 buildings, average cost: $261,900
- 2014: 9 buildings, average cost: $254,700
- 2013: 51 buildings, average cost: $219,700
- 2012: 69 buildings, average cost: $258,200
- 2011: 54 buildings, average cost: $233,400
- 2010: 27 buildings, average cost: $227,900
- 2009: 11 buildings, average cost: $298,300
- 2008: 14 buildings, average cost: $267,900
- 2007: 28 buildings, average cost: $222,700
- 2006: 38 buildings, average cost: $193,000
- 2005: 51 buildings, average cost: $216,800
- 2004: 72 buildings, average cost: $236,700
- 2003: 62 buildings, average cost: $263,500
- 2002: 107 buildings, average cost: $290,900
- 2001: 156 buildings, average cost: $260,400
- 2000: 395 buildings, average cost: $219,900
- 1999: 489 buildings, average cost: $213,000
- 1998: 510 buildings, average cost: $195,200
- 1997: 442 buildings, average cost: $177,400
| Here: | 3.3% |
| California: | 5.1% |
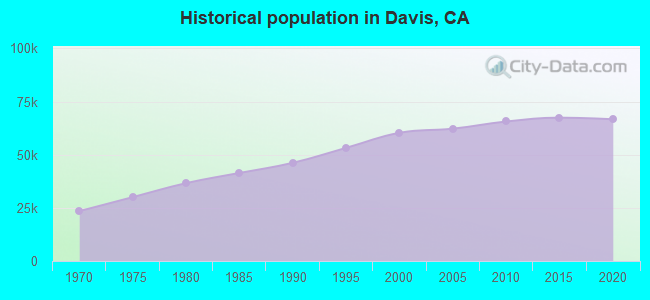
Population change in the 1990s: +13,218 (+28.1%).
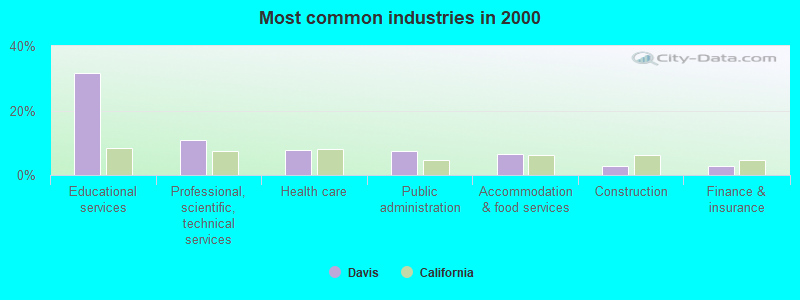
- Educational services (31.7%)
- Professional, scientific, technical services (10.9%)
- Health care (7.9%)
- Public administration (7.4%)
- Accommodation & food services (6.4%)
- Construction (2.7%)
- Finance & insurance (2.7%)
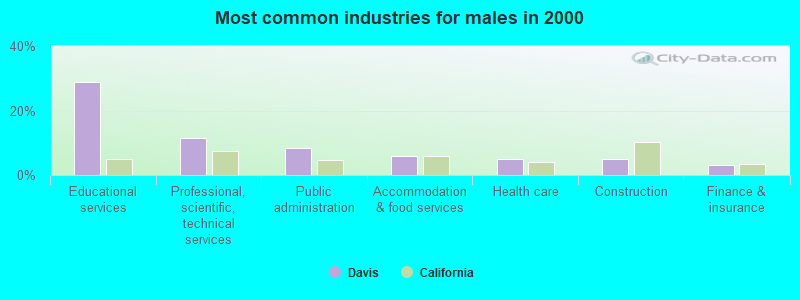
- Educational services (29.0%)
- Professional, scientific, technical services (11.5%)
- Public administration (8.4%)
- Accommodation & food services (5.8%)
- Health care (5.0%)
- Construction (4.9%)
- Finance & insurance (3.0%)
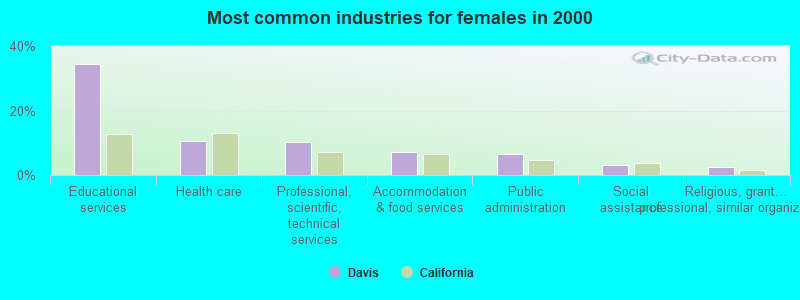
- Educational services (34.4%)
- Health care (10.6%)
- Professional, scientific, technical services (10.3%)
- Accommodation & food services (7.1%)
- Public administration (6.5%)
- Social assistance (3.1%)
- Religious, grantmaking, civic, professional, similar organizations (2.5%)
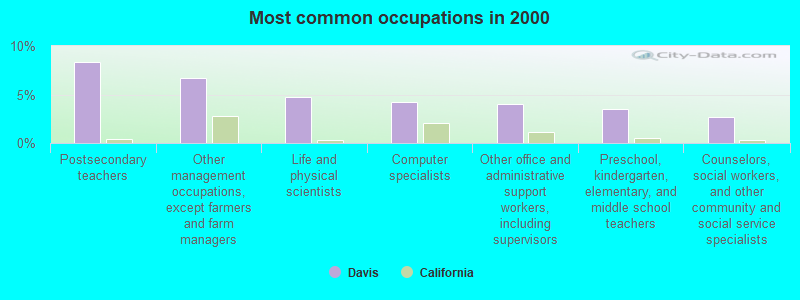
- Postsecondary teachers (8.4%)
- Other management occupations, except farmers and farm managers (6.7%)
- Life and physical scientists (4.7%)
- Computer specialists (4.2%)
- Other office and administrative support workers, including supervisors (4.0%)
- Preschool, kindergarten, elementary, and middle school teachers (3.5%)
- Counselors, social workers, and other community and social service specialists (2.7%)
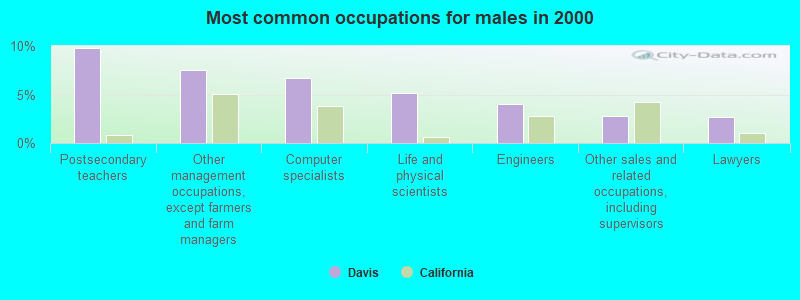
- Postsecondary teachers (9.8%)
- Other management occupations, except farmers and farm managers (7.5%)
- Computer specialists (6.7%)
- Life and physical scientists (5.2%)
- Engineers (4.0%)
- Other sales and related occupations, including supervisors (2.8%)
- Lawyers (2.7%)
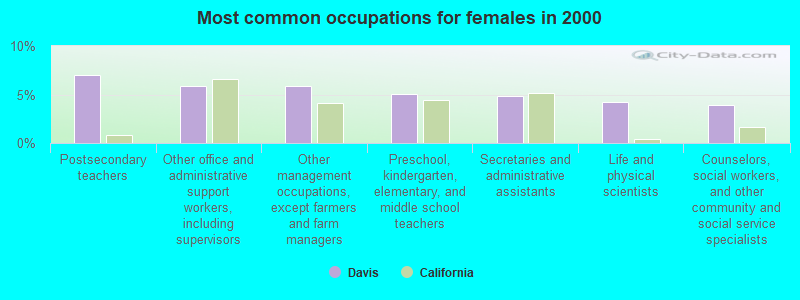
- Postsecondary teachers (7.0%)
- Other office and administrative support workers, including supervisors (5.9%)
- Other management occupations, except farmers and farm managers (5.9%)
- Preschool, kindergarten, elementary, and middle school teachers (5.0%)
- Secretaries and administrative assistants (4.8%)
- Life and physical scientists (4.3%)
- Counselors, social workers, and other community and social service specialists (3.9%)
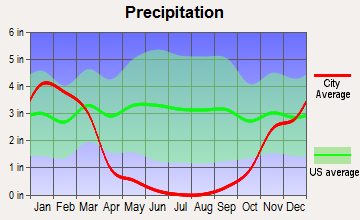
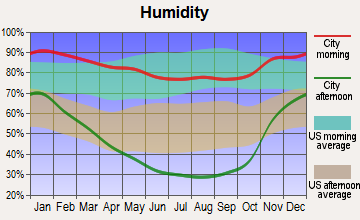
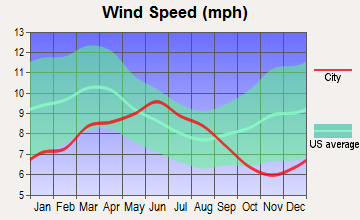
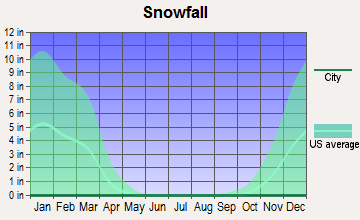
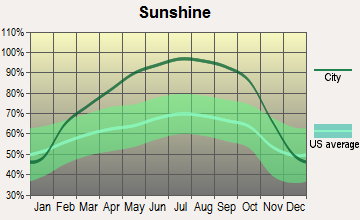
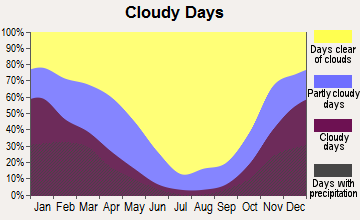
Average climate in Davis, California
Based on data reported by over 4,000 weather stations

|
|

(lower is better)
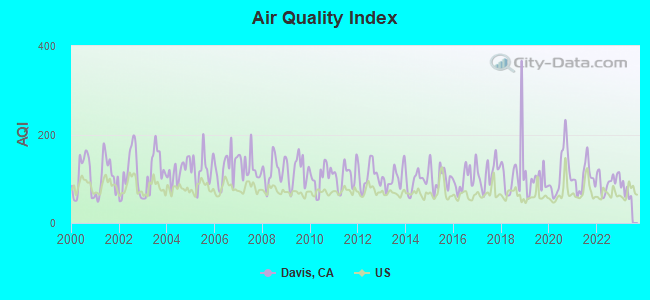
Air Quality Index (AQI) level in 2022 was 93.6. This is worse than average.
| City: | 93.6 |
| U.S.: | 72.6 |
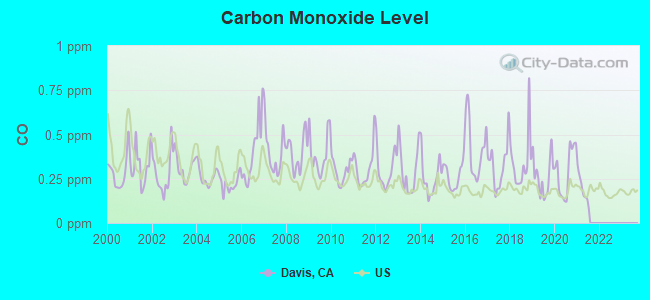
Carbon Monoxide (CO) [ppm] level in 2021 was 0.194. This is better than average. Closest monitor was 0.5 miles away from the city center.
| City: | 0.194 |
| U.S.: | 0.251 |
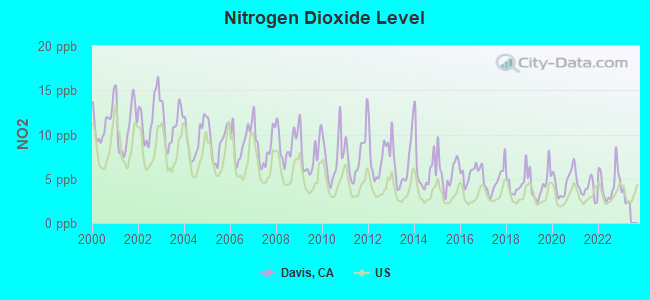
Nitrogen Dioxide (NO2) [ppb] level in 2022 was 4.49. This is about average. Closest monitor was 2.3 miles away from the city center.
| City: | 4.49 |
| U.S.: | 5.11 |
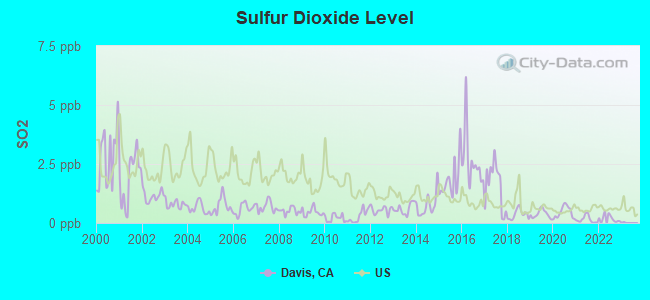
Sulfur Dioxide (SO2) [ppb] level in 2022 was 0.207. This is significantly better than average. Closest monitor was 13.3 miles away from the city center.
| City: | 0.207 |
| U.S.: | 1.515 |
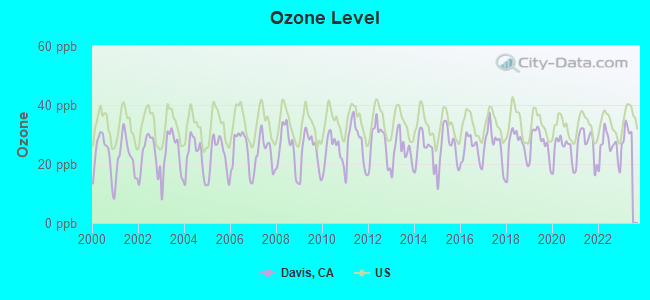
Ozone [ppb] level in 2022 was 25.5. This is better than average. Closest monitor was 0.3 miles away from the city center.
| City: | 25.5 |
| U.S.: | 33.3 |
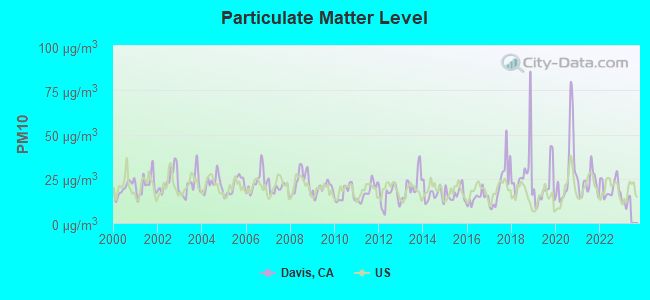
Particulate Matter (PM10) [µg/m3] level in 2022 was 19.9. This is about average. Closest monitor was 7.4 miles away from the city center.
| City: | 19.9 |
| U.S.: | 19.2 |
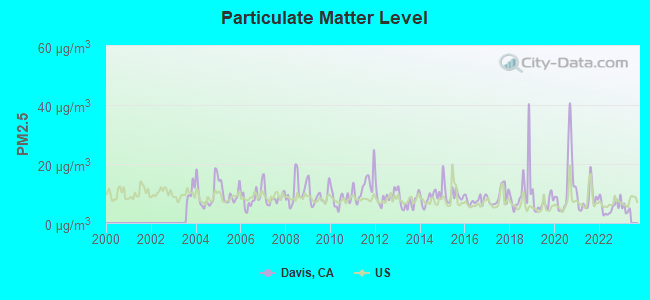
Particulate Matter (PM2.5) [µg/m3] level in 2022 was 5.54. This is significantly better than average. Closest monitor was 7.4 miles away from the city center.
| City: | 5.54 |
| U.S.: | 8.11 |
Earthquake activity:
Davis-area historical earthquake activity is significantly above California state average. It is 7672% greater than the overall U.S. average.On 4/18/1906 at 13:12:21, a magnitude 7.9 (7.9 UK, Class: Major, Intensity: VIII - XII) earthquake occurred 78.5 miles away from the city center, causing $524,000,000 total damage
On 10/18/1989 at 00:04:15, a magnitude 7.1 (6.5 MB, 7.1 MS, 6.9 MW, 7.0 ML) earthquake occurred 99.9 miles away from the city center, causing 62 deaths (62 shaking deaths) and 3757 injuries, causing $1,305,032,704 total damage
On 1/31/1922 at 13:17:28, a magnitude 7.6 (7.6 UK) earthquake occurred 251.6 miles away from the city center
On 10/3/1915 at 06:52:48, a magnitude 7.6 (7.6 UK) earthquake occurred 263.1 miles away from the city center
On 7/21/1952 at 11:52:14, a magnitude 7.7 (7.7 UK) earthquake occurred 288.8 miles away from the city center, causing $50,000,000 total damage
On 4/25/1992 at 18:06:04, a magnitude 7.2 (6.3 MB, 7.1 MS, 7.2 MW, 7.1 MW, Depth: 9.4 mi) earthquake occurred 175.8 miles away from Davis center, causing $75,000,000 total damage
Magnitude types: body-wave magnitude (MB), local magnitude (ML), surface-wave magnitude (MS), moment magnitude (MW)
Natural disasters:
The number of natural disasters in Yolo County (17) is near the US average (15).Major Disasters (Presidential) Declared: 9
Emergencies Declared: 2
Causes of natural disasters: Floods: 12, Winter Storms: 7, Mudslides: 5, Landslides: 4, Storms: 4, Drought: 1, Fire: 1, Freeze: 1, Heavy Rain: 1, Hurricane: 1, Tornado: 1, Other: 1 (Note: some incidents may be assigned to more than one category).
Hospitals and medical centers in Davis:
Airports located in Davis:
- University Airport (EDU) (Runways: 1, Air Taxi Ops: 2,450, Itinerant Ops: 10,000, Local Ops: 12,000, Military Ops: 25)
- Medlock Field Airport (69CL) (Runways: 1)
Amtrak station:
DAVIS (840 2ND ST.) . Services: ticket office, fully wheelchair accessible, enclosed waiting area, public restrooms, public payphones, vending machines, free short-term parking, free long-term parking, call for car rental service, call for taxi service, intercity bus service, public transit connection.College/University in Davis:
Other colleges/universities with over 2000 students near Davis:
- University of Phoenix-Sacramento Valley Campus (about 13 miles; Sacramento, CA; Full-time enrollment: 2,855)
- Universal Technical Institute of Northern California Inc (about 13 miles; Sacramento, CA; FT enrollment: 3,193)
- Sacramento City College (about 14 miles; Sacramento, CA; FT enrollment: 15,963)
- California State University-Sacramento (about 18 miles; Sacramento, CA; FT enrollment: 22,234)
- Cosumnes River College (about 19 miles; Sacramento, CA; FT enrollment: 9,327)
- American River College (about 23 miles; Sacramento, CA; FT enrollment: 20,452)
- Solano Community College (about 31 miles; Fairfield, CA; FT enrollment: 5,790)
Public high schools in Davis:
- DAVIS SENIOR HIGH (Students: 955, Location: 315 W. 14TH ST., Grades: 10-12)
- FRANCES ELLEN WATKINS HARPER JUNIOR HIGH (Students: 728, Location: 4000 E. COVELL BLVD., Grades: 7-9)
- OLIVER WENDELL HOLMES JUNIOR HIGH (Students: 675, Location: 1220 DREXEL DR., Grades: 7-9)
- RALPH WALDO EMERSON JUNIOR HIGH (Students: 459, Location: 2121 CALAVERAS AVE., Grades: 7-9)
- DA VINCI CHARTER ACADEMY (Students: 163, Location: 1400 E. EIGHTH ST., Grades: 7-12, Charter school)
- DAVIS SCHOOL FOR INDEPENDENT STUDY (Students: 76, Location: 526 B ST., Grades: KG-12)
- KING (MARTIN LUTHER) HIGH (CONTINUATION) (Students: 6, Location: 635 B ST., Grades: 9-12)
Private high school in Davis:
Public elementary/middle schools in Davis:
- BIRCH LANE ELEMENTARY (Students: 417, Location: 1600 BIRCH LN., Grades: KG-6)
- NORTH DAVIS ELEMENTARY (Students: 417, Location: 555 E. 14TH ST., Grades: KG-6)
- CESAR CHAVEZ ELEMENTARY (Students: 377, Location: 1221 ANDERSON RD., Grades: KG-6)
- ROBERT E. WILLETT ELEMENTARY (Students: 358, Location: 1207 SYCAMORE LN., Grades: KG-6)
- PATWIN ELEMENTARY (Students: 320, Location: 2222 SHASTA DR., Grades: KG-6)
- FRED T. KOREMATSU ELEMENTARY SCHOOL AT MACE RANCH (Students: 316, Location: 3100 LOYOLA DR., Grades: KG-6)
- MARGUERITE MONTGOMERY ELEMENTARY (Students: 305, Location: 1441 DANBURY DR., Grades: KG-6)
- FAIRFIELD ELEMENTARY (Students: 29, Location: 26960 CO RD. 96, Grades: KG-3)
- PIONEER ELEMENTARY (Location: 5215 HAMEL ST., Grades: KG-6)
Private elementary/middle schools in Davis:
User-submitted facts and corrections:
- There's a superfund site in Davis just north of the 80 on 2nd st.
- Zip codes: 95616, 95618 added by Jenn
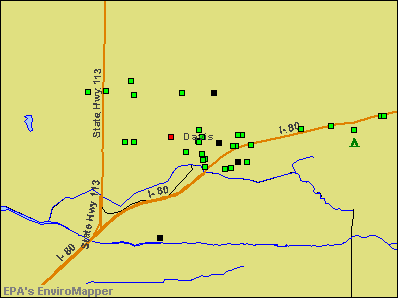
Points of interest:
Notable locations in Davis: State Nursery Division of Forestry (A), Veterans Memorial Building (B), Davis Branch Yolo County Library (C), Webster Hall (D), Voorhies Hall (E), Thoreau Hall (F), Emerson Hall (G), Davis Fire Department Station 32 (H), Davis Fire Department Station 33 (I), Davis Fire Department Station 31 (J). Display/hide their locations on the map
Shopping Centers: University Mall Shopping Center (1), Lucky Shopping Center (2). Display/hide their locations on the map
Church in Davis: First Church of Christ Scientist (A). Display/hide its location on the map
Cemetery: Davis Cemetery (1). Display/hide its location on the map
Reservoir: Stonegate Lake (A). Display/hide its location on the map
Creek: Putah Creek (A). Display/hide its location on the map
Parks in Davis include: Dewey Halden Field (1), Cedar Park (2), Central Park (3), Chestnut Park (4), Civic Center Park (5), College Park (6), Community Park (7), Covell Park (8), Hill Park (9). Display/hide their locations on the map
Hotels: Best Western University Lodge (123 B Street) (1), Aggie Inn (245 1st Street) (2), Best Western Palm Court Hotel (234 D Street) (3). Display/hide their approximate locations on the map
Birthplace of: Chi Cheng (musician) - Bass guitarist, Rita Hosking - Bluegrass musician, Jason Fisk - 2005 NFL player (Cleveland Browns, born: Sep 4, 1972), Ladule Lako LoSarah - Soccer player, Myril Hoag - Baseball player, Robert Zirkin - Maryland politician, Scott Brant (speedway rider) - Speedway rider, Tony Cline Jr. - Football player.
Drinking water stations with addresses in Davis and their reported violations in the past:
SCIOTS TRACT WATER SYSTEM (Population served: 100, Surface water):Past monitoring violations:YOLO FRUIT STAND - WATER (Population served: 30, Groundwater):
- One routine major monitoring violation
Past health violations:YOLO BYPASS WILDLIFE AREA (Population served: 25, Groundwater):
- MCL, Monthly (TCR) - In AUG-2011, Contaminant: Coliform. Follow-up actions: St Compliance achieved (AUG-24-2011), St Violation/Reminder Notice (AUG-24-2011)
- MCL, Monthly (TCR) - In JUN-2008, Contaminant: Coliform
- MCL, Monthly (TCR) - In JUN-2008, Contaminant: Coliform. Follow-up actions: St Public Notif requested (MAY-29-2008), St Compliance achieved (JUN-20-2008)
- MCL, Monthly (TCR) - In MAY-2008, Contaminant: Coliform
- MCL, Monthly (TCR) - In MAY-2008, Contaminant: Coliform. Follow-up actions: St Tech Assistance Visit (MAY-29-2008), St Public Notif requested (MAY-29-2008), St Violation/Reminder Notice (MAY-29-2008)
- MCL, Monthly (TCR) - In AUG-2005, Contaminant: Coliform
- 3 other older health violations
Past health violations:
- MCL, Monthly (TCR) - In JAN-2012, Contaminant: Coliform. Follow-up actions: St Compliance achieved (JAN-26-2012)
- MCL, Monthly (TCR) - In MAY-2008, Contaminant: Coliform. Follow-up actions: St Site Visit (enforcement) (OCT-19-2005), St Compliance achieved (MAY-06-2008)
- MCL, Monthly (TCR) - In MAY-2008, Contaminant: Coliform
- MCL, Monthly (TCR) - In OCT-2005, Contaminant: Coliform
- MCL, Monthly (TCR) - In OCT-2005, Contaminant: Coliform. Follow-up actions: St Violation/Reminder Notice (OCT-19-2005), St Site Visit (enforcement) (OCT-19-2005), St Public Notif requested (OCT-19-2005)
- MCL, Monthly (TCR) - In JUL-2005, Contaminant: Coliform
- MCL, Monthly (TCR) - In JUL-2005, Contaminant: Coliform. Follow-up actions: St Site Visit (enforcement) (JUL-15-2005), St Public Notif requested (JUL-15-2005)
Drinking water stations with addresses in Davis that have no violations reported:
- DAVIS GOLF COURSE (Population served: 100, Primary Water Source Type: Groundwater)
- GRASSLAND PARK HOST WELL (OLD YOLO BOWME (Population served: 50, Primary Water Source Type: Groundwater)
| This city: | 2.5 people |
| California: | 2.9 people |
| This city: | 47.9% |
| Whole state: | 68.7% |
| This city: | 6.1% |
| Whole state: | 7.2% |
Likely homosexual households (counted as self-reported same-sex unmarried-partner households)
- Lesbian couples: 0.6% of all households
- Gay men: 0.2% of all households
People in group quarters in Davis in 2010:
- 1,632 people in college/university student housing
- 203 people in nursing facilities/skilled-nursing facilities
- 121 people in other noninstitutional facilities
- 74 people in residential treatment centers for juveniles (non-correctional)
- 33 people in emergency and transitional shelters (with sleeping facilities) for people experiencing homelessness
- 24 people in group homes intended for adults
- 11 people in residential treatment centers for adults
- 2 people in workers' group living quarters and job corps centers
People in group quarters in Davis in 2000:
- 2,377 people in college dormitories (includes college quarters off campus)
- 254 people in nursing homes
- 136 people in other noninstitutional group quarters
- 108 people in other group homes
- 67 people in homes or halfway houses for drug/alcohol abuse
- 15 people in other nonhousehold living situations
- 13 people in homes for the mentally retarded
Banks with branches in Davis (2011 data):
- Wells Fargo Bank, National Association: Covell Market Place Branch, Davis Branch, Safeway South Davis Branch. Info updated 2011/04/05: Bank assets: $1,161,490.0 mil, Deposits: $905,653.0 mil, headquarters in Sioux Falls, SD, positive income, 6395 total offices, Holding Company: Wells Fargo & Company
- First Northern Bank of Dixon: University Retirement Community Bran, Davis Branch, Davis Real Estate Office Branch. Info updated 2006/11/03: Bank assets: $781.6 mil, Deposits: $684.6 mil, headquarters in Dixon, CA, positive income, Commercial Lending Specialization, 19 total offices, Holding Company: First Northern Community Bancorp
- JPMorgan Chase Bank, National Association: Second And Faraday Banking Center Br at 4525 Fermi Place, branch established on 2012/03/06; Davis Branch at 330 E Street, branch established on 1924/01/01. Info updated 2011/11/10: Bank assets: $1,811,678.0 mil, Deposits: $1,190,738.0 mil, headquarters in Columbus, OH, positive income, International Specialization, 5577 total offices, Holding Company: Jpmorgan Chase & Co.
- Bank of America, National Association: Davis Branch at 325 E Street, branch established on 1934/12/10. Info updated 2009/11/18: Bank assets: $1,451,969.3 mil, Deposits: $1,077,176.8 mil, headquarters in Charlotte, NC, positive income, 5782 total offices, Holding Company: Bank Of America Corporation
- PremierWest Bank: Davis Branch at 333a F Street, branch established on 2009/07/17. Info updated 2011/05/20: Bank assets: $1,264.9 mil, Deposits: $1,128.9 mil, headquarters in Medford, OR, negative income in the last year, Commercial Lending Specialization, 46 total offices, Holding Company: Premierwest Bancorp
- Union Bank, National Association: Davis Branch at 300 E Street, branch established on 1965/05/17. Info updated 2011/09/01: Bank assets: $88,967.5 mil, Deposits: $65,286.4 mil, headquarters in San Francisco, CA, positive income, Commercial Lending Specialization, 403 total offices, Holding Company: Mitsubishi Ufj Financial Group, Inc.
- U.S. Bank National Association: Davis Main Branch at 304 F Street, branch established on 1926/01/01. Info updated 2012/01/30: Bank assets: $330,470.8 mil, Deposits: $236,091.5 mil, headquarters in Cincinnati, OH, positive income, 3121 total offices, Holding Company: U.S. Bancorp
- River City Bank: Davis Office at 239 E Street, branch established on 1998/03/09. Info updated 2006/11/03: Bank assets: $1,119.8 mil, Deposits: $900.1 mil, headquarters in Sacramento, CA, positive income, Commercial Lending Specialization, 15 total offices
For population 15 years and over in Davis:
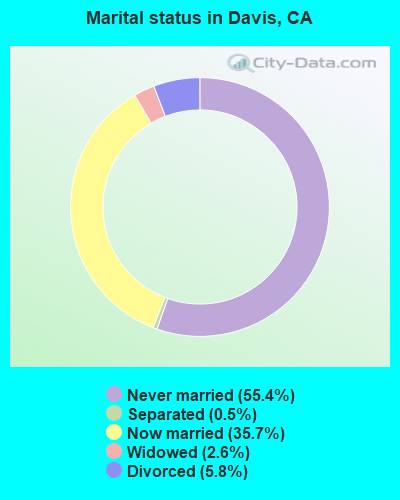
- Never married: 55.4%
- Now married: 35.7%
- Separated: 0.5%
- Widowed: 2.6%
- Divorced: 5.8%
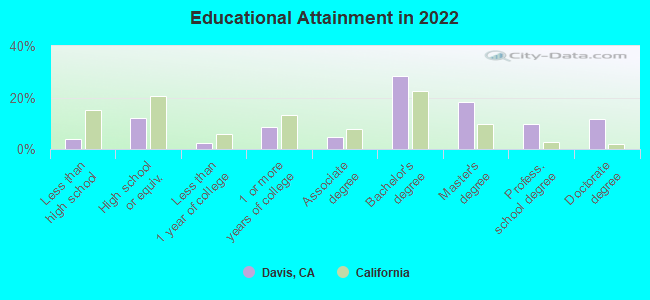
For population 25 years and over in Davis:
- High school or higher: 96.0%
- Bachelor's degree or higher: 68.4%
- Graduate or professional degree: 39.9%
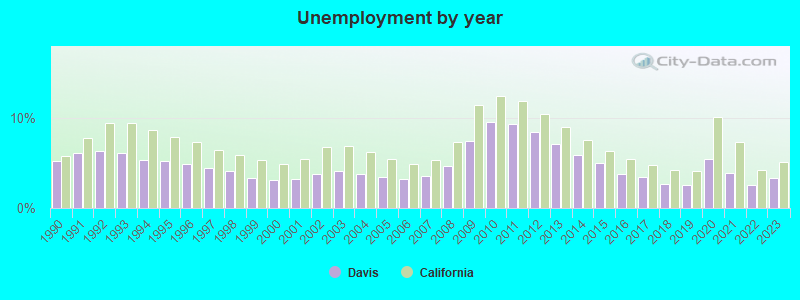
- Unemployed: 4.4%
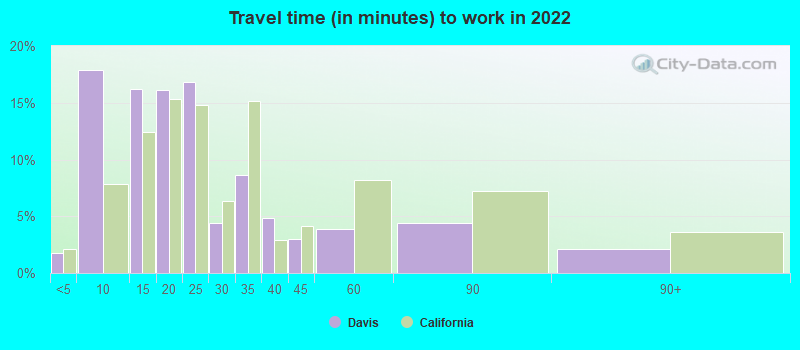
- Mean travel time to work (commute): 22.6 minutes
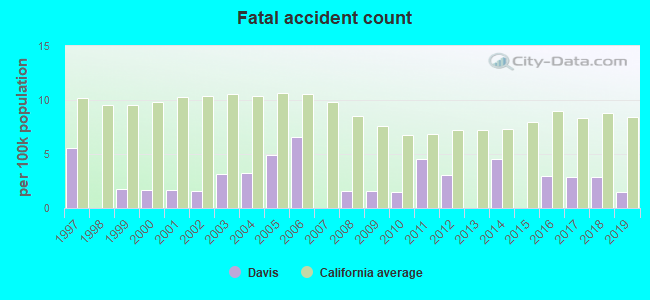
| Here: | 11.3 |
| California average: | 15.5 |
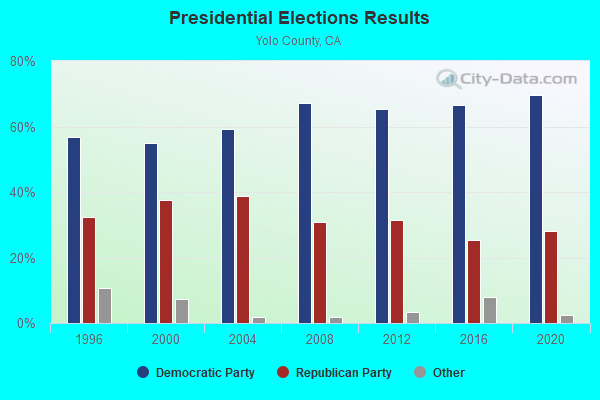
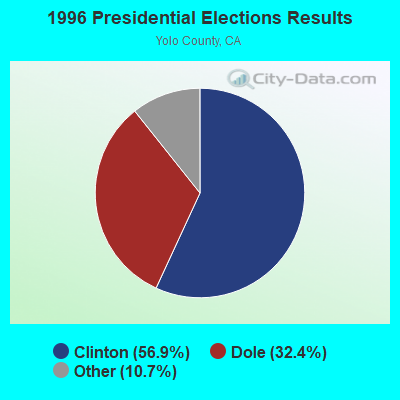
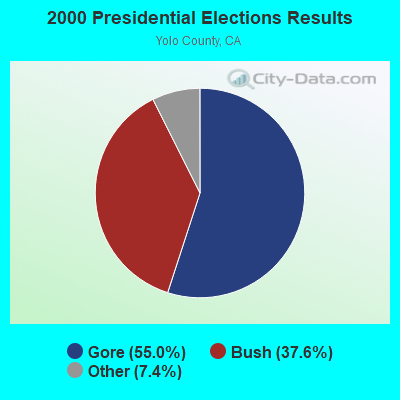
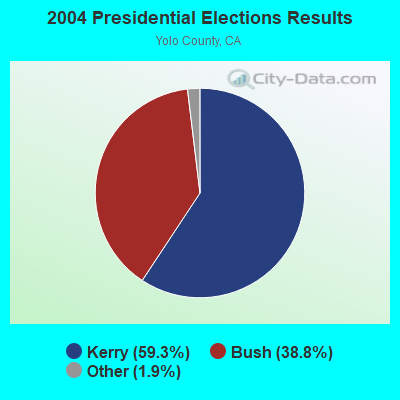

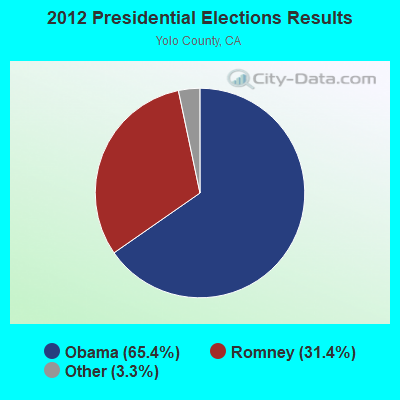
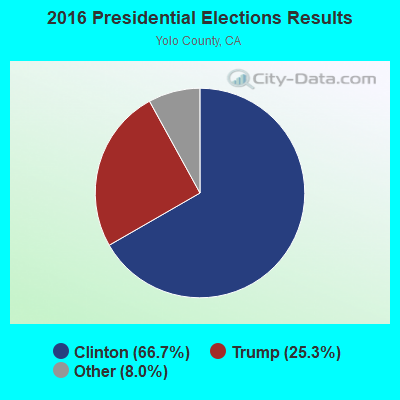
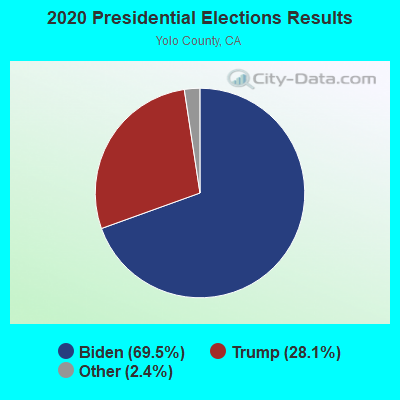
Graphs represent county-level data. Detailed 2008 Election Results
Neighborhoods in Davis:
(Davis, California Neighborhood Map)- 1917 Core neighborhood
- Adams Terrace neighborhood
- Aggie Village neighborhood
- Anderson Place neighborhood
- Antelope Avenue neighborhood
- Arbors at Oakshade neighborhood
- Arlington Farm neighborhood
- Arrowhead neighborhood
- Aspen neighborhood
- Bautista Addition neighborhood
- Binning Tract neighborhood
- Bowers Acres neighborhood
- Carden Estates neighborhood
- Casa Del Oro neighborhood
- Cassel Lane neighborhood
- Central Davis neighborhood
- Chinquapin dos Pinos neighborhood
- College Park neighborhood
- College Town Commons neighborhood
- Cottages North neighborhood
- Cottages South neighborhood
- Country Lane Estates neighborhood
- Covell Commons neighborhood
- Covell Farms neighborhood
- Covell Health Center neighborhood
- Covell Park neighborhood
- Covell Park Northstar neighborhood
- Crocker neighborhood
- D Street Terrace neighborhood
- Davis Commercial Center neighborhood
- Davis Manor neighborhood
- Davis Parkside neighborhood
- Davis Villas neighborhood
- Dos Pinos neighborhood
- Downtown Core neighborhood
- East Acres neighborhood
- El Macero neighborhood
- El Macero Central neighborhood
- El Macero Estates neighborhood
- El Macero Gardens neighborhood
- El Macero Park neighborhood
- El Macero Vista neighborhood
- Elmwood neighborhood
- Evergreen neighborhood
- Evergreen Meadows neighborhood
- Fifth Street Commerce Center neighborhood
- Fuller Gardens neighborhood
- Gentry Greens neighborhood
- Glacier Place neighborhood
- Glide Place neighborhood
- Grande neighborhood
- Green Meadows neighborhood
- Green Meadows Office Park neighborhood
- Greene Terrace neighborhood
- Harrison Business Park neighborhood
- Holly Acres neighborhood
- Huntwood Park neighborhood
- Industrial / Business Park neighborhood
- Interland (Interland/University Research Park) neighborhood
- Ivy Town neighborhood
- Ivy Town North neighborhood
- Jefferson Square neighborhood
- Kaufmann and Broad neighborhood
- La Buena Vida neighborhood
- Lake Alhambre neighborhood
- Lakeside Greens neighborhood
- Lands Of Carden neighborhood
- Lewis Homes neighborhood
- Liggetts Covell Park neighborhood
- Lillard Addition neighborhood
- Longview Cottages neighborhood
- Los Robles Manors neighborhood
- Mace Cowell neighborhood
- Mace Ranch neighborhood
- Mace Ranch Business Park neighborhood
- Mace Ranch Industrial Park neighborhood
- Mace Ranch Park neighborhood
- Macero Del Norte neighborhood
- Mathews Tract neighborhood
- Mcnece Parcel Map neighborhood
- Meadowlark Lane neighborhood
- Midtown Business Park neighborhood
- Millers Addition neighborhood
- North Davis Farms neighborhood
- Northstar neighborhood
- Northwest Triangle neighborhood
- Norwood neighborhood
- Oak Avenue Condominium Plan neighborhood
- Oak Avenue Place neighborhood
- Oak Condominium Plan neighborhood
- Oakensheild Condominiums neighborhood
- Oaks At El Macero neighborhood
- Oakshade neighborhood
- Oakside neighborhood
- Oasis Place neighborhood
- Oeste Manor neighborhood
- Old Davis North neighborhood
- Old East Davis neighborhood
- Old Mill Place neighborhood
- Old Willowbank neighborhood
- Olive Drive neighborhood
- Pajaro neighborhood
- Pamplona Place neighborhood
- Parque Santiago neighborhood
- Phoenix Place neighborhood
- Plaza Condominiums neighborhood
- Quail Ridge neighborhood
- Ranch Macero neighborhood
- Rancho Yolo neighborhood
- Reflections At Mace Ranch neighborhood
- Richmond American Homes neighborhood
- Robbins Subdivision neighborhood
- Rose Creek neighborhood
- Rosecreek neighborhood
- Royal Oaks neighborhood
- Russell Townhomes neighborhood
- Schultz / Mcgregor neighborhood
- Senda Nueva neighborhood
- Senda Nueva Commons neighborhood
- Senda Nueva Creekview neighborhood
- Senda Nueva Village neighborhood
- Sequoia Villas neighborhood
- Sierra Vista Oaks neighborhood
- Simmons Estates neighborhood
- Slide Hill Park neighborhood
- South Cape neighborhood
- South Davis Plaza neighborhood
- South Manor neighborhood
- Southfield Park neighborhood
- Stockseth Acres neighborhood
- Stonegate neighborhood
- Stonegate Park neighborhood
- Strengs Covell Park neighborhood
- Sunnyside neighborhood
- Sunnyside Unit neighborhood
- Sunrise neighborhood
- Sycamore North Commons neighborhood
- Sycamore North East neighborhood
- Sycamore South neighborhood
- Sycamore West neighborhood
- The Cottages At Atlantis neighborhood
- The Cotteges At Fifth Street neighborhood
- The Marketplace neighborhood
- Traynhams Addition neighborhood
- Triebhaus neighborhood
- University Avenue neighborhood
- University Estates neighborhood
- University Farms neighborhood
- University Meadows neighborhood
- University Park neighborhood
- University Village neighborhood
- Veranda Homes neighborhood
- Village Homes neighborhood
- Voyager/intercoast neighborhood
- Waggner Ranch neighborhood
- West Davis Manor neighborhood
- West Manor neighborhood
- West Park neighborhood
- Westernesse Condominium Plan neighborhood
- Westwood neighborhood
- Wildhorse neighborhood
- Wildhorse GC neighborhood
- Willow Creek neighborhood
- Willowbank neighborhood
- Willowcreek neighborhood
- Woodbridge neighborhood
- Woods neighborhood
- Wray Addition neighborhood
Religion statistics for Davis, CA (based on Yolo County data)
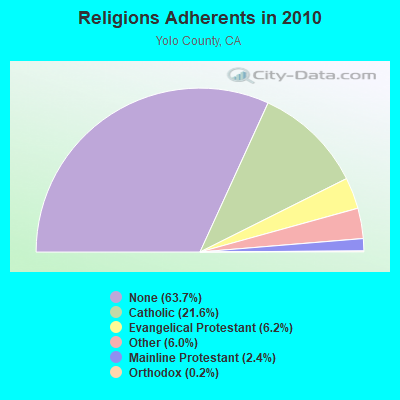
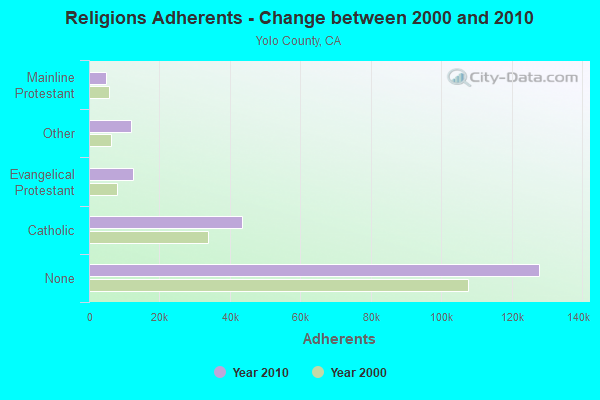
| Religion | Adherents | Congregations |
|---|---|---|
| Catholic | 43,358 | 12 |
| Evangelical Protestant | 12,405 | 74 |
| Other | 11,958 | 30 |
| Mainline Protestant | 4,893 | 20 |
| Orthodox | 350 | 2 |
| None | 127,885 | - |
Food Environment Statistics:
| Yolo County: | 2.06 / 10,000 pop. |
| State: | 2.14 / 10,000 pop. |
| Yolo County: | 0.87 / 10,000 pop. |
| California: | 0.62 / 10,000 pop. |
| Here: | 2.06 / 10,000 pop. |
| California: | 1.49 / 10,000 pop. |
| This county: | 6.32 / 10,000 pop. |
| California: | 7.42 / 10,000 pop. |
| Yolo County: | 6.2% |
| California: | 7.3% |
| Yolo County: | 25.4% |
| California: | 21.3% |
| Yolo County: | 17.4% |
| California: | 17.9% |
Health and Nutrition:
| Davis: | 54.1% |
| California: | 49.4% |
| Davis: | 56.3% |
| California: | 48.0% |
| Here: | 26.8 |
| California: | 28.1 |
| Davis: | 16.8% |
| California: | 20.2% |
| Davis: | 10.0% |
| California: | 11.2% |
| This city: | 6.9 |
| California: | 6.8 |
| This city: | 26.8% |
| California: | 31.5% |
| Here: | 63.5% |
| State: | 56.4% |
| Davis: | 84.2% |
| California: | 80.9% |
More about Health and Nutrition of Davis, CA Residents
| Local government employment and payroll (March 2022) | |||||
| Function | Full-time employees | Monthly full-time payroll | Average yearly full-time wage | Part-time employees | Monthly part-time payroll |
|---|---|---|---|---|---|
| Police Protection - Officers | 60 | $609,402 | $121,880 | 0 | $0 |
| Firefighters | 46 | $548,455 | $143,075 | 0 | $0 |
| Other Government Administration | 40 | $213,628 | $64,088 | 0 | $0 |
| Streets and Highways | 37 | $364,775 | $118,305 | 1 | $2,226 |
| Financial Administration | 33 | $200,713 | $72,987 | 0 | $0 |
| Police - Other | 33 | $181,524 | $66,009 | 0 | $0 |
| Welfare | 20 | $30,155 | $18,093 | 3 | $5,303 |
| Water Supply | 17 | $118,331 | $83,528 | 0 | $0 |
| Sewerage | 17 | $104,150 | $73,518 | 0 | $0 |
| Parks and Recreation | 16 | $143,121 | $107,341 | 111 | $22,925 |
| Housing and Community Development (Local) | 11 | $78,232 | $85,344 | 1 | $456 |
| Solid Waste Management | 10 | $72,282 | $86,738 | 1 | $2,913 |
| Natural Resources | 4 | $19,319 | $57,957 | 2 | $2,600 |
| Other and Unallocable | 3 | $20,785 | $83,140 | 0 | $0 |
| Fire - Other | 1 | $6,194 | $74,328 | 2 | $2,600 |
| Totals for Government | 348 | $2,711,067 | $93,485 | 121 | $39,023 |
Davis government finances - Expenditure in 2021 (per resident):
- Construction - Regular Highways: $10,867,000 ($162.08)
Parks and Recreation: $529,000 ($7.89)
Police Protection: $274,000 ($4.09)
General - Other: $226,000 ($3.37)
- Current Operations - Police Protection: $20,588,000 ($307.06)
General - Other: $16,559,000 ($246.97)
Sewerage: $15,456,000 ($230.52)
Water Utilities: $15,341,000 ($228.81)
Local Fire Protection: $13,874,000 ($206.93)
Central Staff Services: $13,194,000 ($196.78)
Solid Waste Management: $13,089,000 ($195.22)
Parks and Recreation: $12,931,000 ($192.86)
Transit Utilities: $7,450,000 ($111.11)
Protective Inspection and Regulation - Other: $4,019,000 ($59.94)
Regular Highways: $2,751,000 ($41.03)
Health - Other: $2,242,000 ($33.44)
Housing and Community Development: $2,144,000 ($31.98)
- General - Interest on Debt: $1,451,000 ($21.64)
- Water Utilities - Interest on Debt: $2,501,000 ($37.30)
Davis government finances - Revenue in 2021 (per resident):
- Charges - Sewerage: $16,387,000 ($244.41)
Solid Waste Management: $13,537,000 ($201.90)
Other: $9,266,000 ($138.20)
Parks and Recreation: $1,073,000 ($16.00)
- Federal Intergovernmental - Other: $14,415,000 ($215.00)
Transit Utilities: $6,281,000 ($93.68)
Housing and Community Development: $709,000 ($10.57)
- Local Intergovernmental - Other: $69,000 ($1.03)
- Miscellaneous - General Revenue - Other: $9,957,000 ($148.51)
Rents: $1,248,000 ($18.61)
Special Assessments: $540,000 ($8.05)
Interest Earnings: $259,000 ($3.86)
Fines and Forfeits: $259,000 ($3.86)
Donations From Private Sources: $100,000 ($1.49)
- Revenue - Water Utilities: $26,380,000 ($393.45)
Transit Utilities: $118,000 ($1.76)
- State Intergovernmental - Other: $3,739,000 ($55.77)
Highways: $2,832,000 ($42.24)
Transit Utilities: $631,000 ($9.41)
General Local Government Support: $112,000 ($1.67)
- Tax - Property: $26,828,000 ($400.13)
Other: $14,205,000 ($211.86)
General Sales and Gross Receipts: $11,235,000 ($167.57)
Occupation and Business License - Other: $4,610,000 ($68.76)
Other License: $3,593,000 ($53.59)
Public Utilities Sales: $1,629,000 ($24.30)
Other Selective Sales: $1,580,000 ($23.57)
Documentary and Stock Transfer: $302,000 ($4.50)
Davis government finances - Debt in 2021 (per resident):
- Long Term Debt - Outstanding Unspecified Public Purpose: $129,678,000 ($1934.11)
Beginning Outstanding - Unspecified Public Purpose: $127,975,000 ($1908.71)
Issue, Unspecified Public Purpose: $7,948,000 ($118.54)
Retired Unspecified Public Purpose: $6,246,000 ($93.16)
Davis government finances - Cash and Securities in 2021 (per resident):
- Bond Funds - Cash and Securities: $5,470,000 ($81.58)
- Other Funds - Cash and Securities: $111,802,000 ($1667.49)
- Sinking Funds - Cash and Securities: $11,590,000 ($172.86)
| Businesses in Davis, CA | ||||
| Name | Count | Name | Count | |
|---|---|---|---|---|
| 7-Eleven | 1 | Hyatt | 1 | |
| AT&T | 3 | IHOP | 1 | |
| Ace Hardware | 1 | Jack In The Box | 1 | |
| Applebee's | 1 | Jones New York | 1 | |
| Baja Fresh Mexican Grill | 1 | KFC | 1 | |
| Baskin-Robbins | 1 | La Quinta | 1 | |
| Bath & Body Works | 1 | Lane Furniture | 1 | |
| Ben & Jerry's | 1 | Little Caesars Pizza | 1 | |
| Best Western | 2 | McDonald's | 2 | |
| Big O Tires | 1 | Motel 6 | 1 | |
| Blockbuster | 1 | New Balance | 2 | |
| Burger King | 2 | Nike | 4 | |
| CVS | 2 | Nissan | 1 | |
| Carl\s Jr. | 2 | OfficeMax | 1 | |
| Chevrolet | 1 | Panda Express | 1 | |
| Chipotle | 1 | Quiznos | 1 | |
| Circle K | 1 | RadioShack | 1 | |
| Comfort Suites | 1 | Rite Aid | 2 | |
| Curves | 1 | Starbucks | 7 | |
| DHL | 4 | Subway | 5 | |
| Dairy Queen | 1 | T-Mobile | 1 | |
| Days Inn | 1 | Taco Bell | 2 | |
| Domino's Pizza | 1 | Target | 1 | |
| Econo Lodge | 1 | Toyota | 1 | |
| FedEx | 9 | Trader Joe's | 1 | |
| Forever 21 | 1 | U-Haul | 2 | |
| GNC | 3 | UPS | 8 | |
| GameStop | 2 | Vans | 1 | |
| Gap | 1 | Vons | 2 | |
| H&R Block | 1 | Wendy's | 1 | |
| Honda | 1 | |||
Strongest AM radio stations in Davis:
- KSTE (650 AM; 25 kW; RANCHO CORDOVA, CA; Owner: AMFM RADIO LICENSES, L.L.C.)
- KFBK (1530 AM; 50 kW; SACRAMENTO, CA; Owner: AMFM RADIO LICENSES, L.L.C.)
- KHTK (1140 AM; 50 kW; SACRAMENTO, CA; Owner: INFINITY RADIO SUBSIDIARY OPERATIONS INC.)
- KFIA (710 AM; 25 kW; CARMICHAEL, CA; Owner: VISTA BROADCASTING INC.)
- KCTC (1320 AM; 5 kW; SACRAMENTO, CA; Owner: ENTERCOM SACRAMENTO LICENSE, LLC)
- KSMH (1620 AM; 10 kW; WEST SACRAMENTO, CA; Owner: IHR EDUCATIONAL BROADCASTING)
- KCBS (740 AM; 50 kW; SAN FRANCISCO, CA; Owner: INFINITY BROADCASTING OPERATIONS, INC.)
- KTRB (860 AM; 50 kW; MODESTO, CA; Owner: PAPPAS RADIO OF CALIFORNIA, A CALIFORNIA LIMITED PARTNERSHIP)
- KIID (1470 AM; 5 kW; SACRAMENTO, CA; Owner: ABC, INC.)
- KCBC (770 AM; 50 kW; RIVERBANK, CA; Owner: KIERTRON, INC.)
- KNBR (680 AM; 50 kW; SAN FRANCISCO, CA; Owner: KNBR LICO, INC.)
- KGO (810 AM; 50 kW; SAN FRANCISCO, CA; Owner: KGO-AM RADIO, INC.)
- KTCT (1050 AM; 50 kW; SAN MATEO, CA; Owner: SUSQUEHANNA RADIO CORP.)
Strongest FM radio stations in Davis:
- KSFM (102.5 FM; WOODLAND, CA; Owner: INFINITY RADIO OF SACRAMENTO, INC.)
- KDVS (90.3 FM; DAVIS, CA; Owner: REGENTS OF THE UNIV. OF CALIFORNIA)
- KRRE (104.3 FM; DAVIS, CA; Owner: ENTRAVISION HOLDINGS, LLC)
- KUIC (95.3 FM; VACAVILLE, CA; Owner: KUIC, INC.)
- K259AP (99.7 FM; DAVIS, CA; Owner: CALIFORNIA STATE UNIV., SACRAMENTO)
- KXCL (103.9 FM; YUBA CITY, CA; Owner: HARLAN COMMUNICATIONS, INC.)
- KKSF-FM1 (103.7 FM; PLEASANTON, ETC., CA; Owner: AMFM RADIO LICENSES, L.L.C.)
- KYMX (96.1 FM; SACRAMENTO, CA; Owner: INFINITY RADIO OPERATIONS INC.)
- KBLX-FM2 (102.9 FM; PLEASANTON, CA; Owner: ICBC BROADCAST HOLDINGS -CA, INC.)
- KSOL-FM3 (98.9 FM; PLEASANTON, CA; Owner: TMS LICENSE CALIFORNIA, INC)
- KFRC-FM3 (99.7 FM; WALNUT CREEK, CA; Owner: INFINITY KFRC-FM, INC.)
- KZBR-FM1 (95.7 FM; WALNUT CREEK, CA; Owner: BONNEVILLE HOLDING COMPANY)
- KNDL (89.9 FM; ANGWIN, CA; Owner: HOWELL MOUNTAIN BROADCASTING COMPANY)
- KISQ-FM3 (98.1 FM; CONCORD, CA; Owner: AMFM RADIO LICENSES, L.L.C.)
- KLVR (91.9 FM; SANTA ROSA, CA; Owner: EDUCATIONAL MEDIA FOUNDATION)
- KMEL-FM1 (106.1 FM; CONCORD, CA; Owner: AMFM RADIO LICENSES, L.L.C.)
- KXTS (100.9 FM; CALISTOGA, CA; Owner: SINCLAIR TELECABLE, INC.)
- KBBF (89.1 FM; SANTA ROSA, CA; Owner: BILINGUAL B/CING. FOUNDATION, INC.)
- K284AG (104.7 FM; WOODLAND, CA; Owner: EDUCATIONAL MEDIA FOUNDATION)
- KRCX-FM (99.9 FM; MARYSVILLE, CA; Owner: ENTRAVISION HOLDINGS, LLC)
TV broadcast stations around Davis:
- KEZT-CA (Channel 23; SACRAMENTO, CA; Owner: TELEFUTURA SACRAMENTO LLC)
- KSPX (Channel 29; SACRAMENTO, CA; Owner: PAXSON SACRAMENTO LICENSE, INC.)
- KTXL (Channel 40; SACRAMENTO, CA; Owner: CHANNEL 40, INC.)
- KVIE (Channel 6; SACRAMENTO, CA; Owner: KVIE, INC.)
- KQCA (Channel 58; STOCKTON, CA; Owner: KCRA HEARST-ARGYLE TELEVISION, INC.)
- KCRA-TV (Channel 3; SACRAMENTO, CA; Owner: KCRA HEARST-ARGYLE TELEVISION, INC.)
- KOVR (Channel 13; STOCKTON, CA; Owner: SCI - SACRAMENTO LICENSEE, LLC)
- KXTV (Channel 10; SACRAMENTO, CA; Owner: KXTV, INC.)
- KMAX-TV (Channel 31; SACRAMENTO, CA; Owner: UPN STATIONS GROUP INC.)
- KUVS (Channel 19; MODESTO, CA; Owner: KUVS LICENSE PARTNERSHIP, G.P.)
- KMMK-LP (Channel 14; SACRAMENTO, CA; Owner: CABALLERO TELEVISION TEXAS, L.L.C.)
- KRJR-LP (Channel 47; SACRAMENTO, CA; Owner: WORD OF GOD FELLOWSHIP, INC.)
- K69FB (Channel 69; SACRAMENTO, CA; Owner: TRINITY BROADCASTING NETWORK)
- K17EH (Channel 17; EUREKA, CA; Owner: MS COMMUNICATIONS, LLC)
- KSAO-LP (Channel 49; SACRAMENTO, CA; Owner: GARY M. COCOLA FAMILY TRUST, GARY M. COCOLA TRUSTEE)
- KBTV-LP (Channel 8; SACRAMENTO, CA; Owner: INCISOR COMMUNICATIONS, L.L.C.)
- KMUM-CA (Channel 15; SACRAMENTO, CA; Owner: CABALLERO TELEVISION TEXAS, L.L.C.)
- KCSO-LP (Channel 33; SACRAMENTO, CA; Owner: SAINTE 51, L.P.)
- K61DW (Channel 61; SACRAMENTO, CA; Owner: DR. W. R. PORTEE)
- KSTV-LP (Channel 60; SACRAMENTO, CA; Owner: GARY M. COCOLA FAMILY TRUST, GARY M. COCOLA TRUSTEE)
- K22FR (Channel 22; SACRAMENTO, CA; Owner: NATIONAL MINORITY T.V., INC.)
- National Bridge Inventory (NBI) Statistics
- 46Number of bridges
- 886ft / 270mTotal length
- 1,338,038Total average daily traffic
- 120,557Total average daily truck traffic
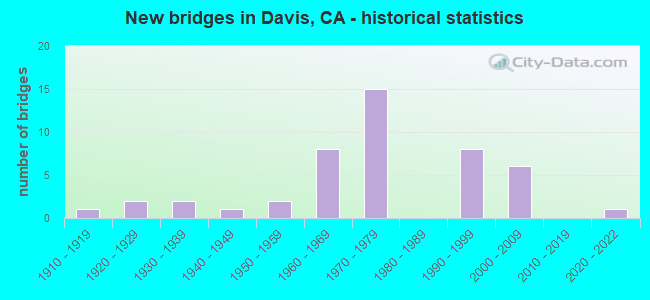
- New bridges - historical statistics
- 11910-1919
- 21920-1929
- 21930-1939
- 11940-1949
- 21950-1959
- 81960-1969
- 151970-1979
- 81990-1999
- 62000-2009
- 12020-2022
FCC Registered Antenna Towers: 75 (See the full list of FCC Registered Antenna Towers)
FCC Registered Private Land Mobile Towers: 1 (See the full list of FCC Registered Private Land Mobile Towers in Davis, CA)
FCC Registered Broadcast Land Mobile Towers: 49 (See the full list of FCC Registered Broadcast Land Mobile Towers)
FCC Registered Microwave Towers: 54 (See the full list of FCC Registered Microwave Towers in this town)
FCC Registered Paging Towers: 7 (See the full list of FCC Registered Paging Towers)
FCC Registered Maritime Coast & Aviation Ground Towers: 7 (See the full list of FCC Registered Maritime Coast & Aviation Ground Towers)
FCC Registered Amateur Radio Licenses: 449 (See the full list of FCC Registered Amateur Radio Licenses in Davis)
FAA Registered Aircraft Manufacturers and Dealers: 5 (See the full list of FAA Registered Manufacturers and Dealers in Davis)
FAA Registered Aircraft: 98 (See the full list of FAA Registered Aircraft)
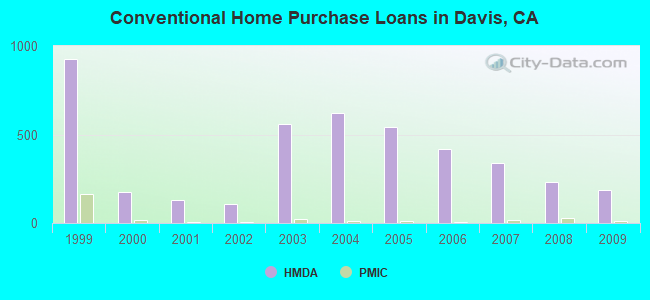
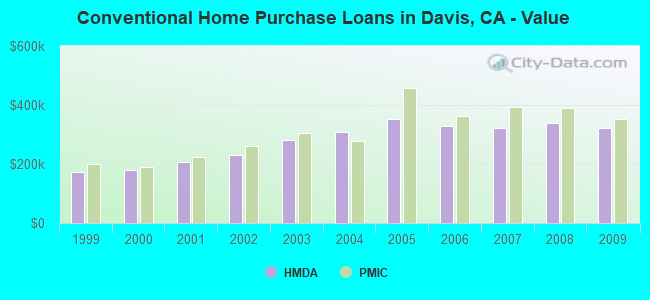
| Home Mortgage Disclosure Act Aggregated Statistics For Year 2009 (Based on 7 full and 5 partial tracts) | ||||||||||||||
| A) FHA, FSA/RHS & VA Home Purchase Loans | B) Conventional Home Purchase Loans | C) Refinancings | D) Home Improvement Loans | E) Loans on Dwellings For 5+ Families | F) Non-occupant Loans on < 5 Family Dwellings (A B C & D) | G) Loans On Manufactured Home Dwelling (A B C & D) | ||||||||
|---|---|---|---|---|---|---|---|---|---|---|---|---|---|---|
| Number | Average Value | Number | Average Value | Number | Average Value | Number | Average Value | Number | Average Value | Number | Average Value | Number | Average Value | |
| LOANS ORIGINATED | 33 | $393,103 | 184 | $322,041 | 1,262 | $293,177 | 61 | $253,809 | 3 | $1,093,333 | 141 | $265,562 | 1 | $64,000 |
| APPLICATIONS APPROVED, NOT ACCEPTED | 1 | $306,000 | 12 | $333,992 | 113 | $298,984 | 4 | $24,750 | 0 | $0 | 13 | $318,760 | 5 | $71,024 |
| APPLICATIONS DENIED | 2 | $424,245 | 20 | $286,232 | 205 | $337,866 | 12 | $105,804 | 0 | $0 | 39 | $284,904 | 3 | $40,317 |
| APPLICATIONS WITHDRAWN | 6 | $405,303 | 27 | $313,331 | 207 | $319,087 | 9 | $183,513 | 0 | $0 | 28 | $273,531 | 0 | $0 |
| FILES CLOSED FOR INCOMPLETENESS | 0 | $0 | 4 | $474,972 | 40 | $354,186 | 2 | $296,000 | 0 | $0 | 7 | $335,136 | 0 | $0 |
Detailed mortgage data for all 12 tracts in Davis, CA
| Private Mortgage Insurance Companies Aggregated Statistics For Year 2009 (Based on 7 full and 5 partial tracts) | ||||
| A) Conventional Home Purchase Loans | B) Refinancings | |||
|---|---|---|---|---|
| Number | Average Value | Number | Average Value | |
| LOANS ORIGINATED | 14 | $353,762 | 8 | $437,481 |
| APPLICATIONS APPROVED, NOT ACCEPTED | 3 | $476,210 | 2 | $401,000 |
| APPLICATIONS DENIED | 2 | $330,835 | 4 | $405,348 |
| APPLICATIONS WITHDRAWN | 0 | $0 | 1 | $475,000 |
| FILES CLOSED FOR INCOMPLETENESS | 0 | $0 | 0 | $0 |
2005 - 2018 National Fire Incident Reporting System (NFIRS) incidents
- Fire incident types reported to NFIRS in Davis, CA
- 1,15952.3%Outside Fires
- 73833.3%Structure Fires
- 28312.8%Mobile Property/Vehicle Fires
- 351.6%Other
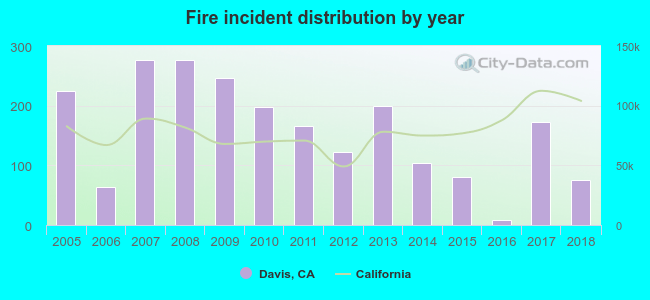 Based on the data from the years 2005 - 2018 the average number of fire incidents per year is 158. The highest number of reported fires - 276 took place in 2007, and the least - 9 in 2016. The data has a dropping trend.
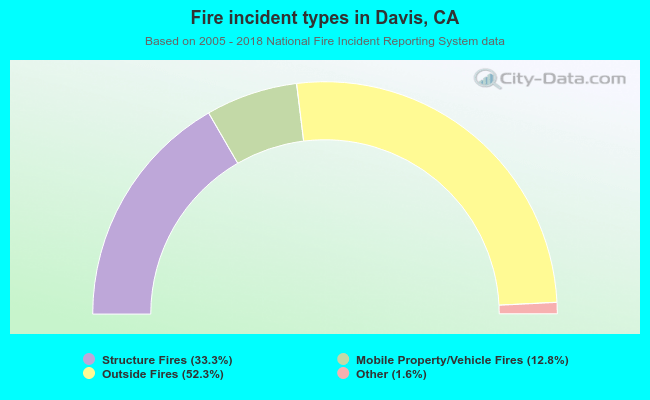 When looking into fire subcategories, the most reports belonged to: Outside Fires (52.3%), and Structure Fires (33.3%).
Fire-safe hotels and motels in Davis, California:
- Hilton Garden Inn Davis, 110 F St, Davis, California 95616 , Phone: (530) 753-3600
- Aggie Inn, An Ascend Collection Hotel, 245 First St, Davis, California 95616 , Phone: (530) 756-0352, Fax: (530) 753-5738
- Palm Court Hotel, 234 D St, Davis, California 95616 , Phone: (530) 753-7100, Fax: (530) 753-8761
- University Inn Bed & Breakfast, 340 A St, Davis, California 95616 , Phone: (530) 756-8648
- Days Inn, 4100 Chiles Rd, Davis, California 95616 , Phone: (530) 792-0800, Fax: (530) 753-0225
- Holiday Inn Express & Suites Davis - University Area, 1640 Research Park Dr, Davis, California 95616 , Phone: (530) 297-1500, Fax: (530) 297-1600
- Americas Best Value Inn & Suites, 1771 Research Park, Davis, California 95616 , Phone: (530) 758-2600, Fax: (530) 758-1771
- Hyatt Place, 173 Old Davis Rd Ext, Davis, California 95616 , Phone: (530) 756-9500, Fax: (530) 297-6900
- Best Western University Lodge, 123 B St, Davis, California 95616 , Phone: (530) 756-7890
| Most common first names in Davis, CA among deceased individuals | ||
| Name | Count | Lived (average) |
|---|---|---|
| John | 133 | 76.5 years |
| Mary | 123 | 82.2 years |
| Robert | 104 | 74.6 years |
| William | 100 | 76.1 years |
| James | 87 | 74.1 years |
| Charles | 69 | 75.4 years |
| Margaret | 64 | 82.5 years |
| George | 63 | 78.1 years |
| Dorothy | 62 | 82.6 years |
| Helen | 61 | 82.3 years |
| Most common last names in Davis, CA among deceased individuals | ||
| Last name | Count | Lived (average) |
|---|---|---|
| Smith | 54 | 82.1 years |
| Johnson | 35 | 74.3 years |
| Wright | 23 | 82.5 years |
| Williams | 23 | 80.4 years |
| Jones | 22 | 77.0 years |
| Moore | 22 | 75.9 years |
| Miller | 20 | 77.7 years |
| Nelson | 20 | 76.2 years |
| Brown | 19 | 74.4 years |
| Wilson | 19 | 79.0 years |
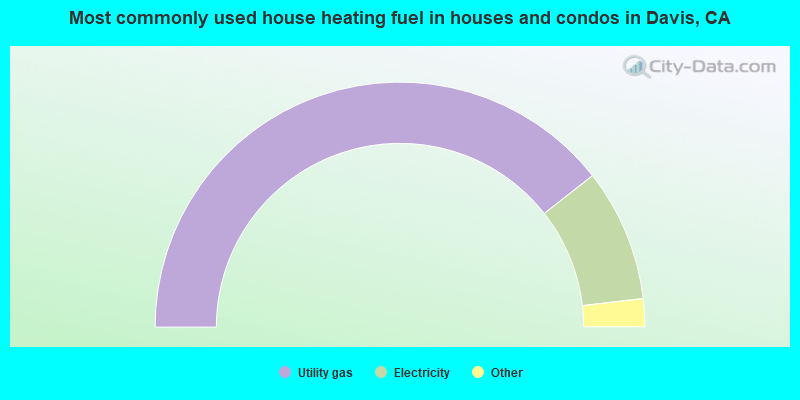
- 78.8%Utility gas
- 17.5%Electricity
- 2.0%Solar energy
- 1.2%Bottled, tank, or LP gas
- 0.4%Wood
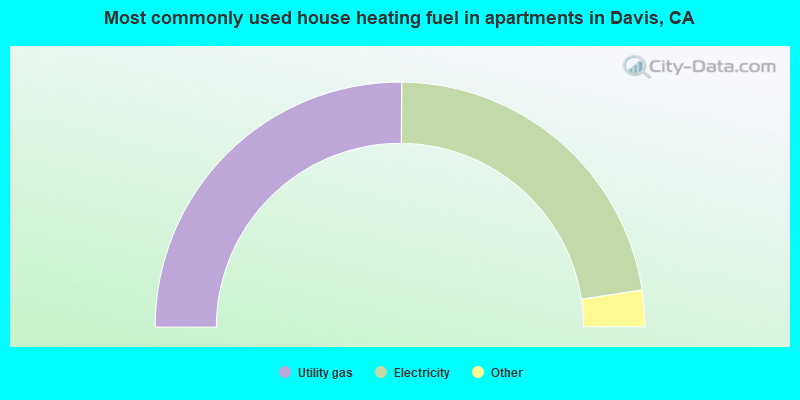
- 50.3%Utility gas
- 45.0%Electricity
- 2.8%Bottled, tank, or LP gas
- 0.9%Solar energy
- 0.9%No fuel used
Davis compared to California state average:
- Unemployed percentage significantly below state average.
- Black race population percentage below state average.
- Hispanic race population percentage below state average.
- Median age below state average.
- Length of stay since moving in below state average.
- Number of college students significantly above state average.
- Percentage of population with a bachelor's degree or higher significantly above state average.
Davis on our top lists:
- #1 on the list of "Top 101 cities with largest percentage of males in occupations: education, training, and library occupations (population 50,000+)"
- #1 on the list of "Top 101 cities with largest percentage of males in industries: educational services (population 50,000+)"
- #2 on the list of "Top 101 cities with largest percentage of males in occupations: life, physical, and social science occupations (population 50,000+)"
- #2 on the list of "Top 101 cities with the highest ratio of rapes to murders between 2002 and 2012 (population 50,000+)"
- #3 on the list of "Top 101 cities with the most people having Doctorate degrees (population 50,000+)"
- #4 on the list of "Top 101 cities with largest percentage of females in occupations: life, physical, and social science occupations (population 50,000+)"
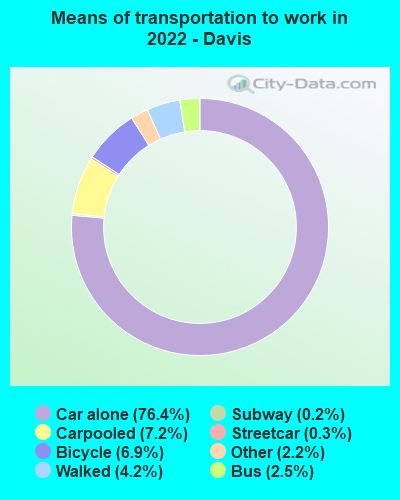
- #5 on the list of "Top 101 cities with the most people taking a bicycle to work (population 5,000+)"
- #6 on the list of "Top 101 cities with the highest maximum monthly sunshine amount (population 50,000+)"
- #10 on the list of "Top 101 cities with largest percentage of females in industries: educational services (population 50,000+)"
- #10 on the list of "Top 100 cities with highest percentage of college students (pop. 50,000+)"
- #11 on the list of "Top 101 cities with the most people having Master's or Doctorate degrees (population 50,000+)"
- #11 on the list of "Top 101 cities with the lowest number of murders per 100,000 residents (population 50,000+)"
- #13 on the list of "Top 101 cities with largest percentage of females in occupations: education, training, and library occupations (population 50,000+)"
- #13 on the list of "Top 100 best educated cities (highest percentage of bachelor degree holding residents) (pop. 50,000+)"
- #14 on the list of "Top 101 larger cities with the highest increase in house/condo value from 2000 (population 50,000+)"
- #19 on the list of "Top 100 cities with youngest residents (pop. 50,000+)"
- #23 on the list of "Top 101 cities with the lowest number of police officers per 1000 residents (population 50,000+)"
- #25 on the list of "Top 101 cities with the largest sunshine amount differences during a year (population 50,000+)"
- #28 on the list of "Top 101 cities with the most people having professional degrees (population 50,000+)"
- #30 on the list of "Top 100 cities with highest ratio of median house value to median household income (pop. 50,000+)"
- #38 on the list of "Top 101 counties with the highest Nitrogen Dioxide air pollution readings in 2012 (ppm)"
- #58 on the list of "Top 101 counties with highest percentage of residents voting for 3rd party candidates in the 2012 Presidential Election (pop. 50,000+)"
- #72 on the list of "Top 101 counties with the lowest Particulate Matter (PM2.5) Annual air pollution readings in 2012 (µg/m3)"
- #74 on the list of "Top 101 counties with the largest decrease in the number of deaths per 1000 residents 2000-2006 to 2007-2013 (pop. 50,000+)"
- #75 on the list of "Top 101 counties with the lowest number of deaths per 1000 residents 2007-2013 (pop. 50,000+)"

|
|
Total of 2164 patent applications in 2008-2024.