University Farms neighborhood in Davis, California (CA), 95616 detailed profile
Settings
X

Business Search - 14 Million verified businesses
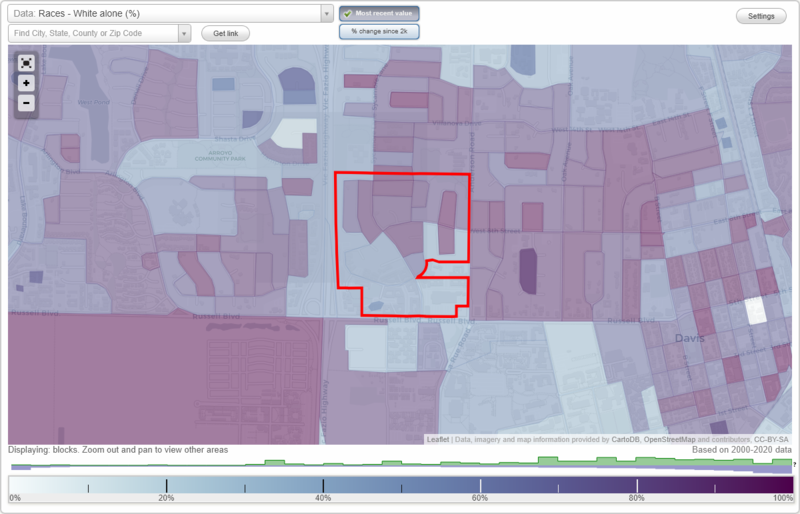
Area: 0.210 square miles
Population: 2,262
Population density:
| University Farms: | 10,779 people per square mile |
| Davis: | 6,415 people per square mile |

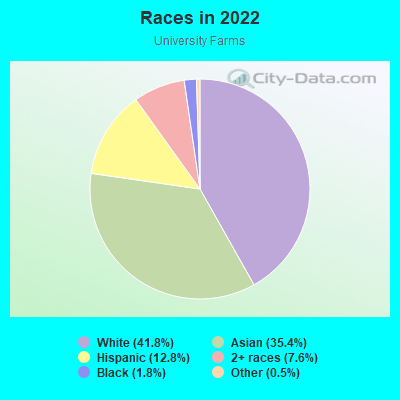
- 95341.8%White
- 80835.4%Asian
- 29312.8%Hispanic or Latino
- 1747.6%Two or more races
- 421.8%Black
- 120.5%Some other race
Median household income in 2022:
| University Farms: | $77,943 |
| Davis: | $67,373 |
Distribution of median household income
![Distribution of median household income]()
- 115Less than $10,000
- 147$10,000 to $19,999
- 64$20,000 to $29,999
- 81$30,000 to $39,999
- 62$40,000 to $49,999
- 69$50,000 to $59,999
- 41$60,000 to $74,999
- 86$75,000 to $99,999
- 43$100,000 to $124,999
- 39$125,000 to $149,999
- 50$150,000 to $199,999
- 81$200,000 or more

Distribution of owner-occupied house/condo value
![Distribution of owner-occupied house/condo value]()
- 19Less than $50,000
- 44$500,000 to $749,999
- 139$750,000 to $999,999
- 27$1,000,000 or more

Distribution of rent paid by renters
![Distribution of rent paid by renters]()
- 134$500 to $599
- 33$600 to $699
- 39$700 to $799
- 66$800 to $899
- 30$900 to $999
- 37$1,000 to $1,249
- 21$1,250 to $1,499
- 183$1,500 to $1,999
- 290$2,000 or more

Median rent in 2022:
| University Farms: | $1,824 |
| Davis: | $1,865 |
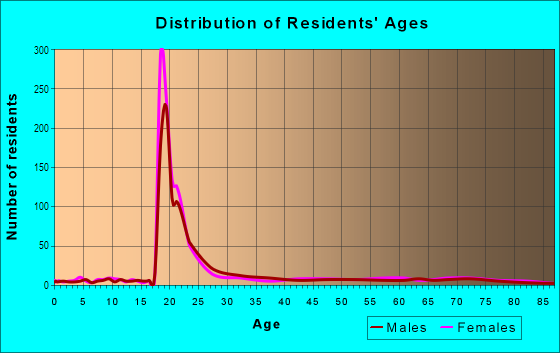
| Males: | 919 |
| Females: | 1,343 |
Males:
| This neighborhood: | 29.1 years |
| Whole city: | 24.9 years |
| This neighborhood: | 24.0 years |
| Whole city: | 26.5 years |
Average household size:
| University Farms: | 2.5 people |
| Davis: | 2.5 people |
Percentage of family households:
| University Farms: | 22.6% |
| Davis: | 31.5% |
| Here: | 21.7% |
| Davis: | 35.7% |
Percentage of married-couple families with children (among all households):
| University Farms: | 28.7% |
| Davis: | 28.9% |
Percentage of single-mother households (among all households):
| University Farms: | 4.5% |
| Davis: | 7.2% |
Percentage of never married males 15 years old and over:
Percentage of never married females 15 years old and over:
| University Farms: | 29.8% |
| Davis: | 25.7% |
Percentage of never married females 15 years old and over:
| University Farms: | 48.9% |
| city: | 29.9% |
Percentage of people that speak English not well or not at all:
| University Farms: | 1.3% |
| Davis: | 2.8% |
Percentage of people born in this state:
Percentage of people born in another U.S. state:
Percentage of native residents but born outside the U.S.:
Percentage of foreign born residents:
| Here: | 55.4% |
| Davis: | 59.5% |
Percentage of people born in another U.S. state:
| University Farms: | 21.0% |
| Davis: | 19.1% |
Percentage of native residents but born outside the U.S.:
| Here: | 2.7% |
| city: | 0.9% |
Percentage of foreign born residents:
| Here: | 20.9% |
| Davis: | 20.5% |
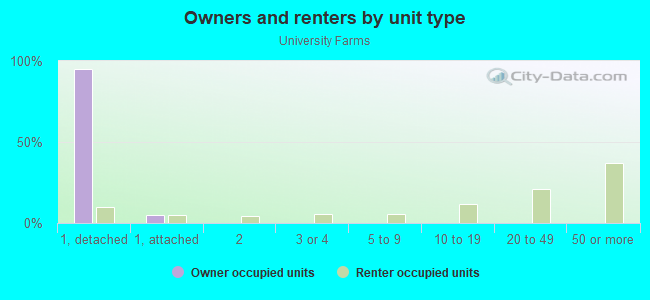
Owner-occupied
Renter-occupied

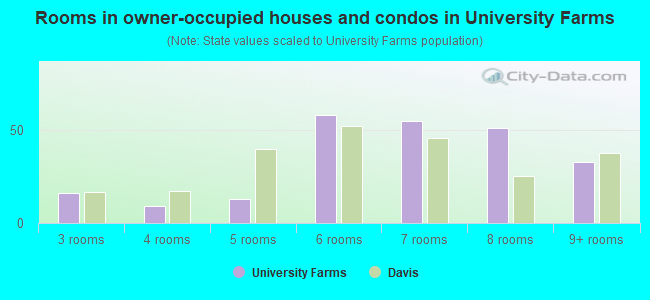
- Rooms in owner-occupied houses and condos in University Farms
- 01 room
- 02 rooms
- 163 rooms
- 94 rooms
- 135 rooms
- 586 rooms
- 557 rooms
- 518 rooms
- 339+ rooms
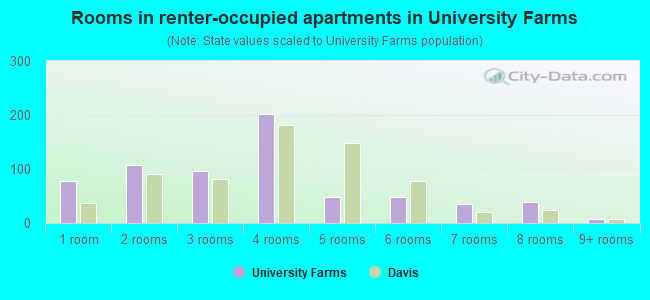
- Rooms in renter-occupied apartments in University Farms
- 781 room
- 1072 rooms
- 973 rooms
- 2024 rooms
- 495 rooms
- 496 rooms
- 367 rooms
- 388 rooms
- 89+ rooms
Owner-occupied
Renter-occupied
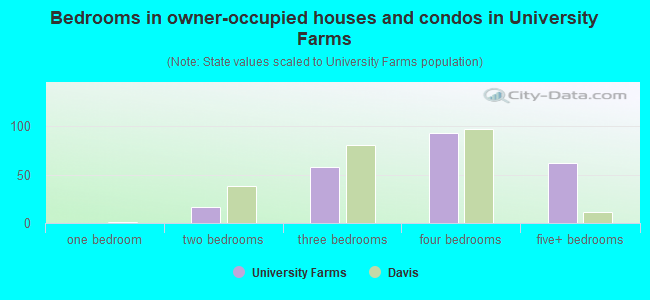
- Bedrooms in owner-occupied houses and condos in University Farms
- 0no bedroom
- 01 bedroom
- 162 bedrooms
- 583 bedrooms
- 934 bedrooms
- 625+ bedrooms
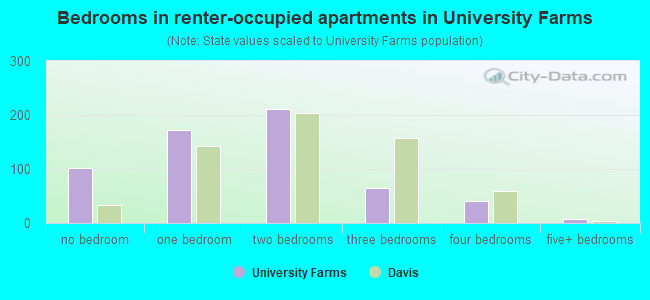
- Bedrooms in renter-occupied apartments in University Farms
- 101no bedroom
- 1721 bedroom
- 2122 bedrooms
- 653 bedrooms
- 414 bedrooms
- 85+ bedrooms
Average number of cars or other vehicles available in houses/condos:
Average number of cars or other vehicles available in apartments:
| This neighborhood: | 1.8 |
| Davis: | 2.0 |
Average number of cars or other vehicles available in apartments:
| Here: | 1.2 |
| city: | 1.7 |
Percentage of units with a mortgage:
| University Farms: | 56.0% |
| Davis: | 61.8% |
Average estimated value of detached houses in 2022 (35.4% of all units):
| University Farms: | $840,478 |
| Davis: | $1,006,726 |
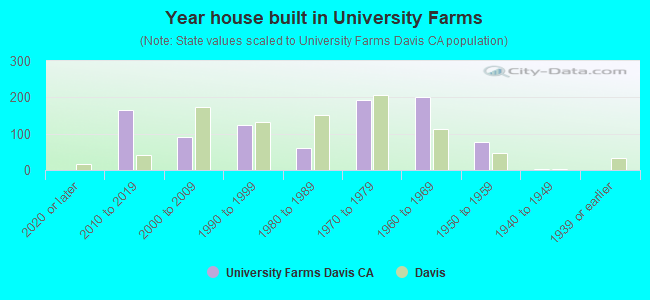
- Year house built in University Farms
- 02020 or later
- 1662010 to 2019
- 902000 to 2009
- 1241990 to 1999
- 611980 to 1989
- 1931970 to 1979
- 2021960 to 1969
- 771950 to 1959
- 21940 to 1949
- 01939 or earlier
City-data.com crime index for city in 2020 (higher means more crime):
| City: | 213.3 |
| U.S. average: | 219.5 |
Travel time to work (commute)
![Travel time to work (commute)]()
- 3Less than 5 minutes
- 1015 to 9 minutes
- 23210 to 14 minutes
- 14115 to 19 minutes
- 4320 to 24 minutes
- 1225 to 29 minutes
- 10130 to 34 minutes
- 535 to 39 minutes
- 2040 to 44 minutes
- 1445 to 59 minutes
- 1860 to 89 minutes
- 2290 or more minutes

Means of transportation to work
![Means of transportation to work]()
- 39.1%292Drove a car alone
- 8.3%62Carpooled
- 5.1%38Bus
- 2.5%19Subway or elevated rail
- 3.2%24Motorcycle
- 23.6%176Bicycle
- 54.6%408Walked
- 9.6%72Worked at home

Time leaving home to go to work
![Time leaving home to go to work]()
- 2812:00 a.m. to 4:59 a.m.
- 125:30 a.m. to 5:59 a.m.
- 226:00 a.m. to 6:29 a.m.
- 336:30 a.m. to 6:59 a.m.
- 467:00 a.m. to 7:29 a.m.
- 847:30 a.m. to 7:59 a.m.
- 988:00 a.m. to 8:29 a.m.
- 1058:30 a.m. to 8:59 a.m.
- 689:00 a.m. to 9:59 a.m.
- 5510:00 a.m. to 10:59 a.m.
- 3611:00 a.m. to 11:59 a.m.
- 8612:00 p.m. to 3:59 p.m.
- 284:00 p.m. to 11:59 p.m.

Occupations of males:
- Percentage of males in management occupations (except farmers):
Here: 8.8% city: 9.8%
- Percentage of males in business and financial operations occupations:
Here: 3.9% city: 5.9%
- Percentage of males in computer and mathematical occupations:
Here: 6.0% city: 5.6%
- Percentage of males in architecture and engineering occupations:
Here: 11.7% city: 5.7%
- Percentage of males in life, physical, and social science occupations:
Here: 3.6% city: 7.8%
- Percentage of males in legal occupations:
Here: 3.9% city: 2.7%
- Percentage of males in education, training, and library occupations:
Here: 23.1% city: 18.9%
- Percentage of males in arts, design, entertainment, sports, and media occupations:
Here: 4.5% city: 2.1%
- Percentage of males in healthcare practitioners and technical occupations:
Here: 3.0% city: 4.7%
- Percentage of males in service occupations:
Here: 10.6% city: 11.9%
- Percentage of males in sales and office occupations:
Here: 15.5% city: 10.8%
- Percentage of males in construction, extraction, and maintenance occupations:
Here: 1.8% city: 2.3%
- Percentage of males in production occupations:
Here: 1.7% city: 2.8%
- Percentage of males in transportation occupations:
Here: 2.0% city: 4.5%
Occupations of females:
- Percentage of females in management occupations (except farmers):
Here: 6.5% city: 7.9%
- Percentage of females in business and financial operations occupations:
Here: 5.2% city: 5.0%
- Percentage of females in architecture and engineering occupations:
Here: 1.8% city: 1.1%
- Percentage of females in life, physical, and social science occupations:
Here: 5.0% city: 8.9%
- Percentage of females in community and social services occupations:
Here: 1.8% city: 2.7%
- Percentage of females in education, training, and library occupations:
Here: 31.7% city: 19.0%
- Percentage of females in arts, design, entertainment, sports, and media occupations:
Here: 3.7% city: 2.9%
- Percentage of females in healthcare practitioners and technical occupations:
Here: 3.1% city: 9.1%
- Percentage of females in service occupations:
Here: 14.3% city: 18.1%
- Percentage of females in sales and office occupations:
Here: 17.8% city: 16.0%
- Percentage of females in production occupations:
Here: 3.0% city: 1.7%
- Percentage of females in transportation occupations:
Here: 4.0% city: 1.2%
Percentage of people 16-64 in Armed Forces:
| University Farms: | 0.2% |
| Davis: | 0.2% |
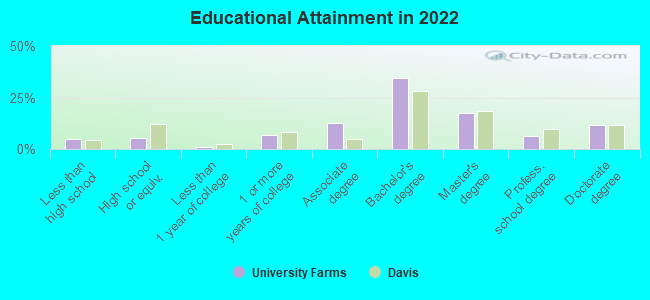
Education in this neighborhood (subdivision or community):
- Percentage of people 3 years and older in K-12 schools:
University Farms: 9.6% Davis: 10.0%
- Percentage of people 3 years and older in undergraduate colleges:
University Farms: 57.9% Davis: 24.3%
- Percentage of people 3 years and older in grad. or professional schools:
University Farms: 7.5% Davis: 8.2%
- Percentage of students K-12 enrolled in private schools:
University Farms: 3.2% Davis: 11.2%
Percentage of population below poverty level:
| University Farms: | 47.4% |
| Davis: | 27.0% |
Median year owner moved in (as recorded in 2022):
Median year renter moved in (as recorded in 2022):
| University Farms: | 2001 |
| Davis: | 2009 |
Median year renter moved in (as recorded in 2022):
| University Farms: | 2019 |
| Davis: | 2022 |
Percentage of married-couple families with both working:
| University Farms: | 107.0% |
| Davis: | 71.8% |
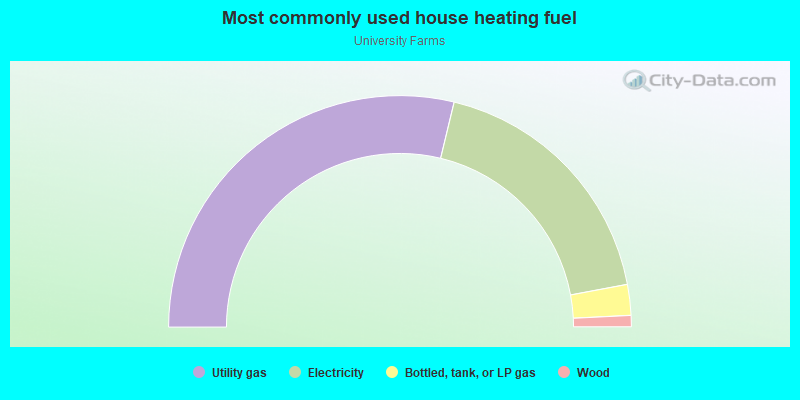
- 57.6%Utility gas
- 36.6%Electricity
- 4.3%Bottled, tank, or LP gas
- 1.6%Wood
Roads and streets:
W 8th St
Length: 0.51 miles
Directions: E-W, SW-NE
Address range: 800 to 1599
Directions: E-W, SW-NE
Address range: 800 to 1599
Sycamore Ln
Length: 0.41 miles
Directions: N-S, SE-NW
Address range: 700 to 1099
Directions: N-S, SE-NW
Address range: 700 to 1099
Wake Forest Dr
Length: 0.38 miles
Directions: E-W, N-S, SE-NW, SW-NE
Address range: 1301 to 1462
Directions: E-W, N-S, SE-NW, SW-NE
Address range: 1301 to 1462
Cornell Dr
Length: 0.38 miles
Directions: E-W, N-S, SE-NW
Address range: 1000 to 1431
Directions: E-W, N-S, SE-NW
Address range: 1000 to 1431
Linden Ln
Length: 0.30 miles
Directions: E-W, N-S, SE-NW, SW-NE
Address range: 800 to 899
Directions: E-W, N-S, SE-NW, SW-NE
Address range: 800 to 899
Plum Ln
Length: 0.29 miles
Directions: N-S, SE-NW
Address range: 700 to 1036
Directions: N-S, SE-NW
Address range: 700 to 1036
Mulberry Ln
Length: 0.26 miles
Directions: E-W, N-S, SE-NW, SW-NE
Address range: 700 to 799
Directions: E-W, N-S, SE-NW, SW-NE
Address range: 700 to 799
Acacia Ln
Length: 0.26 miles
Directions: E-W, N-S, SE-NW, SW-NE
Address range: 800 to 1043
Directions: E-W, N-S, SE-NW, SW-NE
Address range: 800 to 1043
Oxford Cir
Length: 0.22 miles
Directions: E-W, N-S, SE-NW, SW-NE
Address range: 509 to 565
Directions: E-W, N-S, SE-NW, SW-NE
Address range: 509 to 565
Hawthorne Ln
Length: 0.22 miles
Directions: N-S, SW-NE
Address range: 600 to 776
Directions: N-S, SW-NE
Address range: 600 to 776
Stanford Dr (Stanford Pl)
Length: 0.19 miles
Directions: E-W, SW-NE
Address range: 1000 to 1299
Directions: E-W, SW-NE
Address range: 1000 to 1299
Harvard Dr
Length: 0.18 miles
Direction: E-W
Address range: 1100 to 1299
Direction: E-W
Address range: 1100 to 1299
Maple Ln
Length: 0.14 miles
Directions: E-W, N-S, SW-NE
Address range: 1010 to 1199
Directions: E-W, N-S, SW-NE
Address range: 1010 to 1199
Pine Ln
Length: 0.14 miles
Direction: N-S
Address range: 800 to 1099
Direction: N-S
Address range: 800 to 1099
Cherry Ln
Length: 0.07 miles
Directions: E-W, N-S, SE-NW
Address range: 800 to 831
Directions: E-W, N-S, SE-NW
Address range: 800 to 831
Vassar Dr
Length: 0.06 miles
Direction: E-W
Address range: 1000 to 1025
Direction: E-W
Address range: 1000 to 1025
Peach Pl
Length: 0.04 miles
Directions: N-S, SE-NW
Address range: 700 to 799
Directions: N-S, SE-NW
Address range: 700 to 799