North Elizabeth St neighborhood in Lexington, Kentucky (KY), 40503, 40508 detailed profile
Settings
X

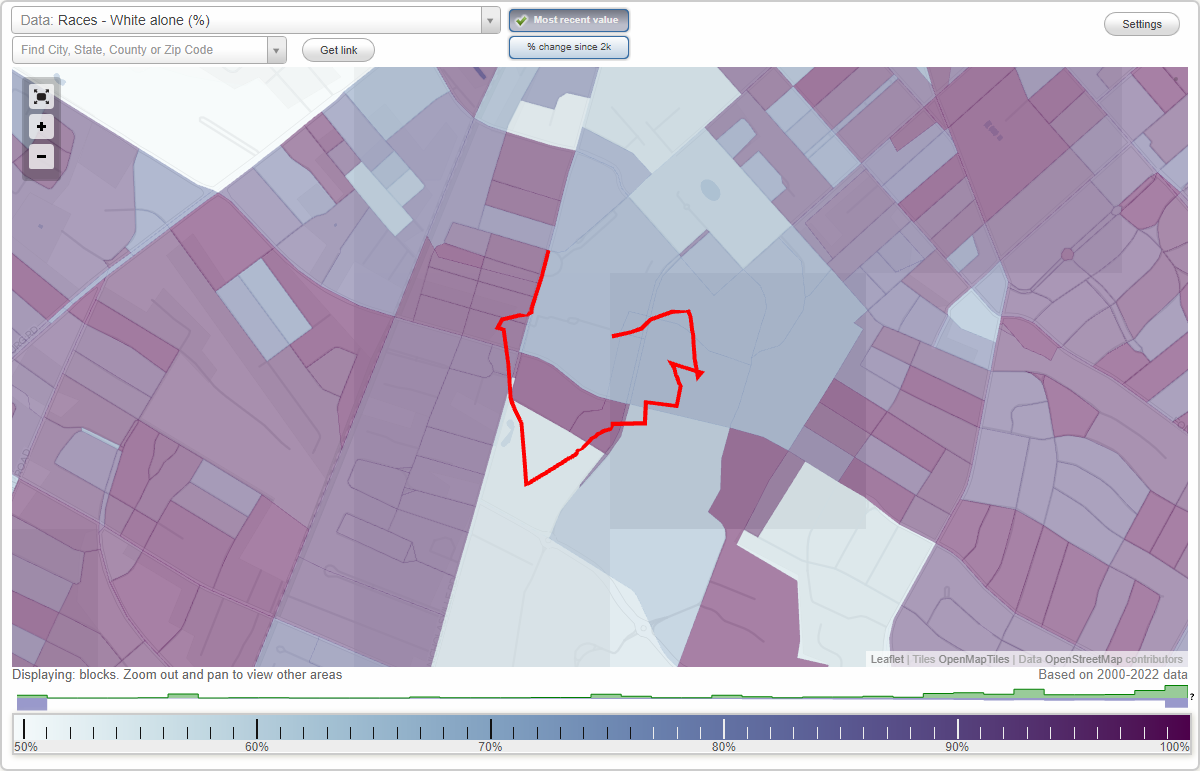
Area: 0.130 square miles
Population: 1,444
Population density: 11,123 people per square mile

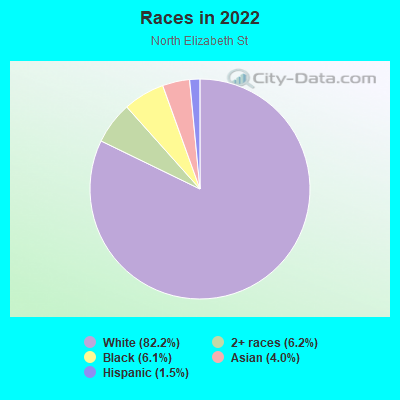
- 1,18682.2%White
- 896.2%Two or more races
- 886.1%Black
- 584.0%Asian
- 221.5%Hispanic or Latino
Median household income in 2022:
| North Elizabeth St: | $21,118 |
| Kentucky: | $59,341 |
Distribution of median household income
![Distribution of median household income]()
- 237Less than $10,000
- 160$10,000 to $19,999
- 199$20,000 to $29,999
- 105$30,000 to $39,999
- 44$40,000 to $49,999
- 59$50,000 to $59,999
- 59$60,000 to $74,999
- 15$75,000 to $99,999
- 8$100,000 to $124,999
- 28$125,000 to $149,999

Distribution of owner-occupied house/condo value
![Distribution of owner-occupied house/condo value]()
- 16$50,000 to $99,999
- 21$100,000 to $149,999
- 11$150,000 to $199,999

Distribution of rent paid by renters
![Distribution of rent paid by renters]()
- 8$100 to $199
- 20$300 to $399
- 35$400 to $499
- 88$500 to $599
- 109$600 to $699
- 115$700 to $799
- 116$800 to $899
- 83$900 to $999
- 44$1,000 to $1,249
- 144$1,250 to $1,499
- 36$1,500 to $1,999
- 21$2,000 or more

Median rent in 2022:
| North Elizabeth St: | $830 |
| Kentucky: | $702 |
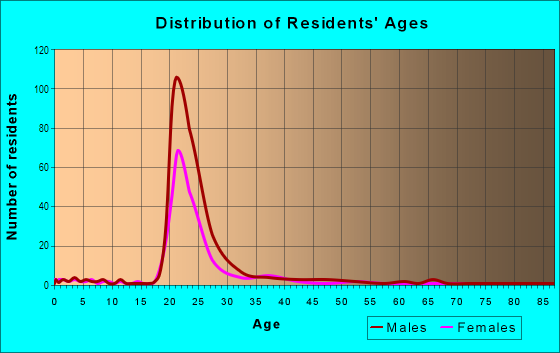
| Males: | 754 |
| Females: | 690 |
| Males: | 24.2 years |
| Females: | 23.8 years |
Average household size:
| North Elizabeth St: | 1.6 people |
| Kentucky: | 2.4 people |
Percentage of family households:
| North Elizabeth St: | 17.1% |
| Kentucky: | 45.9% |
| Here: | 8.8% |
| Kentucky: | 47.1% |
Percentage of never married males 15 years old and over:
Percentage of never married females 15 years old and over:
| North Elizabeth St: | 40.6% |
| Kentucky: | 16.3% |
Percentage of never married females 15 years old and over:
| North Elizabeth St: | 35.2% |
| Kentucky: | 13.5% |
Percentage of people that speak English not well or not at all:
| North Elizabeth St: | 0.4% |
| Kentucky: | 1.1% |
Percentage of people born in this state:
Percentage of people born in another U.S. state:
Percentage of native residents but born outside the U.S.:
Percentage of foreign born residents:
| Here: | 60.5% |
| Kentucky: | 67.2% |
Percentage of people born in another U.S. state:
| North Elizabeth St: | 34.9% |
| Kentucky: | 28.0% |
Percentage of native residents but born outside the U.S.:
| Here: | 0.4% |
| Kentucky: | 0.8% |
Percentage of foreign born residents:
| Here: | 4.3% |
| Kentucky: | 4.0% |
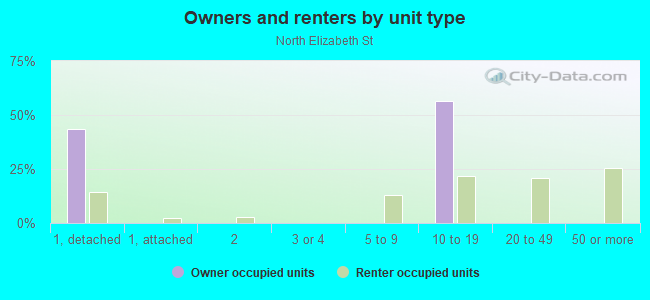
Owner-occupied
Renter-occupied

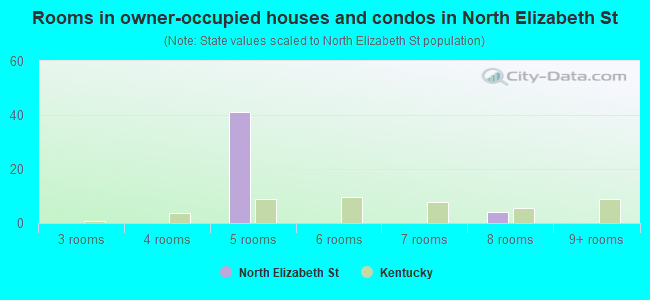
- Rooms in owner-occupied houses and condos in North Elizabeth St
- 01 room
- 02 rooms
- 03 rooms
- 04 rooms
- 415 rooms
- 06 rooms
- 07 rooms
- 48 rooms
- 09+ rooms
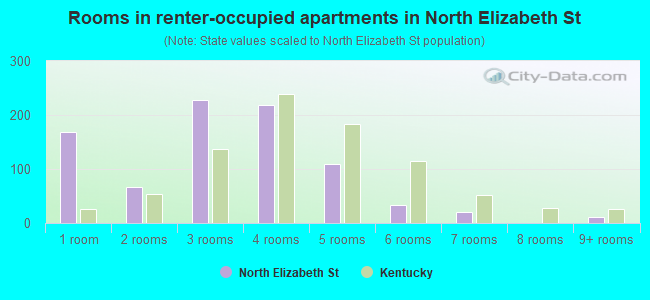
- Rooms in renter-occupied apartments in North Elizabeth St
- 1691 room
- 672 rooms
- 2283 rooms
- 2184 rooms
- 1105 rooms
- 336 rooms
- 217 rooms
- 08 rooms
- 119+ rooms
Owner-occupied
Renter-occupied
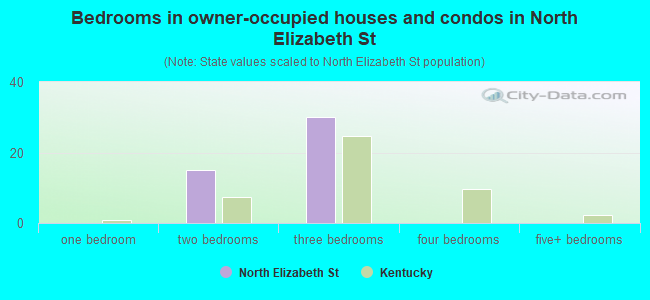
- Bedrooms in owner-occupied houses and condos in North Elizabeth St
- 0no bedroom
- 01 bedroom
- 152 bedrooms
- 303 bedrooms
- 04 bedrooms
- 05+ bedrooms
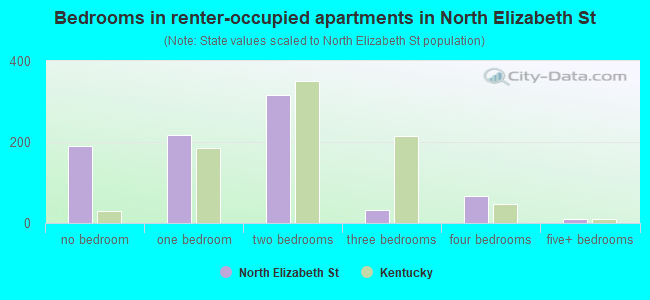
- Bedrooms in renter-occupied apartments in North Elizabeth St
- 191no bedroom
- 2181 bedroom
- 3172 bedrooms
- 333 bedrooms
- 664 bedrooms
- 115+ bedrooms
Average number of cars or other vehicles available in houses/condos:
Average number of cars or other vehicles available in apartments:
| This neighborhood: | 1.9 |
| Kentucky: | 2.1 |
Average number of cars or other vehicles available in apartments:
| Here: | 1.2 |
| Kentucky: | 1.3 |
Percentage of units with a mortgage:
| North Elizabeth St: | 97.9% |
| Kentucky: | 56.7% |
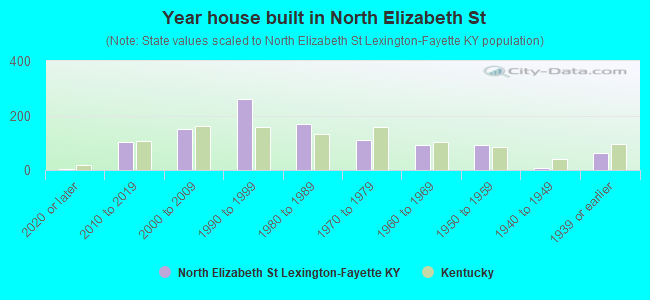
- Year house built in North Elizabeth St
- 52020 or later
- 1042010 to 2019
- 1492000 to 2009
- 2621990 to 1999
- 1681980 to 1989
- 1111970 to 1979
- 921960 to 1969
- 911950 to 1959
- 91940 to 1949
- 641939 or earlier
Travel time to work (commute)
![Travel time to work (commute)]()
- 11Less than 5 minutes
- 1395 to 9 minutes
- 17210 to 14 minutes
- 17615 to 19 minutes
- 6320 to 24 minutes
- 2625 to 29 minutes
- 7730 to 34 minutes
- 3240 to 44 minutes
- 2245 to 59 minutes
- 1960 to 89 minutes

Means of transportation to work
![Means of transportation to work]()
- 71.9%510Drove a car alone
- 2.5%18Carpooled
- 7.1%50Bus
- 2.4%17Taxi
- 4.2%30Bicycle
- 10.4%74Walked
- 0.8%6Worked at home

Time leaving home to go to work
![Time leaving home to go to work]()
- 285:00 a.m. to 5:29 a.m.
- 55:30 a.m. to 5:59 a.m.
- 176:00 a.m. to 6:29 a.m.
- 366:30 a.m. to 6:59 a.m.
- 1187:00 a.m. to 7:29 a.m.
- 557:30 a.m. to 7:59 a.m.
- 828:00 a.m. to 8:29 a.m.
- 718:30 a.m. to 8:59 a.m.
- 629:00 a.m. to 9:59 a.m.
- 1810:00 a.m. to 10:59 a.m.
- 2311:00 a.m. to 11:59 a.m.
- 8112:00 p.m. to 3:59 p.m.
- 1404:00 p.m. to 11:59 p.m.

Occupations of males:
- Percentage of males in management occupations (except farmers):
Here: 2.4% Kentucky: 10.7%
- Percentage of males in architecture and engineering occupations:
Here: 3.1% Kentucky: 2.7%
- Percentage of males in life, physical, and social science occupations:
Here: 8.6% Kentucky: 0.8%
- Percentage of males in education, training, and library occupations:
Here: 16.7% Kentucky: 2.9%
- Percentage of males in healthcare practitioners and technical occupations:
Here: 4.2% Kentucky: 3.1%
- Percentage of males in service occupations:
Here: 7.5% Kentucky: 12.5%
- Percentage of males in sales and office occupations:
Here: 23.2% Kentucky: 14.0%
- Percentage of males in construction, extraction, and maintenance occupations:
Here: 4.4% Kentucky: 8.7%
- Percentage of males in production occupations:
Here: 4.4% Kentucky: 12.3%
- Percentage of males in transportation occupations:
Here: 6.6% Kentucky: 6.7%
- Percentage of males in material moving occupations:
Here: 15.8% Kentucky: 7.7%
Occupations of females:
- Percentage of females in management occupations (except farmers):
Here: 4.8% Kentucky: 8.4%
- Percentage of females in business and financial operations occupations:
Here: 2.1% Kentucky: 5.3%
- Percentage of females in architecture and engineering occupations:
Here: 2.4% Kentucky: 0.6%
- Percentage of females in legal occupations:
Here: 1.8% Kentucky: 1.1%
- Percentage of females in education, training, and library occupations:
Here: 11.0% Kentucky: 9.3%
- Percentage of females in arts, design, entertainment, sports, and media occupations:
Here: 7.7% Kentucky: 1.5%
- Percentage of females in healthcare practitioners and technical occupations:
Here: 30.1% Kentucky: 11.8%
- Percentage of females in service occupations:
Here: 22.0% Kentucky: 19.1%
- Percentage of females in sales and office occupations:
Here: 8.0% Kentucky: 27.8%
- Percentage of females in production occupations:
Here: 2.4% Kentucky: 5.2%
- Percentage of females in material moving occupations:
Here: 11.9% Kentucky: 3.2%
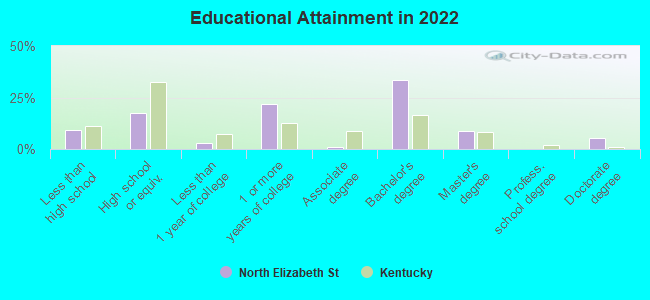
Education in this neighborhood (subdivision or community):
- Percentage of people 3 years and older in K-12 schools:
North Elizabeth St: 0.5% Kentucky: 16.5%
- Percentage of people 3 years and older in undergraduate colleges:
North Elizabeth St: 32.3% Kentucky: 4.1%
- Percentage of people 3 years and older in grad. or professional schools:
North Elizabeth St: 22.4% Kentucky: 1.3%
- Percentage of students K-12 enrolled in private schools:
North Elizabeth St: 100.0% Kentucky: 16.3%
Percentage of population below poverty level:
| North Elizabeth St: | 65.8% |
| Kentucky: | 16.5% |
Median year owner moved in (as recorded in 2022):
| North Elizabeth St: | 2019 |
| Kentucky: | 2010 |
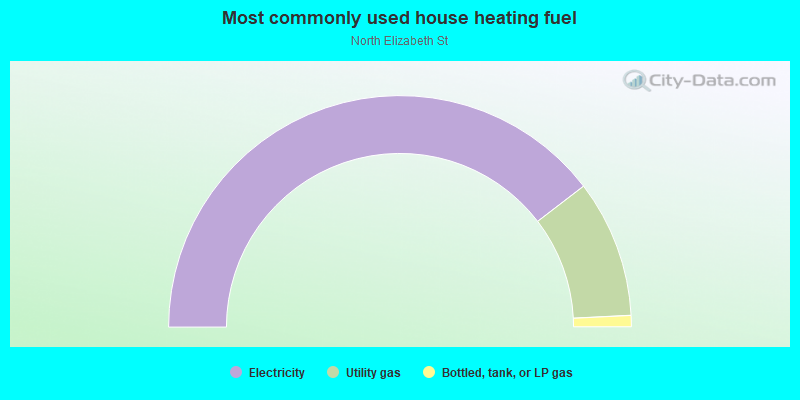
- 79.1%Electricity
- 19.2%Utility gas
- 1.6%Bottled, tank, or LP gas
Highways in this neighborhood:
US Hwy 27 (Nicholasville Rd)
Length: 0.25 miles
Direction: N-S
Direction: N-S
S Limestone St (US Hwy 27)
Length: 0.18 miles
Direction: N-S
Address range: 800 to 1031
Direction: N-S
Address range: 800 to 1031
Roads and streets:
State St
Length: 0.33 miles
Direction: E-W
Address range: 100 to 299
Direction: E-W
Address range: 100 to 299
Waller Ave
Length: 0.32 miles
Direction: E-W
Address range: 100 to 231
Direction: E-W
Address range: 100 to 231
University Ave
Length: 0.32 miles
Direction: E-W
Address range: 100 to 299
Direction: E-W
Address range: 100 to 299
Conn Ter
Length: 0.30 miles
Directions: E-W, SE-NW
Address range: 100 to 299
Directions: E-W, SE-NW
Address range: 100 to 299
Transcript Ave
Length: 0.29 miles
Direction: E-W
Address range: 100 to 299
Direction: E-W
Address range: 100 to 299
Elizabeth St
Length: 0.25 miles
Direction: N-S
Address range: 900 to 1299
Direction: N-S
Address range: 900 to 1299
Gazette Ave
Length: 0.21 miles
Direction: E-W
Address range: 100 to 199
Direction: E-W
Address range: 100 to 199
Leader Ave
Length: 0.21 miles
Direction: E-W
Address range: 100 to 199
Direction: E-W
Address range: 100 to 199
Crescent Ave
Length: 0.17 miles
Direction: N-S
Address range: 1000 to 1299
Direction: N-S
Address range: 1000 to 1299
Press Ave
Length: 0.12 miles
Direction: N-S
Address range: 802 to 899
Direction: N-S
Address range: 802 to 899
Journal Ave
Length: 0.06 miles
Directions: E-W, N-S, SE-NW, SW-NE
Address range: 900 to 999
Directions: E-W, N-S, SE-NW, SW-NE
Address range: 900 to 999