Estimated zip code population in 2022: 25,571 Zip code population in 2010: 23,569 Zip code population in 2000: 27,220
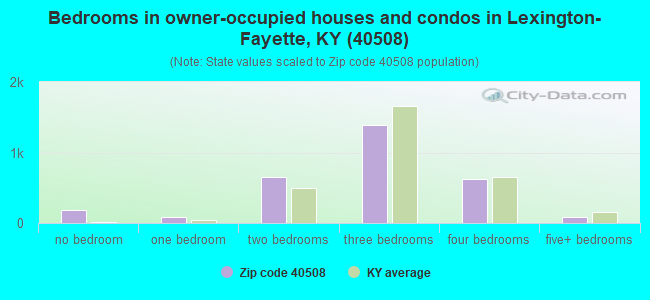
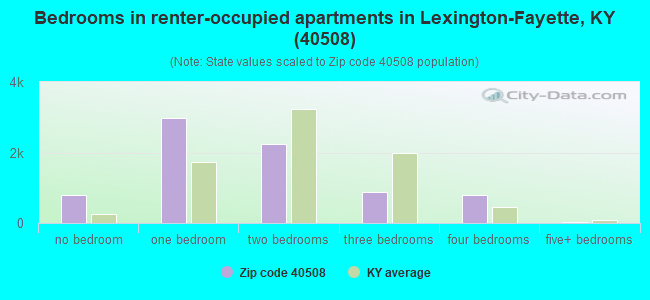
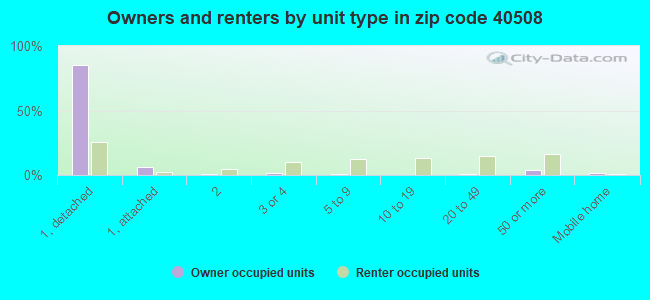
Houses and condos: 12,076 Renter-occupied apartments: 7,630
% of renters here:
72%
State:
31%
March 2022 cost of living index in zip code 40508: 90.9 (less than average, U.S. average is 100)
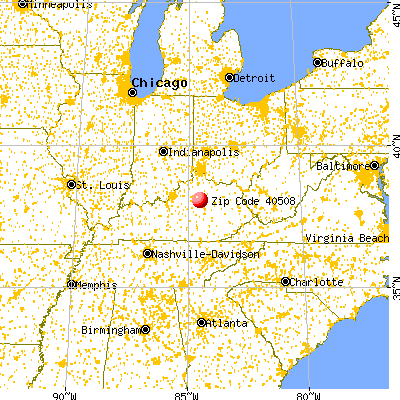
Land area: 4.3 sq. mi. Water area: 0.0 sq. mi.
Population density: 6,000 people per square mile
(average).
OSM Map
General Map
Google Map
MSN Map
OSM Map
General Map
Google Map
MSN Map
OSM Map
General Map
Google Map
MSN Map
OSM Map
General Map
Google Map
MSN Map
Please wait while loading the map...
Real estate property taxes paid for housing units in 2022:
This zip code:
0.9% ($1,475)
Kentucky:
0.7% ($1,456)
Median real estate property taxes paid for housing units with mortgages in 2022: $1,547 (0.9%) Median real estate property taxes paid for housing units with no mortgage in 2022: $1,069 (0.9%)
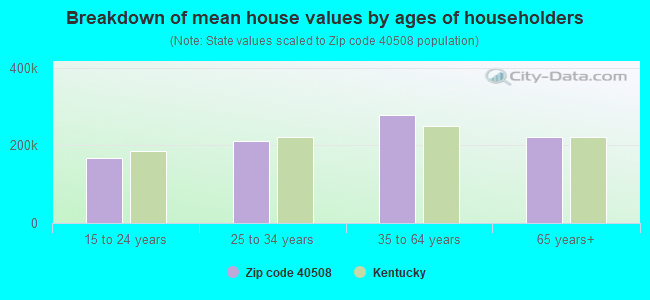
Estimated median house/condo value in 2022: $165,025
40508:
$165,025
Kentucky:
$196,300
According to our research of Kentucky and other state lists, there were 75 registered sex offenders living in 40508 zip code as of April 27, 2024. The ratio of all residents to sex offenders in zip code 40508 is 365 to 1. The ratio of registered sex offenders to all residents in this zip code is near the state average.
Median resident age:
This zip code:
23.7 years
Kentucky median age:
39.4 years
Average household size:
This zip code:
1.9 people
Kentucky:
2.4 people
Averages for the 2020 tax year for zip code 40508, filed in 2021:
Average Adjusted Gross Income (AGI) in 2020: $40,484 (Individual Income Tax Returns)
Here:
$40,484
State:
$61,342
Salary/wage: $33,145 (reported on 88.7% of returns)
Here:
$33,145
State:
$50,827
(% of AGI for various income ranges: 1186.3% for AGIs below $25k, 3840.2% for AGIs $25k-50k, 7530.0% for AGIs $50k-75k, 10795.3% for AGIs $75k-100k, 18333.7% for AGIs $100k-200k, 78258.0% for AGIs over 200k)
Taxable interest for individuals: $1,005 (reported on 14.0% of returns)
This zip code:
$1,005
Kentucky:
$1,441
(% of AGI for various income ranges: 3.1% for AGIs below $25k, 3.8% for AGIs $25k-50k, 20.8% for AGIs $50k-75k, 26.0% for AGIs $75k-100k, 167.9% for AGIs $100k-200k, 876.0% for AGIs over 200k)
Ordinary dividends: $6,366 (reported on 9.7% of returns)
Here:
$6,366
State:
$7,388
(% of AGI for various income ranges: 8.6% for AGIs below $25k, 11.3% for AGIs $25k-50k, 68.0% for AGIs $50k-75k, 286.7% for AGIs $75k-100k, 512.1% for AGIs $100k-200k, 4798.0% for AGIs over 200k)
Net capital gain/loss in AGI: +$16,438 (reported on 9.7% of returns)
Here:
+$16,438
State:
+$19,475
(% of AGI for various income ranges: 5.6% for AGIs below $25k, 18.3% for AGIs $25k-50k, 176.0% for AGIs $50k-75k, 422.0% for AGIs $75k-100k, 1367.4% for AGIs $100k-200k, 14560.0% for AGIs over 200k)
Profit/loss from business: +$11,937 (reported on 15.0% of returns)
Here:
+$11,937
State:
+$11,386
(% of AGI for various income ranges: 75.0% for AGIs below $25k, 129.7% for AGIs $25k-50k, 340.2% for AGIs $50k-75k, 844.0% for AGIs $75k-100k, 1035.8% for AGIs $100k-200k, 8366.0% for AGIs over 200k)
Taxable individual retirement arrangement distribution: $22,753 (reported on 2.6% of returns)
40508:
$22,753
Kentucky:
$18,941
(% of AGI for various income ranges: 6.9% for AGIs below $25k, 18.1% for AGIs $25k-50k, 115.5% for AGIs $50k-75k, 410.0% for AGIs $75k-100k, 631.6% for AGIs $100k-200k, 3104.0% for AGIs over 200k)
Self-employed (Keogh) retirement plans: $28,367 (reported on 0.4% of returns)
40508:
$28,367
Kentucky:
$23,933
(% of AGI for various income ranges: 447.9% for AGIs $100k-200k)
Total itemized deductions: $27,823 (reported on 4.8% of returns)
Here:
$27,823
State:
$32,473
(% of AGI for various income ranges: 11.9% for AGIs below $25k, 50.7% for AGIs $25k-50k, 220.8% for AGIs $50k-75k, 702.0% for AGIs $75k-100k, 1436.3% for AGIs $100k-200k, 7854.0% for AGIs over 200k)
Charity contributions: $11,000 (reported on 3.5% of returns)
Here:
$11,000
State:
$13,472
(% of AGI for various income ranges: 10.1% for AGIs $25k-50k, 17.2% for AGIs $50k-75k, 90.0% for AGIs $75k-100k, 406.8% for AGIs $100k-200k, 3462.0% for AGIs over 200k)
Taxes paid: $8,200 (reported on 4.6% of returns)
40508:
$8,200
State:
$7,830
(% of AGI for various income ranges: 3.0% for AGIs below $25k, 11.5% for AGIs $25k-50k, 81.5% for AGIs $50k-75k, 257.3% for AGIs $75k-100k, 496.3% for AGIs $100k-200k, 1726.0% for AGIs over 200k)
Earned income credit: $2,123 (reported on 26.7% of returns)
Here:
$2,123
State:
$2,336
(% of AGI for various income ranges: 99.4% for AGIs below $25k, 65.7% for AGIs $25k-50k)
Percentage of individuals using paid preparers for their 2020 taxes: 92.0%
Here:
92%
State:
94%
(% for various income ranges: 92.2% for AGIs below $25k, 91.8% for AGIs $25k-50k, 88.7% for AGIs $50k-75k, 88.0% for AGIs $75k-100k, 97.1% for AGIs $100k-200k, 94.4% for AGIs over 200k)
Averages for the 2012 tax year for zip code 40508, filed in 2013:
Average Adjusted Gross Income (AGI) in 2012: $33,114 (Individual Income Tax Returns)
Here:
$33,114
State:
$50,814
Salary/wage: $28,102 (reported on 90.9% of returns)
Here:
$28,102
State:
$42,723
(% of AGI for various income ranges: 87.3% for AGIs below $25k, 88.5% for AGIs $25k-50k, 78.0% for AGIs $50k-75k, 73.0% for AGIs $75k-100k, 73.3% for AGIs $100k-200k, 59.6% for AGIs over 200k)
Taxable interest for individuals: $1,300 (reported on 13.0% of returns)
This zip code:
$1,300
Kentucky:
$1,381
(% of AGI for various income ranges: 0.2% for AGIs below $25k, 0.1% for AGIs $25k-50k, 0.4% for AGIs $50k-75k, 0.4% for AGIs $75k-100k, 0.3% for AGIs $100k-200k, 1.3% for AGIs over 200k)
Ordinary dividends: $6,219 (reported on 8.7% of returns)
Here:
$6,219
State:
$6,239
(% of AGI for various income ranges: 0.4% for AGIs below $25k, 0.4% for AGIs $25k-50k, 0.9% for AGIs $50k-75k, 1.7% for AGIs $75k-100k, 1.2% for AGIs $100k-200k, 4.3% for AGIs over 200k)
Net capital gain/loss in AGI: +$11,220 (reported on 7.4% of returns)
Here:
+$11,220
State:
+$11,336
(% of AGI for various income ranges: 0.4% for AGIs $25k-50k, 1.4% for AGIs $50k-75k, 0.6% for AGIs $75k-100k, 1.8% for AGIs $100k-200k, 7.7% for AGIs over 200k)
Profit/loss from business: +$10,070 (reported on 11.6% of returns)
Here:
+$10,070
State:
+$10,862
(% of AGI for various income ranges: 5.6% for AGIs below $25k, 1.8% for AGIs $25k-50k, 3.0% for AGIs $50k-75k, 4.4% for AGIs $75k-100k, 5.3% for AGIs $100k-200k, 2.6% for AGIs over 200k)
Taxable individual retirement arrangement distribution: $9,762 (reported on 3.5% of returns)
40508:
$9,762
Kentucky:
$14,296
(% of AGI for various income ranges: 0.6% for AGIs below $25k, 0.8% for AGIs $25k-50k, 1.1% for AGIs $50k-75k, 3.4% for AGIs $75k-100k, 3.6% for AGIs $100k-200k)
Self-employment retirement plans: $22,050 (reported on 0.3% of returns)
40508:
$22,050
Kentucky:
$20,768
(% of AGI for various income ranges: 1.8% for AGIs $100k-200k)
Total itemized deductions: $20,810 (20% of AGI, reported on 14.7% of returns)
Here:
$20,810
State:
$21,160
Here:
19.8% of AGI
State:
20.0% of AGI
(% of AGI for various income ranges: 2.9% for AGIs below $25k, 7.1% for AGIs $25k-50k, 11.9% for AGIs $50k-75k, 14.8% for AGIs $75k-100k, 16.3% for AGIs $100k-200k, 11.6% for AGIs over 200k)
Charity contributions: $4,058 (reported on 11.8% of returns)
Here:
$4,058
State:
$4,303
(% of AGI for various income ranges: 0.3% for AGIs below $25k, 1.2% for AGIs $25k-50k, 1.9% for AGIs $50k-75k, 1.8% for AGIs $75k-100k, 2.1% for AGIs $100k-200k, 2.2% for AGIs over 200k)
Taxes paid: $9,329 (reported on 14.6% of returns)
40508:
$9,329
State:
$8,496
(% of AGI for various income ranges: 0.6% for AGIs below $25k, 2.3% for AGIs $25k-50k, 4.3% for AGIs $50k-75k, 6.3% for AGIs $75k-100k, 8.3% for AGIs $100k-200k, 6.6% for AGIs over 200k)
Earned income credit: $2,070 (reported on 33.0% of returns)
Here:
$2,070
State:
$2,273
(% of AGI for various income ranges: 7.6% for AGIs below $25k, 1.2% for AGIs $25k-50k)
Percentage of individuals using paid preparers for their 2012 taxes: 48.9%
Here:
49%
State:
60%
(% for various income ranges: 46.4% for AGIs below $25k, 49.4% for AGIs $25k-50k, 56.8% for AGIs $50k-75k, 60.0% for AGIs $75k-100k, 61.1% for AGIs $100k-200k, 76.9% for AGIs over 200k)
Averages for the 2004 tax year for zip code 40508, filed in 2005:
Average Adjusted Gross Income (AGI) in 2004: $24,035 (Individual Income Tax Returns)
Here:
$24,035
State:
$41,540
Salary/wage: $21,266 (reported on 90.9% of returns)
Here:
$21,266
State:
$36,432
(% of AGI for various income ranges: 97.9% for AGIs below $10k, 89.0% for AGIs $10k-25k, 88.5% for AGIs $25k-50k, 80.2% for AGIs $50k-75k, 76.5% for AGIs $75k-100k, 57.6% for AGIs over 100k)
Taxable interest for individuals: $1,111 (reported on 19.6% of returns)
This zip code:
$1,111
Kentucky:
$1,571
(% of AGI for various income ranges: 1.4% for AGIs below $10k, 0.6% for AGIs $10k-25k, 0.6% for AGIs $25k-50k, 1.1% for AGIs $50k-75k, 1.4% for AGIs $75k-100k, 1.2% for AGIs over 100k)
Taxable dividends: $2,955 (reported on 9.2% of returns)
Here:
$2,955
State:
$3,453
(% of AGI for various income ranges: 0.9% for AGIs below $10k, 0.3% for AGIs $10k-25k, 0.4% for AGIs $25k-50k, 0.8% for AGIs $50k-75k, 0.7% for AGIs $75k-100k, 3.3% for AGIs over 100k)
Net capital gain/loss: +$6,472 (reported on 7.6% of returns)
Here:
+$6,472
State:
+$9,663
(% of AGI for various income ranges: -0.4% for AGIs below $10k, -0.0% for AGIs $10k-25k, 0.4% for AGIs $25k-50k, 0.7% for AGIs $50k-75k, 3.4% for AGIs $75k-100k, 7.2% for AGIs over 100k)
Profit/loss from business: +$8,566 (reported on 9.3% of returns)
Here:
+$8,566
State:
+$9,233
(% of AGI for various income ranges: 4.4% for AGIs below $10k, 3.0% for AGIs $10k-25k, 1.8% for AGIs $25k-50k, 3.2% for AGIs $50k-75k, 8.4% for AGIs $75k-100k, 3.7% for AGIs over 100k)
IRA payment deduction: $2,300 (reported on 1.1% of returns)
40508:
$2,300
Kentucky:
$2,955
(% of AGI for various income ranges: 0.1% for AGIs $10k-25k, 0.1% for AGIs $25k-50k, 0.2% for AGIs $50k-75k, 0.1% for AGIs over 100k)
Self-employed pension: $18,278 (reported on 0.3% of returns)
Here:
$18,278
Kentucky:
$14,996
Total itemized deductions: $12,111 (22% of AGI, reported on 21.0% of returns)
Here:
$12,111
State:
$17,474
Here:
22.5% of AGI
State:
21.0% of AGI
(% of AGI for various income ranges: 8.5% for AGIs below $10k, 4.8% for AGIs $10k-25k, 9.9% for AGIs $25k-50k, 15.4% for AGIs $50k-75k, 18.2% for AGIs $75k-100k, 14.4% for AGIs over 100k)
Charity contributions deductions: $2,916 (4% of AGI, reported on 12.7% of returns)
Here:
$2,916
State:
$3,494
Here:
3.9% of AGI
State:
4.0% of AGI
(% of AGI for various income ranges: 0.2% for AGIs below $10k, 0.5% for AGIs $10k-25k, 1.6% for AGIs $25k-50k, 2.5% for AGIs $50k-75k, 2.9% for AGIs $75k-100k, 2.2% for AGIs over 100k)
Total tax: $3,819 (reported on 59.8% of returns)
40508:
$3,819
State:
$6,162
(% of AGI for various income ranges: 1.6% for AGIs below $10k, 3.9% for AGIs $10k-25k, 7.1% for AGIs $25k-50k, 10.6% for AGIs $50k-75k, 12.3% for AGIs $75k-100k, 19.7% for AGIs over 100k)
Earned income credit: $1,679 (reported on 31.3% of returns)
Here:
$1,679
State:
$1,723
Percentage of individuals using paid preparers for their 2004 taxes: 59.5%
Here:
59%
State:
66%
(% for various income ranges: 54.2% for AGIs below $10k, 62.3% for AGIs $10k-25k, 60.3% for AGIs $25k-50k, 63.9% for AGIs $50k-75k, 55.6% for AGIs $75k-100k, 72.0% for AGIs over 100k)
Likely homosexual households (counted as self-reported same-sex unmarried-partner households)
Lesbian couples: 0.0% of all households
Gay men: 0.4% of all households
Household received Food Stamps/SNAP in the past 12 months: 1,640 Household did not receive Food Stamps/SNAP in the past 12 months: 9,116
Women who had a birth in the past 12 months: 160 (38 now married, 125 unmarried) Women who did not have a birth in the past 12 months: 9,592 (1,248 now married, 8,275 unmarried)
Housing units in zip code 40508 with a mortgage: 2,122 (159 second mortgage, 10 home equity loan, 92 both second mortgage and home equity loan) Houses without a mortgage: 16
Median monthly owner costs for units with a mortgage: $1,164 Median monthly owner costs for units without a mortgage: $464
Residents with income below the poverty level in 2022:
This zip code:
37.6%
Whole state:
16.5%
Residents with income below 50% of the poverty level in 2022:
This zip code:
17.2%
Whole state:
9.0%
Median number of rooms in houses and condos:
Here:
6.0
State:
6.4
Median number of rooms in apartments:
Here:
3.4
State:
4.4
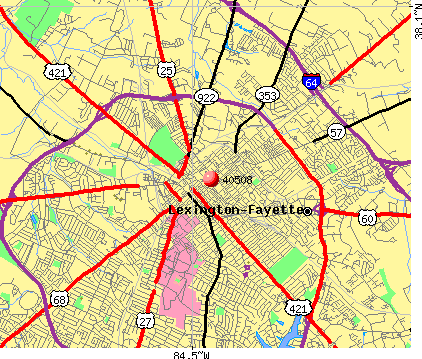
Notable locations in this zip code not listed on our city pages
Notable locations in zip code 40508: Lexington Fire Department Station 3 (A), Lexington Fire Department Station 1 Headquarters (B), Lexington Fire Department Station 5 (C), Lexington Fire Department Station 6 (D), Lexington Fire Department Station 4 (E). Display/hide their locations on the map
1,012 married couples with children.
902 single-parent households (137 men, 765 women).
86.8% of residents of 40508 zip code speak English at home.
6.7% of residents speak Spanish at home (60% very well, 18% well, 9% not well, 13% not at all).
2.4% of residents speak other Indo-European language at home (85% very well, 11% well, 5% not well).
1.8% of residents speak Asian or Pacific Island language at home (72% very well, 20% well, 8% not well).
1.8% of residents speak other language at home (88% very well, 5% well, 6% not well).
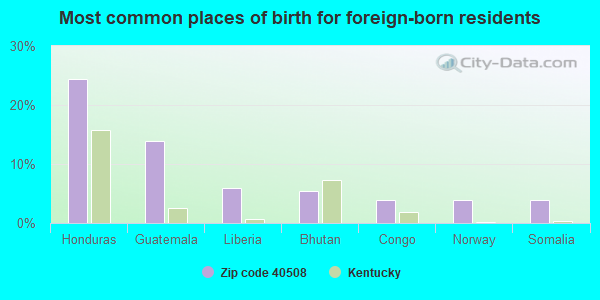
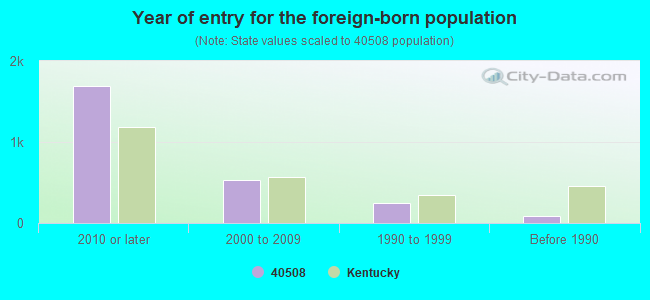
Foreign born population: 2,232 (8.7%) (27.3% of them are naturalized citizens)
This zip code:
8.7%
Whole state:
4.0%
24%Honduras
14%Guatemala
6%Liberia
5%Bhutan
4%Congo
4%Norway
4%Somalia
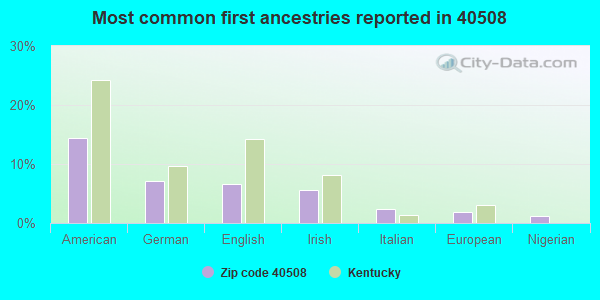
14%American
7%German
7%English
6%Irish
2%Italian
2%European
1%Nigerian
Year of entry for the foreign-born population
1,6862010 or later
5372000 to 2009
2481990 to 1999
88Before 1990
Major facilities with environmental interests located in this zip code:
BAKER IRON & METAL COMPANY INCORPORATED (717 NORTH LIMESTONE in LEXINGTON, KY)
COMPLIANCE ACTIVITY (Tracking inspections of insecticide, fungicide, and rodenticide, and toxic substances) National Pollutant Discharge Elimination System NON-MAJOR (Tracking pollutant discharge elimination systems) - permit (Resource Conservation and Recovery Act (tracking hazardous waste)) Business SIC classification: SCRAP AND WASTE MATERIALS Organizations: BAKER IRON & METAL CO INC (CONTACT/OWNER)
, BAKER IRON AND METAL CO INC (CONTACT/OWNER)
G F VAUGHAN TOBACCO CO (1247 VERSAILLES RD in LEXINGTON, KY)
AIR MINOR (AIRS/AFS) CRITERIA AND HAZARDOUS AIR POLLUTANT INVENTORY (Inventory of air pollution sources) National Pollutant Discharge Elimination System NON-MAJOR (Tracking pollutant discharge elimination systems) - permit Business SIC classification: TOBACCO STEMMING AND REDRYING Organizations: GF VAUGHAN TOBACCO CO INC (CONTACT/OWNER)
Alternative names: GF VAUGHAN TOBACCO CO INC
FLORENCE CRITTENTON ALTERNATIVE SCHOOL (519 W FOURTH ST in LEXINGTON, KY)
COMPLIANCE ACTIVITY (Tracking inspections of insecticide, fungicide, and rodenticide, and toxic substances) (National Center for Education Statistics) - STATE ID-034165230 Organizations: FAYETTE COUNTY (SCHOOL DISTRICT)
Alternative names: FLORENCE CRITTENDEN SCHOOL
MAXWELL ELEMENTARY SCHOOL (301 WOODLAND AVE in LEXINGTON, KY)
(National Center for Education Statistics) - STATE ID-034165074 Organizations: FAYETTE COUNTY (SCHOOL DISTRICT)
LEXINGTON TRAD MAGNET MIDDLE SCHOOL (350 N LIMESTONE ST in LEXINGTON, KY)
(National Center for Education Statistics) - STATE ID-034165067 Organizations: FAYETTE COUNTY (SCHOOL DISTRICT)
BOOKER T WASHINGTON MONTESSORI MAGNET EL (798 GEORGETOWN ST in LEXINGTON, KY)
(National Center for Education Statistics) - STATE ID-034165019 Organizations: FAYETTE COUNTY (SCHOOL DISTRICT)
CENTRAL KY RE EDUCATION ALTERNATIVE PROG (690 NEWTOWN PK in LEXINGTON, KY)
(National Center for Education Statistics) - STATE ID-034165650 Organizations: FAYETTE COUNTY (SCHOOL DISTRICT)
LEXINGTON HERALD LEADER (100 MIDLAND AVENUE in LEXINGTON, KY)
COMPLIANCE ACTIVITY (Tracking inspections of insecticide, fungicide, and rodenticide, and toxic substances) (Resource Conservation and Recovery Act (tracking hazardous waste))
BAKER IRON & METAL CO INC (757 E 7TH ST in LEXINGTON, KY)
National Pollutant Discharge Elimination System NON-MAJOR (Tracking pollutant discharge elimination systems) - permit Business SIC classification: SCRAP AND WASTE MATERIALS
CENTRAL KENTUCKY ASPHALT (3130 GEORGETOWN ROAD in LEXINGTON, KY)
AIR MINOR (AIRS/AFS) CRITERIA AND HAZARDOUS AIR POLLUTANT INVENTORY (Inventory of air pollution sources) Business SIC classification: ASPHALT PAVING MIXTURES AND BLOCKS
LEXINGTON-FAYETTE COUNTY HEALTH DEPART. (650 NEWTOWN PIKE in LEXINGTON, KY)
AIR MONITORING SITE (Airborne pollution emission tracking) (Resource Conservation and Recovery Act (tracking hazardous waste)) Business NAICS classification: OTHER SOCIAL ADVOCACY ORGANIZATIONS. Organizations: LEXINGTON-FAYETTE CO. BOARD OF HEALTH (CONTACT/OWNER)
Alternative names: FAYETTE CO HEALTH DEPT
LEXINGTON-FAYETTE URBAN CO. HOUSING AUTH (672 BLUEGRASS PARK DR in LEXINGTON, KY)
(Resource Conservation and Recovery Act (tracking hazardous waste))
AMERIPATH/PATHOLOGY ASSOCIATES PSC (310 S. LIMESTONE STREET in LEXINGTON, KY)
Conditionally Exempt Small Quantity Generators, less than 100 kg/month of hazardous waste (Resource Conservation and Recovery Act (tracking hazardous waste)) - notification Small Quantity Generators, between 100 kg and 1000 kg of hazardous waste/month (Resource Conservation and Recovery Act (tracking hazardous waste)) - notification Business NAICS classification: DIRECT HEALTH AND MEDICAL INSURANCE CARRIERS.; MEDICAL LABORATORIES. Organizations: AMERIPATH/PATHOLOGY ASSOC, (CONTACT/OWNER)
, AHS SAMARITAN HOSPITAL LLC (CONTACT/OWNER)
Alternative names: PATHOLOGY ASSOCIATES, P.S.C.-GOOD SAM. H, SAMARITAN HOSPITAL
Housing units lacking complete plumbing facilities: 1.3% Housing units lacking complete kitchen facilities: 3.0%
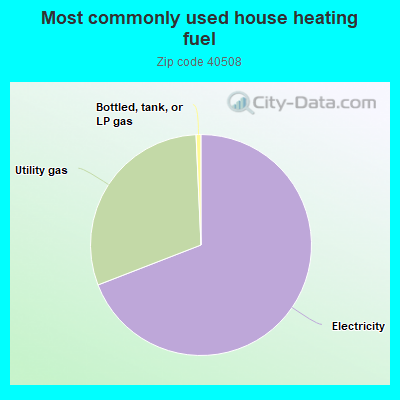
68.5%Electricity
29.9%Utility gas
0.7%Bottled, tank, or LP gas
Population in 1990: 25,161. Population change in the 1990s: +2,059 (+8.2%).
Place of birth for U.S.-born residents:
This state: 13,638
Northeast: 1,548
Midwest: 3,782
South: 3,422
West: 864
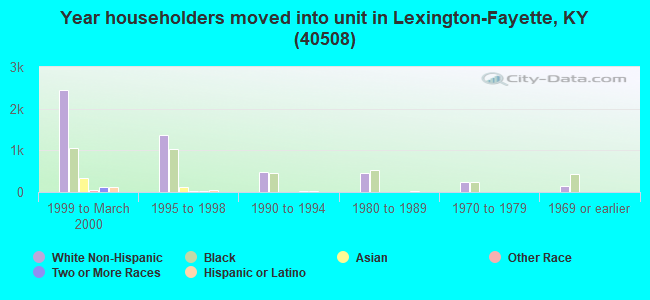
35% of the 40508 zip code residents lived in the same house 5 years ago. Out of people who lived in different houses, 43% lived in this county. Out of people who lived in different counties, 50% lived in Kentucky.
78% of the 40508 zip code residents lived in the same house 1 year ago. Out of people who lived in different houses, 57% moved from this county. Out of people who lived in different houses, 17% moved from different county within same state. Out of people who lived in different houses, 18% moved from different state. Out of people who lived in different houses, 6% moved from abroad.
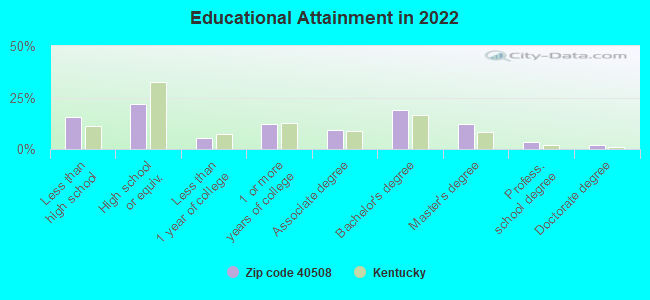
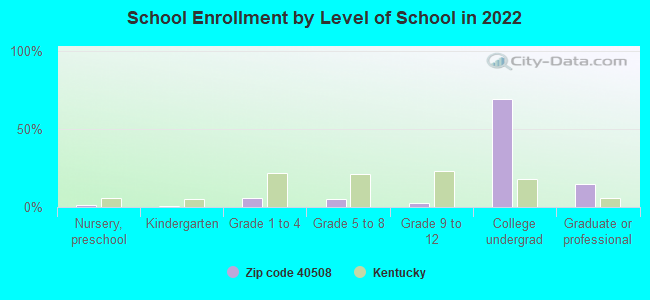
Private vs. public school enrollment:
Students in private schools in grades 1 to 8 (elementary and middle school): 315
Here:
22.5%
Kentucky:
17.2%
Students in private schools in grades 9 to 12 (high school): 16
Here:
4.5%
Kentucky:
15.2%
Students in private undergraduate colleges: 636
Here:
7.3%
Kentucky:
19.6%
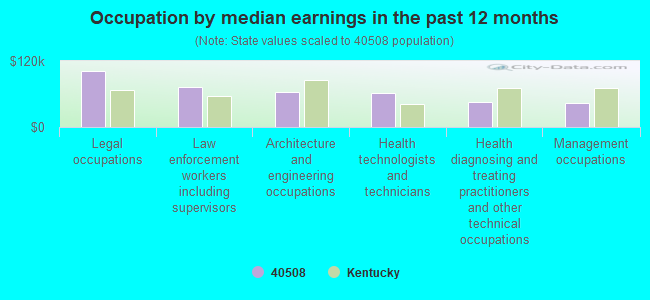
Occupation by median earnings in the past 12 months ($)
102,659Legal occupations
72,544Law enforcement workers including supervisors
64,399Architecture and engineering occupations
61,125Health technologists and technicians
46,190Health diagnosing and treating practitioners and other technical occupations
43,068Management occupations
Companies with federal contracts located in this zip code:
KABA MAS CORPORATION (749 WEST SHORT STREET in LEXINGTON, KY) : $285,535,320 in 31 contractsfrom 2000 to 2006
Contracts for Hardware, Commercial by Defense Logistics Agency Signed by year:2000: $17,609,920; 2001: $0; 2002: $1,983,000; 2003: $0; 2004: $92,146,200; 2005: $105,396,200; 2006: $68,400,000.
Biggest contracts:
$85,920,000 with Defense Logistics Agency for Hardware, Commercial. Signed on 2004-09-29. Completion date: 2004-09-29.
$67,500,000, same as above.Signed on 2005-11-17. Completion date: 2006-01-16.
$67,500,000, same as above.Signed on 2006-05-19. Completion date: 2006-07-18.
$35,600,000, same as above.Signed on 2005-09-09. Completion date: 2005-11-08.
BASKIN SOLUTIONS, INC (621 BOONESBORO AVE in LEXINGTON, KY; small business) : $81,021 in 6 contractsfrom 2001 to 2003
Contracts for ADP Software, Modification of Equipment -- Automatic Data Processing Equipment (Including Firmware), Software, Supplies and Support Equipment by Army Signed by year:2000: $0; 2001: $27,300; 2002: $30,296; 2003: $23,425; 2004: $0; 2005: $0; 2006: $0.
Biggest contracts:
$27,300 with Army for ADP Software. Signed on 2001-09-04. Completion date: 2002-01-31.
$23,425, same as above.Signed on 2003-03-12. Completion date: 2003-03-28.
$16,000, same as above.Signed on 2002-09-23. Completion date: 2002-09-28.
$8,000, same as above.Signed on 2002-06-25. Completion date: 2002-09-30.
HOST COMMUNICATIONS, INC (546 EAST MAIN STREET in LEXINGTON, KY)
$40,000 with Army for Advertising Services. Taking place in TN. Signed on 2006-06-28. Completion date: 2006-12-31.
Top industries in this zip code by the number of employees in 2005:
Health Care and Social Assistance: General Medical and Surgical Hospitals (over 1000 employees: 1 establishment)
Health Care and Social Assistance: Specialty (except Psychiatric and Substance Abuse) Hospitals (500-999: 1, 100-249: 1)
Other Services (except Public Administration): Religious Organizations (500-999: 1, 20-49: 1, 10-19: 2, 5-9: 5, 1-4: 10)
Educational Services: Colleges, Universities, and Professional Schools (500-999: 1, 50-99: 1)
Health Care and Social Assistance: Psychiatric and Substance Abuse Hospitals (500-999: 1, 50-99: 1)
2004 - 2018 National Fire Incident Reporting System (NFIRS) incidents
Based on the data from the years 2004 - 2018 the average number of fires per year is 164. The highest number of reported fire incidents - 230 took place in 2012, and the least - 117 in 2017. The data has a decreasing trend.
When looking into fire subcategories, the most incidents belonged to: Structure Fires (50.8%), and Outside Fires (35.1%).
Fire incident types reported to NFIRS in Zip Code 40508


 Nearest zip codes: 40507, 40506, 40504, 40505, 40502, 40503.


 Based on the data from the years 2004 - 2018 the average number of fires per year is 164. The highest number of reported fire incidents - 230 took place in 2012, and the least - 117 in 2017. The data has a decreasing trend.
 When looking into fire subcategories, the most incidents belonged to: Structure Fires (50.8%), and Outside Fires (35.1%).