Ocala neighborhood in San Jose, California (CA), 95148 detailed profile
Settings
X

Business Search - 14 Million verified businesses
Area: 0.108 square miles
Population: 1,192
Population density:
| Ocala: | 11,000 people per square mile |
| San Jose: | 5,554 people per square mile |

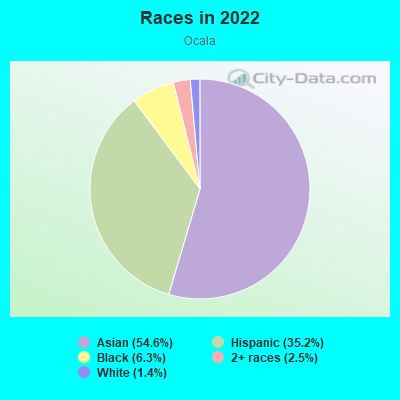
- 66654.6%Asian
- 42935.2%Hispanic or Latino
- 776.3%Black
- 312.5%Two or more races
- 171.4%White
Median household income in 2022:
| Ocala: | $112,100 |
| San Jose: | $133,835 |
Distribution of median household income
![Distribution of median household income]()
- 6Less than $10,000
- 22$10,000 to $19,999
- 24$20,000 to $29,999
- 16$30,000 to $39,999
- 28$60,000 to $74,999
- 30$75,000 to $99,999
- 35$100,000 to $124,999
- 22$125,000 to $149,999
- 39$150,000 to $199,999
- 76$200,000 or more

Distribution of owner-occupied house/condo value
![Distribution of owner-occupied house/condo value]()
- 13Less than $50,000
- 17$50,000 to $99,999
- 2$100,000 to $149,999
- 14$400,000 to $499,999
- 27$500,000 to $749,999
- 82$750,000 to $999,999
- 107$1,000,000 or more

Distribution of rent paid by renters
![Distribution of rent paid by renters]()
- 16$1,000 to $1,249
- 42$2,000 or more

Median rent in 2022:
| Ocala: | $3,035 |
| San Jose: | $2,001 |
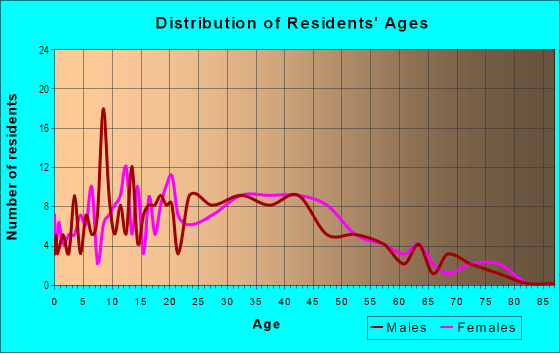
| Males: | 581 |
| Females: | 610 |
Males:
| This neighborhood: | 39.6 years |
| Whole city: | 37.6 years |
| This neighborhood: | 39.8 years |
| Whole city: | 39.1 years |
Average household size:
| Ocala: | 4.3 people |
| San Jose: | 2.9 people |
Percentage of family households:
| Ocala: | 40.0% |
| San Jose: | 49.9% |
| Here: | 69.1% |
| San Jose: | 53.0% |
Percentage of married-couple families with children (among all households):
| Ocala: | 20.6% |
| San Jose: | 25.8% |
Percentage of single-mother households (among all households):
| Ocala: | 1.8% |
| San Jose: | 5.2% |
Percentage of never married males 15 years old and over:
Percentage of never married females 15 years old and over:
| Ocala: | 15.9% |
| San Jose: | 20.9% |
Percentage of never married females 15 years old and over:
| Ocala: | 19.0% |
| city: | 16.7% |
Percentage of people that speak English not well or not at all:
| Ocala: | 24.0% |
| San Jose: | 11.4% |
Percentage of people born in this state:
Percentage of people born in another U.S. state:
Percentage of native residents but born outside the U.S.:
Percentage of foreign born residents:
| Here: | 39.5% |
| San Jose: | 46.1% |
Percentage of people born in another U.S. state:
| Ocala: | 6.7% |
| San Jose: | 10.4% |
Percentage of native residents but born outside the U.S.:
| Here: | 4.7% |
| city: | 1.7% |
Percentage of foreign born residents:
| Here: | 49.0% |
| San Jose: | 41.8% |
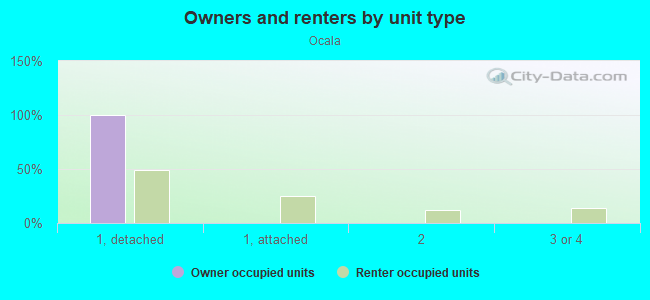
Owner-occupied
Renter-occupied

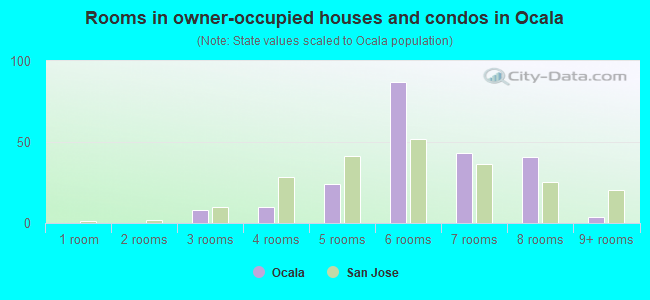
- Rooms in owner-occupied houses and condos in Ocala
- 01 room
- 02 rooms
- 83 rooms
- 104 rooms
- 245 rooms
- 876 rooms
- 437 rooms
- 418 rooms
- 49+ rooms
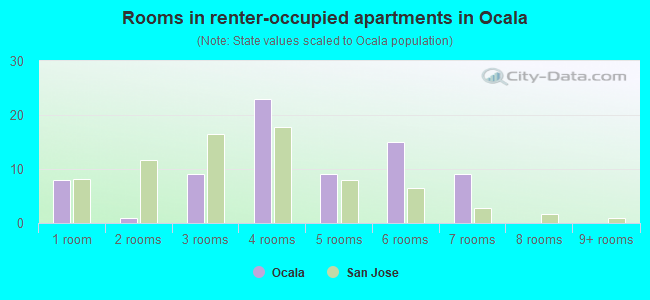
- Rooms in renter-occupied apartments in Ocala
- 81 room
- 12 rooms
- 93 rooms
- 234 rooms
- 95 rooms
- 156 rooms
- 97 rooms
- 08 rooms
- 09+ rooms
Owner-occupied
Renter-occupied
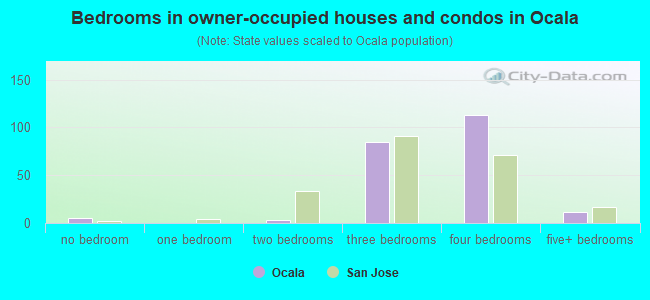
- Bedrooms in owner-occupied houses and condos in Ocala
- 5no bedroom
- 01 bedroom
- 32 bedrooms
- 853 bedrooms
- 1134 bedrooms
- 125+ bedrooms
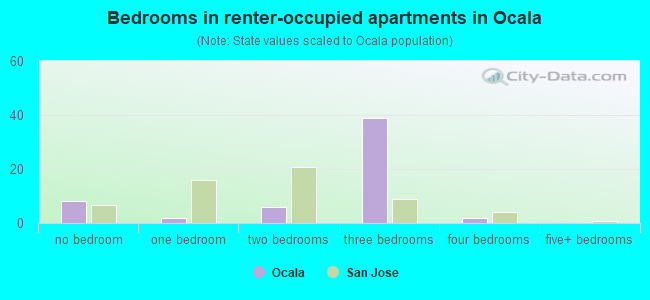
- Bedrooms in renter-occupied apartments in Ocala
- 8no bedroom
- 21 bedroom
- 62 bedrooms
- 393 bedrooms
- 24 bedrooms
- 05+ bedrooms
Average number of cars or other vehicles available in houses/condos:
Average number of cars or other vehicles available in apartments:
| This neighborhood: | 2.9 |
| San Jose: | 2.3 |
Average number of cars or other vehicles available in apartments:
| Here: | 1.7 |
| city: | 1.6 |
Percentage of units with a mortgage:
| Ocala: | 72.0% |
| San Jose: | 66.9% |
Average estimated value of detached houses in 2022 (91.3% of all units):
| Ocala: | $1,073,057 |
| San Jose: | $1,532,815 |
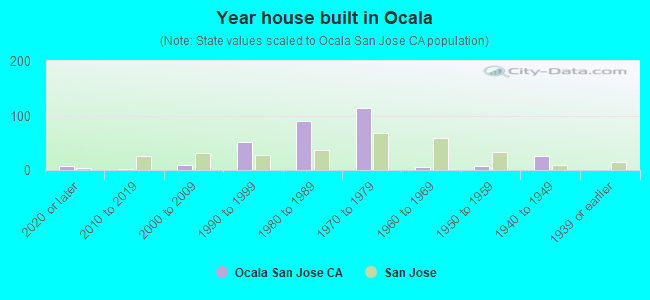
- Year house built in Ocala
- 82020 or later
- 12010 to 2019
- 92000 to 2009
- 521990 to 1999
- 891980 to 1989
- 1141970 to 1979
- 51960 to 1969
- 71950 to 1959
- 251940 to 1949
- 01939 or earlier
City-data.com crime index for city in 2020 (higher means more crime):
| City: | 268.4 |
| U.S. average: | 219.5 |
Travel time to work (commute)
![Travel time to work (commute)]()
- 1Less than 5 minutes
- 265 to 9 minutes
- 3710 to 14 minutes
- 8515 to 19 minutes
- 9720 to 24 minutes
- 4825 to 29 minutes
- 7530 to 34 minutes
- 2735 to 39 minutes
- 840 to 44 minutes
- 3945 to 59 minutes
- 5460 to 89 minutes
- 1390 or more minutes

Means of transportation to work
![Means of transportation to work]()
- 76.1%422Drove a car alone
- 19.5%108Carpooled
- 0.9%5Bus
- 1.4%8Bicycle
- 0.7%4Other means
- 4.1%23Worked at home

Time leaving home to go to work
![Time leaving home to go to work]()
- 812:00 a.m. to 4:59 a.m.
- 225:00 a.m. to 5:29 a.m.
- 415:30 a.m. to 5:59 a.m.
- 116:00 a.m. to 6:29 a.m.
- 476:30 a.m. to 6:59 a.m.
- 777:00 a.m. to 7:29 a.m.
- 637:30 a.m. to 7:59 a.m.
- 338:00 a.m. to 8:29 a.m.
- 388:30 a.m. to 8:59 a.m.
- 389:00 a.m. to 9:59 a.m.
- 3010:00 a.m. to 10:59 a.m.
- 211:00 a.m. to 11:59 a.m.
- 4712:00 p.m. to 3:59 p.m.
- 494:00 p.m. to 11:59 p.m.

Occupations of males:
- Percentage of males in management occupations (except farmers):
Here: 3.5% city: 13.0%
- Percentage of males in business and financial operations occupations:
Here: 4.8% city: 4.6%
- Percentage of males in computer and mathematical occupations:
Here: 8.5% city: 13.6%
- Percentage of males in architecture and engineering occupations:
Here: 9.6% city: 10.2%
- Percentage of males in healthcare practitioners and technical occupations:
Here: 3.4% city: 2.0%
- Percentage of males in service occupations:
Here: 7.8% city: 12.7%
- Percentage of males in sales and office occupations:
Here: 15.9% city: 12.8%
- Percentage of males in construction, extraction, and maintenance occupations:
Here: 11.7% city: 7.8%
- Percentage of males in production occupations:
Here: 22.3% city: 5.5%
- Percentage of males in transportation occupations:
Here: 3.4% city: 3.6%
- Percentage of males in material moving occupations:
Here: 3.6% city: 3.1%
Occupations of females:
- Percentage of females in management occupations (except farmers):
Here: 2.1% city: 11.0%
- Percentage of females in business and financial operations occupations:
Here: 4.5% city: 8.6%
- Percentage of females in computer and mathematical occupations:
Here: 3.1% city: 5.4%
- Percentage of females in architecture and engineering occupations:
Here: 2.6% city: 2.8%
- Percentage of females in education, training, and library occupations:
Here: 8.1% city: 8.1%
- Percentage of females in healthcare practitioners and technical occupations:
Here: 5.5% city: 6.8%
- Percentage of females in service occupations:
Here: 20.4% city: 21.7%
- Percentage of females in sales and office occupations:
Here: 31.6% city: 22.0%
- Percentage of females in farming, fishing, and forestry occupations:
Here: 1.5% city: 0.2%
- Percentage of females in production occupations:
Here: 14.8% city: 4.0%
- Percentage of females in material moving occupations:
Here: 5.1% city: 1.5%
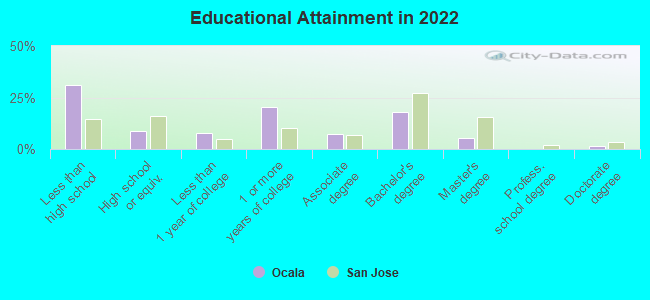
Education in this neighborhood (subdivision or community):
- Percentage of people 3 years and older in K-12 schools:
Ocala: 18.9% San Jose: 16.1%
- Percentage of people 3 years and older in undergraduate colleges:
Ocala: 7.2% San Jose: 6.5%
- Percentage of people 3 years and older in grad. or professional schools:
Ocala: 0.7% San Jose: 2.0%
- Percentage of students K-12 enrolled in private schools:
Ocala: 5.9% San Jose: 14.9%
Percentage of population below poverty level:
| Ocala: | 10.8% |
| San Jose: | 9.0% |
Median year owner moved in (as recorded in 2022):
Median year renter moved in (as recorded in 2022):
| Ocala: | 2001 |
| San Jose: | 2008 |
Median year renter moved in (as recorded in 2022):
| Ocala: | 2016 |
| San Jose: | 2020 |
Percentage of married-couple families with both working:
| Ocala: | 93.1% |
| San Jose: | 72.5% |
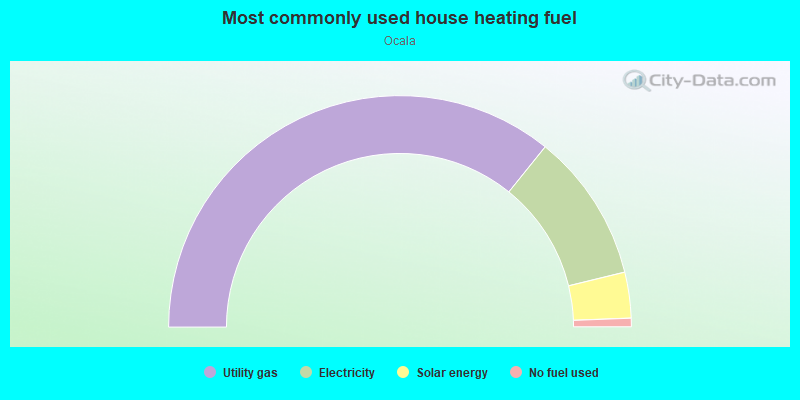
- 71.6%Utility gas
- 20.8%Electricity
- 6.4%Solar energy
- 1.2%No fuel used
Roads and streets:
Home Gate Dr
Length: 0.47 miles
Directions: E-W, N-S, SE-NW, SW-NE
Address range: 1700 to 1899
Directions: E-W, N-S, SE-NW, SW-NE
Address range: 1700 to 1899
Ocala Ave
Length: 0.43 miles
Directions: E-W, SW-NE
Address range: 2500 to 2973
Directions: E-W, SW-NE
Address range: 2500 to 2973
Wonderama Dr
Length: 0.22 miles
Direction: SE-NW
Address range: 1900 to 2018
Direction: SE-NW
Address range: 1900 to 2018
Supreme Dr
Length: 0.20 miles
Directions: E-W, N-S, SE-NW, SW-NE
Address range: 1900 to 1999
Directions: E-W, N-S, SE-NW, SW-NE
Address range: 1900 to 1999
Home Crest Dr
Length: 0.12 miles
Directions: E-W, SW-NE
Address range: 2500 to 2599
Directions: E-W, SW-NE
Address range: 2500 to 2599
Pixanne Ct
Length: 0.11 miles
Direction: E-W
Address range: 2600 to 2698
Direction: E-W
Address range: 2600 to 2698
Sesame Ct
Length: 0.09 miles
Direction: E-W
Address range: 2500 to 2599
Direction: E-W
Address range: 2500 to 2599
Other features:
Silver Crk
Length: 0.09 miles
Direction: SE-NW
Direction: SE-NW