San Jose, California Neighborhood Map - Income, House Prices, Occupations, Boundaries
Settings
X

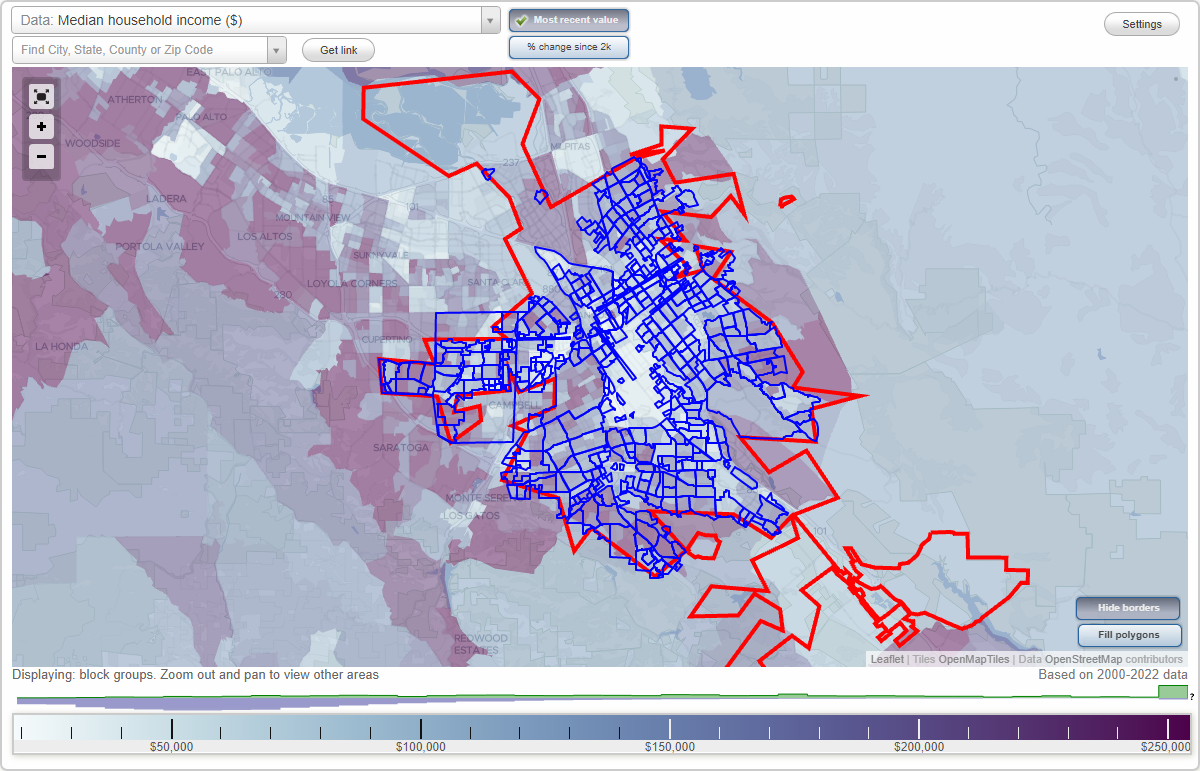
- City boundary
- Neighborhood boundaries
Business Search - 14 Million verified businesses
Albanese - Hermes Neighborhoods:
Albanese, Albertstone, Alderbrook, Alexander, Alexian, Alma, Almaden, Almaden Community Association, Almaden Hills Estates, Almaden Lake, Almaden Meadows, Almaden Springs, Almaden Winery, Alum Rock Avenue, Alvin, Anderson East, Anderson West, Ann Darling, Arbuckle, Arctic Sue, Ashbridge, Atlanta, Autumn, Auzerais, Avenida Espana, Avis, Banana Grove, Barbera, Barletta, Bascom, Baton Rouge, Battaglia, Berry Park, Berryessa Creek, Beverly, Bevin Brook, Blackford, Blossom Crest, Blossom Hill Homes, Blossom River, Bluewater, Bonita, Boulder, Branham, Branham Jarvis, Branham Kirk, Brenning, Brianna, Brigadoon, Broadway, Brooktree, Brookvale, Brookwood South, Brookwood Terrace, Brush Glen, Bucknall, Buena Park, Buena Vista, Burning Tree, Cadillac East, Cadillac West, Cadwallader, Cahalan, Calabazas North, Calabazas South, Calderwood, Calero, California Maison, California Ridge, Cambrian Council District, Candlestick, Canoas East, Canoas Garden, Canoas West, Capewood, Capitol, Carlton, Carmine, Carol Drive, Carson, Cassell, Castlemont, Castro, Cataldi, Cedarville, Centerwood, Century, Chaboya, Chantilley, Chapman, Checkers, Cherrywood, Cimarron, Cinco de Mayo, Cinderella, Cinnabar, Claitor, Clareview, Clayton North, Clayton South, Clinic, Clovercrest, Coldwater, College Park, Colonial, Colony Green, Comanche, Commodore, Cornwall, Cory, Country Club, Country Lane, Country View Estates, Countrybrook, Coyote, Cramer, Creek, Creekland, Creekside, Crossgate, Croydon, Cypress, Danna Rock, Dartmouth, David, Davis, De Marietta, De Voss, Deer Run, Deer Run #2, Del Mar, Del Robles, Dentwood, Dobern, Doerr, Doncaster, Dorsa, Dove Hill, Downing, Downtown, Drake, Dry Creek, East Campus, East Dobern, East Northside, East Santa Clara Street, East West Courts, Eastside, Eden, Edenvale, Edge, El Rancho Verde, Erikson, Estates, Evans, Everdale, Evergreen Hidden Glen, Farm Drive, Farnam, Fenton, Ferrari, Five Wounds, Flickinger North, Flickinger South, Florence, Florence Court, Forest, Foss, Fowler, Foxchase, Fruitdale College, Fruitdale Rexford, Garden, Garden Alameda, Gardner, Gateview, Gawain, Gilchrist, Glen Crest, Glenview Serenity, Glider, Gold Creek, Goodyear, Gordy, Granite Creek, Graystone, Great Oaks, Greylands, Guadalupe Almaden, Guadalupe Canoas, Guadalupe Oak Grove, Hamann Park, Hammer, Hannah, Hathaway, Hayes, Hellyer, Hensley, Heritage, HermesAlbanese neighborhood in San Jose statistics: (Find on map)
Area: 0.023 square miles
Population: 225
Population density:
Median household income in 2021:
Median rent in in 2021:
Male vs Females
Median age
Most popular occupations of males: production occupations (24.8%); service occupations (11.6%); architecture and engineering occupations (10.1%); construction, extraction, and maintenance occupations (10.0%); transportation occupations (6.6%); education, training, and library occupations (5.5%); healthcare practitioners and technical occupations (4.9%)
Most popular occupations of females: service occupations (32.7%); sales and office occupations (21.6%); production occupations (13.8%); healthcare practitioners and technical occupations (8.8%); management occupations (except farmers) (7.8%); education, training, and library occupations (5.0%); life, physical, and social science occupations (3.5%)
Roads and streets: Albanese Cir; la Ragione Ave; Gier Ct; Futamase Ct; Rettus Ct.
Albanese neighborhood detailed profile
Area: 0.023 square miles
Population: 225
Population density:
| Albanese: | 9,967 people per square mile |
| San Jose: | 5,625 people per square mile |
Median household income in 2021:
| Albanese: | $81,020 |
| San Jose: | $126,377 |
Median rent in in 2021:
| Albanese: | $1,425 |
| San Jose: | $2,001 |
Male vs Females
| Males: | 113 |
| Females: | 111 |
Median age
| Males: | 36.6 years |
| Females: | 36.3 years |
Most popular occupations of males: production occupations (24.8%); service occupations (11.6%); architecture and engineering occupations (10.1%); construction, extraction, and maintenance occupations (10.0%); transportation occupations (6.6%); education, training, and library occupations (5.5%); healthcare practitioners and technical occupations (4.9%)
Most popular occupations of females: service occupations (32.7%); sales and office occupations (21.6%); production occupations (13.8%); healthcare practitioners and technical occupations (8.8%); management occupations (except farmers) (7.8%); education, training, and library occupations (5.0%); life, physical, and social science occupations (3.5%)
Roads and streets: Albanese Cir; la Ragione Ave; Gier Ct; Futamase Ct; Rettus Ct.
Albanese neighborhood detailed profile
Albertstone neighborhood in San Jose statistics: (Find on map)
Area: 0.070 square miles
Population: 1,075
Population density:
Median household income in 2021:
Median rent in in 2021:
Male vs Females
Median age
Housing prices:
Average estimated value of detached houses in 2021 (36.9% of all units):
Average estimated value of townhouses or other attached units in 2021 (10.7% of all units):
Average estimated value of housing units in 2-unit structures in 2021 (3.7% of all units):
Average estimated '21 value of housing units in 3-to-4-unit structures (15.5% of all units):
Most popular occupations of males: service occupations (30.4%); architecture and engineering occupations (12.7%); construction, extraction, and maintenance occupations (8.5%); production occupations (8.5%); sales and office occupations (6.7%); community and social services occupations (5.3%); education, training, and library occupations (4.9%)
Most popular occupations of females: sales and office occupations (29.6%); service occupations (26.5%); computer and mathematical occupations (10.9%); community and social services occupations (7.3%); healthcare practitioners and technical occupations (6.2%); education, training, and library occupations (4.8%); material moving occupations (4.1%)
Roads and streets: Albertstone Dr; Hayford Dr; Mendenhall Dr; Cloverdale Ln; Cassiar Dr; Beck Dr; Boise Dr; Springfield Dr.
Albertstone neighborhood detailed profile
Area: 0.070 square miles
Population: 1,075
Population density:
| Albertstone (Beck): | 15,359 people per square mile |
| San Jose: | 5,625 people per square mile |
Median household income in 2021:
| Albertstone (Beck): | $110,322 |
| San Jose: | $126,377 |
Median rent in in 2021:
| Albertstone (Beck): | $2,252 |
| San Jose: | $2,001 |
Male vs Females
| Males: | 516 |
| Females: | 559 |
Median age
| Males: | 41.1 years |
| Females: | 39.0 years |
Housing prices:
Average estimated value of detached houses in 2021 (36.9% of all units):
| Albertstone (Beck): | $4,001,825 |
| San Jose: | $1,403,256 |
Average estimated value of townhouses or other attached units in 2021 (10.7% of all units):
| This neighborhood: | $1,260,959 |
| city: | $892,629 |
Average estimated value of housing units in 2-unit structures in 2021 (3.7% of all units):
| This neighborhood: | $4,379,165 |
| San Jose: | $753,788 |
Average estimated '21 value of housing units in 3-to-4-unit structures (15.5% of all units):
| Albertstone (Beck): | $1,027,429 |
| city: | $680,453 |
Most popular occupations of males: service occupations (30.4%); architecture and engineering occupations (12.7%); construction, extraction, and maintenance occupations (8.5%); production occupations (8.5%); sales and office occupations (6.7%); community and social services occupations (5.3%); education, training, and library occupations (4.9%)
Most popular occupations of females: sales and office occupations (29.6%); service occupations (26.5%); computer and mathematical occupations (10.9%); community and social services occupations (7.3%); healthcare practitioners and technical occupations (6.2%); education, training, and library occupations (4.8%); material moving occupations (4.1%)
Roads and streets: Albertstone Dr; Hayford Dr; Mendenhall Dr; Cloverdale Ln; Cassiar Dr; Beck Dr; Boise Dr; Springfield Dr.
Albertstone neighborhood detailed profile
Alderbrook neighborhood in San Jose statistics: (Find on map)
Area: 0.247 square miles
Population: 1,819
Population density:
Median household income in 2021:
Median rent in in 2021:
Male vs Females
Median age
Average estimated value of detached houses in 2021 (98.1% of all units):
Most popular occupations of males: computer and mathematical occupations (33.2%); management occupations (except farmers) (15.1%); sales and office occupations (10.9%); service occupations (10.6%); architecture and engineering occupations (9.6%); arts, design, entertainment, sports, and media occupations (4.3%); material moving occupations (3.8%)
Most popular occupations of females: computer and mathematical occupations (18.0%); management occupations (except farmers) (12.8%); business and financial operations occupations (12.5%); service occupations (10.9%); production occupations (9.1%); sales and office occupations (8.0%); education, training, and library occupations (7.8%)
Roads and streets: Alderbrook Ln; Edgemoor Way; Miller Ave; Belvedere Ln; Devonshire Dr; Craig Dr; Canterbury Ct; Danbury Dr; Corvette Dr; Lancer Dr; Bollinger Rd; Bancroft Way; Danridge Dr; Windsor Ln; Bretmoor Way; Edsel Dr; Century Dr; Dresden Way; Imperial Way; Cabot Pl; de Ville Way; Capri Way; Cameron Pl.
Alderbrook neighborhood detailed profile
Area: 0.247 square miles
Population: 1,819
Population density:
| Alderbrook: | 7,364 people per square mile |
| San Jose: | 5,625 people per square mile |
Median household income in 2021:
| Alderbrook: | $240,424 |
| San Jose: | $126,377 |
Median rent in in 2021:
| Alderbrook: | $3,494 |
| San Jose: | $2,001 |
Male vs Females
| Males: | 899 |
| Females: | 919 |
Median age
| Males: | 43.6 years |
| Females: | 44.3 years |
Average estimated value of detached houses in 2021 (98.1% of all units):
| Alderbrook: | $1,653,885 |
| San Jose: | $1,403,256 |
Most popular occupations of males: computer and mathematical occupations (33.2%); management occupations (except farmers) (15.1%); sales and office occupations (10.9%); service occupations (10.6%); architecture and engineering occupations (9.6%); arts, design, entertainment, sports, and media occupations (4.3%); material moving occupations (3.8%)
Most popular occupations of females: computer and mathematical occupations (18.0%); management occupations (except farmers) (12.8%); business and financial operations occupations (12.5%); service occupations (10.9%); production occupations (9.1%); sales and office occupations (8.0%); education, training, and library occupations (7.8%)
Roads and streets: Alderbrook Ln; Edgemoor Way; Miller Ave; Belvedere Ln; Devonshire Dr; Craig Dr; Canterbury Ct; Danbury Dr; Corvette Dr; Lancer Dr; Bollinger Rd; Bancroft Way; Danridge Dr; Windsor Ln; Bretmoor Way; Edsel Dr; Century Dr; Dresden Way; Imperial Way; Cabot Pl; de Ville Way; Capri Way; Cameron Pl.
Alderbrook neighborhood detailed profile
Alexander neighborhood in San Jose statistics: (Find on map)
Area: 0.182 square miles
Limited-access highways (interstate or state) in this neighborhood: Sinclair Fwy (I- 680).
Roads and streets: N Capitol Ave; Alexander Ave; Madden Ave; Mueller Ave; Alexander Ct; Gramercy Pl; Monte Verano Ct; Elodie Way; Gebhart Ave.
Alexander neighborhood detailed profile
Area: 0.182 square miles
Limited-access highways (interstate or state) in this neighborhood: Sinclair Fwy (I- 680).
Roads and streets: N Capitol Ave; Alexander Ave; Madden Ave; Mueller Ave; Alexander Ct; Gramercy Pl; Monte Verano Ct; Elodie Way; Gebhart Ave.
Alexander neighborhood detailed profile
Alexian neighborhood in San Jose statistics: (Find on map)
Area: 0.046 square miles
Limited-access highways (interstate or state) in this neighborhood: I- 680 (Sinclair Fwy).
Roads and streets: Pamela Ave; Mather Dr; Schott St; Rothrack Dr; Brill Ct; Montclair Ave; Madden Ave.
Alexian neighborhood detailed profile
Area: 0.046 square miles
Limited-access highways (interstate or state) in this neighborhood: I- 680 (Sinclair Fwy).
Roads and streets: Pamela Ave; Mather Dr; Schott St; Rothrack Dr; Brill Ct; Montclair Ave; Madden Ave.
Alexian neighborhood detailed profile
Alma neighborhood in San Jose statistics: (Find on map)
Area: 0.174 square miles
Population: 609
Population density:
Median household income in 2021:
Median rent in in 2021:
Male vs Females
Median age
Most popular occupations of males: sales and office occupations (54.1%); arts, design, entertainment, sports, and media occupations (26.1%); service occupations (14.4%); computer and mathematical occupations (13.7%); architecture and engineering occupations (9.8%); legal occupations (9.8%); management occupations (except farmers) (8.3%)
Most popular occupations of females: sales and office occupations (36.8%); service occupations (19.9%); business and financial operations occupations (18.8%); management occupations (except farmers) (15.2%); healthcare practitioners and technical occupations (15.1%); education, training, and library occupations (12.0%); computer and mathematical occupations (6.1%)
Limited-access highways (interstate or state) in this neighborhood: Almaden Expy (Co Hwy G8).
Highways in this neighborhood: Monterey Hwy (State Hwy 82).
Roads and streets: la Rossa Cir; Shadow Run Dr; W Shadowgraph Dr; Shadow Dance Dr; Bellevue Ave; Cottage Grove Ave; Sanborn Ave; Stonegate Cir; Pomona Ave; Ford Ave; Darby Ct; Almaden Rd; Austin Ct; Roberts Ct; la Rossa Ct.
Railroad features: Union Pacific RR.
Alma neighborhood detailed profile
Area: 0.174 square miles
Population: 609
Population density:
| Alma: | 3,497 people per square mile |
| San Jose: | 5,625 people per square mile |
Median household income in 2021:
| Alma: | $235,893 |
| San Jose: | $126,377 |
Median rent in in 2021:
| Alma: | $1,979 |
| San Jose: | $2,001 |
Male vs Females
| Males: | 291 |
| Females: | 317 |
Median age
| Males: | 52.1 years |
| Females: | 51.3 years |
Most popular occupations of males: sales and office occupations (54.1%); arts, design, entertainment, sports, and media occupations (26.1%); service occupations (14.4%); computer and mathematical occupations (13.7%); architecture and engineering occupations (9.8%); legal occupations (9.8%); management occupations (except farmers) (8.3%)
Most popular occupations of females: sales and office occupations (36.8%); service occupations (19.9%); business and financial operations occupations (18.8%); management occupations (except farmers) (15.2%); healthcare practitioners and technical occupations (15.1%); education, training, and library occupations (12.0%); computer and mathematical occupations (6.1%)
Limited-access highways (interstate or state) in this neighborhood: Almaden Expy (Co Hwy G8).
Highways in this neighborhood: Monterey Hwy (State Hwy 82).
Roads and streets: la Rossa Cir; Shadow Run Dr; W Shadowgraph Dr; Shadow Dance Dr; Bellevue Ave; Cottage Grove Ave; Sanborn Ave; Stonegate Cir; Pomona Ave; Ford Ave; Darby Ct; Almaden Rd; Austin Ct; Roberts Ct; la Rossa Ct.
Railroad features: Union Pacific RR.
Alma neighborhood detailed profile
Almaden neighborhood in San Jose statistics: (Find on map)
Area: 0.074 square miles
Limited-access highways (interstate or state) in this neighborhood: Almaden Expy.
Roads and streets: Clara Felice Way; Cassatt Way; Felix Way; Dix Way; Sanger Way; Tubman Ct.
Almaden neighborhood detailed profile
Area: 0.074 square miles
Limited-access highways (interstate or state) in this neighborhood: Almaden Expy.
Roads and streets: Clara Felice Way; Cassatt Way; Felix Way; Dix Way; Sanger Way; Tubman Ct.
Almaden neighborhood detailed profile
Almaden Community Association neighborhood in San Jose statistics: (Find on map)
Area: 0.062 square miles
Population: 421
Population density:
Median household income in 2021:
Median rent in in 2021:
Male vs Females
Median age
Most popular occupations of males: transportation occupations (24.9%); service occupations (21.9%); sales and office occupations (13.9%); management occupations (except farmers) (13.0%); computer and mathematical occupations (12.1%); construction, extraction, and maintenance occupations (5.2%); architecture and engineering occupations (4.3%)
Most popular occupations of females: management occupations (except farmers) (27.5%); sales and office occupations (23.4%); service occupations (18.1%); education, training, and library occupations (9.4%); healthcare practitioners and technical occupations (8.3%); community and social services occupations (6.4%); arts, design, entertainment, sports, and media occupations (4.9%)
Limited-access highways (interstate or state) in this neighborhood: Almaden Expy.
Roads and streets: Via Monte Dr; Mesa Dr; Almaden Rd; Tucson Dr; Carlsbad Dr.
Almaden Community Association neighborhood detailed profile
Area: 0.062 square miles
Population: 421
Population density:
| Almaden Community Association: | 6,785 people per square mile |
| San Jose: | 5,625 people per square mile |
Median household income in 2021:
| Almaden Community Association: | $171,000 |
| San Jose: | $126,377 |
Median rent in in 2021:
| Almaden Community Association: | $1,827 |
| San Jose: | $2,001 |
Male vs Females
| Males: | 246 |
| Females: | 174 |
Median age
| Males: | 42.3 years |
| Females: | 40.3 years |
Most popular occupations of males: transportation occupations (24.9%); service occupations (21.9%); sales and office occupations (13.9%); management occupations (except farmers) (13.0%); computer and mathematical occupations (12.1%); construction, extraction, and maintenance occupations (5.2%); architecture and engineering occupations (4.3%)
Most popular occupations of females: management occupations (except farmers) (27.5%); sales and office occupations (23.4%); service occupations (18.1%); education, training, and library occupations (9.4%); healthcare practitioners and technical occupations (8.3%); community and social services occupations (6.4%); arts, design, entertainment, sports, and media occupations (4.9%)
Limited-access highways (interstate or state) in this neighborhood: Almaden Expy.
Roads and streets: Via Monte Dr; Mesa Dr; Almaden Rd; Tucson Dr; Carlsbad Dr.
Almaden Community Association neighborhood detailed profile
Almaden Hills Estates neighborhood in San Jose statistics: (Find on map)
Area: 0.097 square miles
Population: 43
Population density:
Median household income in 2021:
Median rent in in 2021:
Male vs Females
Median age
Housing prices:
Average estimated value of detached houses in 2021 (31.8% of all units):
Average estimated value of townhouses or other attached units in 2021 (13.6% of all units):
Most popular occupations of males: computer and mathematical occupations (17.3%); management occupations (except farmers) (17.0%); sales and office occupations (16.4%); service occupations (9.7%); construction, extraction, and maintenance occupations (9.6%); education, training, and library occupations (6.7%); architecture and engineering occupations (4.9%)
Most popular occupations of females: management occupations (except farmers) (23.0%); sales and office occupations (14.3%); healthcare practitioners and technical occupations (13.8%); service occupations (10.4%); education, training, and library occupations (10.0%); business and financial operations occupations (9.3%); architecture and engineering occupations (5.6%)
Roads and streets: Mazzone Dr; Crossmont Cir; Cross Springs Dr; Crossview Cir; Crossview Ct; Crossmont Ct; Crosspoint Ct; Cross Springs Ct; Crossfield Ct; Almaden Rd; Crosswind Ct; Crossbow Ct.
Other features: Alamitos Crk; Stream; Alamitos.
Almaden Hills Estates neighborhood detailed profile
Area: 0.097 square miles
Population: 43
Population density:
| Almaden Hills Estates: | 444 people per square mile |
| San Jose: | 5,625 people per square mile |
Median household income in 2021:
| Almaden Hills Estates: | $167,243 |
| San Jose: | $126,377 |
Median rent in in 2021:
| Almaden Hills Estates: | $1,529 |
| San Jose: | $2,001 |
Male vs Females
| Males: | 18 |
| Females: | 25 |
Median age
| Males: | 50.9 years |
| Females: | 49.6 years |
Housing prices:
Average estimated value of detached houses in 2021 (31.8% of all units):
| Almaden Hills Estates: | $1,645,694 |
| San Jose: | $1,403,256 |
Average estimated value of townhouses or other attached units in 2021 (13.6% of all units):
| This neighborhood: | $707,354 |
| city: | $892,629 |
Most popular occupations of males: computer and mathematical occupations (17.3%); management occupations (except farmers) (17.0%); sales and office occupations (16.4%); service occupations (9.7%); construction, extraction, and maintenance occupations (9.6%); education, training, and library occupations (6.7%); architecture and engineering occupations (4.9%)
Most popular occupations of females: management occupations (except farmers) (23.0%); sales and office occupations (14.3%); healthcare practitioners and technical occupations (13.8%); service occupations (10.4%); education, training, and library occupations (10.0%); business and financial operations occupations (9.3%); architecture and engineering occupations (5.6%)
Roads and streets: Mazzone Dr; Crossmont Cir; Cross Springs Dr; Crossview Cir; Crossview Ct; Crossmont Ct; Crosspoint Ct; Cross Springs Ct; Crossfield Ct; Almaden Rd; Crosswind Ct; Crossbow Ct.
Other features: Alamitos Crk; Stream; Alamitos.
Almaden Hills Estates neighborhood detailed profile
Almaden Lake neighborhood in San Jose statistics: (Find on map)
Area: 0.089 square miles
Population: 38
Population density:
Median household income in 2021:
Median rent in in 2021:
Male vs Females
Median age
Housing prices:
Average estimated value of detached houses in 2021 (31.6% of all units):
Average estimated value of townhouses or other attached units in 2021 (15.8% of all units):
Most popular occupations of males: computer and mathematical occupations (17.9%); management occupations (except farmers) (17.3%); sales and office occupations (16.8%); service occupations (9.8%); construction, extraction, and maintenance occupations (9.8%); education, training, and library occupations (6.8%); life, physical, and social science occupations (4.5%)
Most popular occupations of females: management occupations (except farmers) (23.1%); healthcare practitioners and technical occupations (14.2%); sales and office occupations (13.7%); service occupations (10.7%); education, training, and library occupations (10.1%); business and financial operations occupations (9.1%); architecture and engineering occupations (5.7%)
Roads and streets: la Terrace Cir; Windsor Hills Cir; Owens Lake Dr; Coleman Rd; Lake Almanor Dr; Lake McClure Dr; Furlong Dr; Lake Crowley Pl; Eastman Lake Dr; Bridgeport Lake Way (Bridgeport Lake Dr); Lake Isabella Way; Goose Lake Ct; Lake Hennesy Ct; Terrace Lake Dr; Mono Lake Ct; Lake Tahoe Ct; Windsor Hills Dr; Miracle Mountain Dr; Lake Shasta Ct; Buck Lake Ct (Bucks Lake Ct).
Almaden Lake neighborhood detailed profile
Area: 0.089 square miles
Population: 38
Population density:
| Almaden Lake: | 429 people per square mile |
| San Jose: | 5,625 people per square mile |
Median household income in 2021:
| Almaden Lake: | $105,625 |
| San Jose: | $126,377 |
Median rent in in 2021:
| Almaden Lake: | $1,449 |
| San Jose: | $2,001 |
Male vs Females
| Males: | 15 |
| Females: | 22 |
Median age
| Males: | 47.9 years |
| Females: | 42.9 years |
Housing prices:
Average estimated value of detached houses in 2021 (31.6% of all units):
| Almaden Lake: | $1,668,392 |
| San Jose: | $1,403,256 |
Average estimated value of townhouses or other attached units in 2021 (15.8% of all units):
| This neighborhood: | $676,398 |
| city: | $892,629 |
Most popular occupations of males: computer and mathematical occupations (17.9%); management occupations (except farmers) (17.3%); sales and office occupations (16.8%); service occupations (9.8%); construction, extraction, and maintenance occupations (9.8%); education, training, and library occupations (6.8%); life, physical, and social science occupations (4.5%)
Most popular occupations of females: management occupations (except farmers) (23.1%); healthcare practitioners and technical occupations (14.2%); sales and office occupations (13.7%); service occupations (10.7%); education, training, and library occupations (10.1%); business and financial operations occupations (9.1%); architecture and engineering occupations (5.7%)
Roads and streets: la Terrace Cir; Windsor Hills Cir; Owens Lake Dr; Coleman Rd; Lake Almanor Dr; Lake McClure Dr; Furlong Dr; Lake Crowley Pl; Eastman Lake Dr; Bridgeport Lake Way (Bridgeport Lake Dr); Lake Isabella Way; Goose Lake Ct; Lake Hennesy Ct; Terrace Lake Dr; Mono Lake Ct; Lake Tahoe Ct; Windsor Hills Dr; Miracle Mountain Dr; Lake Shasta Ct; Buck Lake Ct (Bucks Lake Ct).
Almaden Lake neighborhood detailed profile
Almaden Meadows neighborhood in San Jose statistics: (Find on map)
Area: 0.582 square miles
Population: 3,427
Population density:
Median household income in 2021:
Median rent in in 2021:
Male vs Females
Median age
Housing prices:
Average estimated value of detached houses in 2021 (99.5% of all units):
Average estimated value of townhouses or other attached units in 2021 (1.3% of all units):
Most popular occupations of males: sales and office occupations (28.5%); management occupations (except farmers) (22.9%); computer and mathematical occupations (14.0%); architecture and engineering occupations (10.7%); business and financial operations occupations (10.3%); legal occupations (4.2%); education, training, and library occupations (3.3%)
Most popular occupations of females: sales and office occupations (24.0%); healthcare practitioners and technical occupations (13.8%); education, training, and library occupations (13.0%); service occupations (9.6%); business and financial operations occupations (9.5%); arts, design, entertainment, sports, and media occupations (9.3%); management occupations (except farmers) (8.1%)
Roads and streets: Redmond Ave; Paso Los Cerritos; Meridian Ave; Burchell Ave; Cerro Verde; Camino Robles Way; Medallion Dr; Via de Los Reyes; Coleman Rd; Franciscan Way; Via de Adrianna; Crimson Dr; Via del Los Grande; Oakglen Way; Montelegre Dr; Kinsport Ln; Cll Bonita; Cll del Conejo; Cll Esperanza; Via de Las Abejas; Almaden Valley Dr; Fleet St; Weimar Ave; Montoro Dr; Meander Dr; Nesbit Ct; Athenour Ct; The Strand Ave; Kew Gardens Ct; Monteverde Dr; Corte de Rosa; Beattie Ct; Torington Ct; Menorca Ct; Elsman Ct; Larabee Ct; Texas Ct; Corte de la Reina; Colorview Ct; Cll de la Paz; Cll Alegre; Sentinel St; Burchell Ct; Crump Ct; Manitou Ct; Franciscan Ct; Camino Robles Ct; Tweedholm Ct; Corte Bonita; Vilmar Ave; Montoro Ct; Dash Ct; Corte del Conejo; Skyfarm Ct; Majorca Ct; Cuernavaca Ct; Glowing Ct; Dot Ct; Bluering Ct; Blackbird Ct; Yellowbird Ct; de Palma Dr.
Almaden Meadows neighborhood detailed profile
Area: 0.582 square miles
Population: 3,427
Population density:
| Almaden Meadows: | 5,891 people per square mile |
| San Jose: | 5,625 people per square mile |
Median household income in 2021:
| Almaden Meadows: | $221,673 |
| San Jose: | $126,377 |
Median rent in in 2021:
| Almaden Meadows: | $3,501 |
| San Jose: | $2,001 |
Male vs Females
| Males: | 1,788 |
| Females: | 1,638 |
Median age
| Males: | 45.0 years |
| Females: | 48.1 years |
Housing prices:
Average estimated value of detached houses in 2021 (99.5% of all units):
| Almaden Meadows: | $1,441,189 |
| San Jose: | $1,403,256 |
Average estimated value of townhouses or other attached units in 2021 (1.3% of all units):
| This neighborhood: | $1,227,754 |
| city: | $892,629 |
Most popular occupations of males: sales and office occupations (28.5%); management occupations (except farmers) (22.9%); computer and mathematical occupations (14.0%); architecture and engineering occupations (10.7%); business and financial operations occupations (10.3%); legal occupations (4.2%); education, training, and library occupations (3.3%)
Most popular occupations of females: sales and office occupations (24.0%); healthcare practitioners and technical occupations (13.8%); education, training, and library occupations (13.0%); service occupations (9.6%); business and financial operations occupations (9.5%); arts, design, entertainment, sports, and media occupations (9.3%); management occupations (except farmers) (8.1%)
Roads and streets: Redmond Ave; Paso Los Cerritos; Meridian Ave; Burchell Ave; Cerro Verde; Camino Robles Way; Medallion Dr; Via de Los Reyes; Coleman Rd; Franciscan Way; Via de Adrianna; Crimson Dr; Via del Los Grande; Oakglen Way; Montelegre Dr; Kinsport Ln; Cll Bonita; Cll del Conejo; Cll Esperanza; Via de Las Abejas; Almaden Valley Dr; Fleet St; Weimar Ave; Montoro Dr; Meander Dr; Nesbit Ct; Athenour Ct; The Strand Ave; Kew Gardens Ct; Monteverde Dr; Corte de Rosa; Beattie Ct; Torington Ct; Menorca Ct; Elsman Ct; Larabee Ct; Texas Ct; Corte de la Reina; Colorview Ct; Cll de la Paz; Cll Alegre; Sentinel St; Burchell Ct; Crump Ct; Manitou Ct; Franciscan Ct; Camino Robles Ct; Tweedholm Ct; Corte Bonita; Vilmar Ave; Montoro Ct; Dash Ct; Corte del Conejo; Skyfarm Ct; Majorca Ct; Cuernavaca Ct; Glowing Ct; Dot Ct; Bluering Ct; Blackbird Ct; Yellowbird Ct; de Palma Dr.
Almaden Meadows neighborhood detailed profile
Almaden Springs neighborhood in San Jose statistics: (Find on map)
Area: 0.161 square miles
Roads and streets: Scarsdale Pl; Foxhurst Way; Queensbridge Way; Spring Hill Way; Calcaterra Dr; Via Brezzo; Bridge Ct; Sterling Gate Dr; Copper Peak Ln; Saint George Ln; Queensbridge Ct; Carnforth Ct; Kendall Ct; Lindsay Creek Ln; Fox Meadow Ct; Huntsfield Ct; Sterling Gate Ct; Stoesser Ct; Scarsdale Ct; Emma Ct; Scarsdale Way.
Almaden Springs neighborhood detailed profile
Almaden Winery neighborhood in San Jose statistics: (Find on map)
Area: 0.101 square miles
Roads and streets: Chambertin Dr; Touraine Dr; Bergerac Dr; Le Fevre Dr; Mireille Dr; Bordelais Dr; Treviso Ave; Le Franc Dr; Chaumont Dr; Bouchard Dr; Domaine Dr; Brionne Dr; Bergamo Ct; Ravenna Ct; Bellagio Dr; Treviso Dr.
Almaden Winery neighborhood detailed profile
Area: 0.101 square miles
Roads and streets: Chambertin Dr; Touraine Dr; Bergerac Dr; Le Fevre Dr; Mireille Dr; Bordelais Dr; Treviso Ave; Le Franc Dr; Chaumont Dr; Bouchard Dr; Domaine Dr; Brionne Dr; Bergamo Ct; Ravenna Ct; Bellagio Dr; Treviso Dr.
Almaden Winery neighborhood detailed profile
Alum Rock Avenue neighborhood in San Jose statistics: (Find on map)
Area: 0.144 square miles
Population: 1,470
Population density:
Median household income in 2021:
Median rent in in 2021:
Male vs Females
Median age
Most popular occupations of males: service occupations (17.1%); construction, extraction, and maintenance occupations (16.4%); sales and office occupations (12.9%); business and financial operations occupations (9.8%); transportation occupations (7.6%); arts, design, entertainment, sports, and media occupations (7.3%); production occupations (6.8%)
Most popular occupations of females: sales and office occupations (43.5%); service occupations (27.6%); management occupations (except farmers) (12.1%); material moving occupations (3.6%); education, training, and library occupations (3.5%); business and financial operations occupations (3.2%); production occupations (2.7%)
Highways in this neighborhood: State Hwy 130 (Alum Rock Ave).
Roads and streets: Pala Ave; N Capitol Ave.
Other features: Silver Crk.
Alum Rock Avenue neighborhood detailed profile
Area: 0.144 square miles
Population: 1,470
Population density:
| Alum Rock Avenue: | 10,218 people per square mile |
| San Jose: | 5,625 people per square mile |
Median household income in 2021:
| Alum Rock Avenue: | $173,006 |
| San Jose: | $126,377 |
Median rent in in 2021:
| Alum Rock Avenue: | $4,665 |
| San Jose: | $2,001 |
Male vs Females
| Males: | 785 |
| Females: | 684 |
Median age
| Males: | 86.3 years |
| Females: | 91.7 years |
Most popular occupations of males: service occupations (17.1%); construction, extraction, and maintenance occupations (16.4%); sales and office occupations (12.9%); business and financial operations occupations (9.8%); transportation occupations (7.6%); arts, design, entertainment, sports, and media occupations (7.3%); production occupations (6.8%)
Most popular occupations of females: sales and office occupations (43.5%); service occupations (27.6%); management occupations (except farmers) (12.1%); material moving occupations (3.6%); education, training, and library occupations (3.5%); business and financial operations occupations (3.2%); production occupations (2.7%)
Highways in this neighborhood: State Hwy 130 (Alum Rock Ave).
Roads and streets: Pala Ave; N Capitol Ave.
Other features: Silver Crk.
Alum Rock Avenue neighborhood detailed profile
Alvin neighborhood in San Jose statistics: (Find on map)
Area: 0.121 square miles
Population: 1,501
Population density:
Median household income in 2021:
Median rent in in 2021:
Male vs Females
Median age
Housing prices:
Average estimated value of detached houses in 2021 (14.7% of all units):
Average estimated value of mobile home in 2021 (5.4% of all units):
Most popular occupations of males: service occupations (49.2%); production occupations (18.2%); construction, extraction, and maintenance occupations (6.1%); computer and mathematical occupations (5.0%); architecture and engineering occupations (3.9%); sales and office occupations (2.8%); material moving occupations (2.7%)
Most popular occupations of females: service occupations (64.0%); sales and office occupations (24.1%); education, training, and library occupations (4.2%); production occupations (3.7%); legal occupations (2.6%); transportation occupations (1.7%); healthcare practitioners and technical occupations (1.2%)
Roads and streets: Alvin Ave; S King Rd; Tully Rd; Burdette Dr; Flanigan Dr.
Alvin neighborhood detailed profile
Area: 0.121 square miles
Population: 1,501
Population density:
| Alvin (Burdette): | 12,440 people per square mile |
| San Jose: | 5,625 people per square mile |
Median household income in 2021:
| Alvin (Burdette): | $59,685 |
| San Jose: | $126,377 |
Median rent in in 2021:
| Alvin (Burdette): | $1,846 |
| San Jose: | $2,001 |
Male vs Females
| Males: | 661 |
| Females: | 840 |
Median age
| Males: | 37.9 years |
| Females: | 45.1 years |
Housing prices:
Average estimated value of detached houses in 2021 (14.7% of all units):
| Alvin (Burdette): | $743,891 |
| San Jose: | $1,403,256 |
Average estimated value of mobile home in 2021 (5.4% of all units):
| Alvin (Burdette): | $198,700 |
| San Jose: | $240,963 |
Most popular occupations of males: service occupations (49.2%); production occupations (18.2%); construction, extraction, and maintenance occupations (6.1%); computer and mathematical occupations (5.0%); architecture and engineering occupations (3.9%); sales and office occupations (2.8%); material moving occupations (2.7%)
Most popular occupations of females: service occupations (64.0%); sales and office occupations (24.1%); education, training, and library occupations (4.2%); production occupations (3.7%); legal occupations (2.6%); transportation occupations (1.7%); healthcare practitioners and technical occupations (1.2%)
Roads and streets: Alvin Ave; S King Rd; Tully Rd; Burdette Dr; Flanigan Dr.
Alvin neighborhood detailed profile
Anderson East neighborhood in San Jose statistics: (Find on map)
Area: 0.231 square miles
Population: 1,968
Population density:
Median household income in 2021:
Median rent in in 2021:
Male vs Females
Median age
Average estimated value of detached houses in 2021 (12.9% of all units):
Most popular occupations of males: sales and office occupations (15.7%); management occupations (except farmers) (15.1%); service occupations (15.0%); transportation occupations (10.2%); business and financial operations occupations (7.7%); arts, design, entertainment, sports, and media occupations (6.1%); construction, extraction, and maintenance occupations (5.6%)
Most popular occupations of females: service occupations (38.1%); sales and office occupations (25.3%); management occupations (except farmers) (10.5%); education, training, and library occupations (7.8%); transportation occupations (6.4%); life, physical, and social science occupations (3.6%); healthcare practitioners and technical occupations (1.9%)
Roads and streets: Payne Ave; Will Rogers Dr; Teale Ave; Barrymore Dr; Freed Ave; Ranchero Way; Oakmont Dr; Topaz Ave; Flora Ave; Roewill Dr; Ranchero Dr; Rhoda Dr; Leslie Dr; Rosalia Ave; San Tomas Aquino Rd; Garbo Way; Piper Dr; Mitzi Dr.
Anderson East neighborhood detailed profile
Area: 0.231 square miles
Population: 1,968
Population density:
| Anderson East: | 8,536 people per square mile |
| San Jose: | 5,625 people per square mile |
Median household income in 2021:
| Anderson East: | $114,980 |
| San Jose: | $126,377 |
Median rent in in 2021:
| Anderson East: | $1,904 |
| San Jose: | $2,001 |
Male vs Females
| Males: | 920 |
| Females: | 1,048 |
Median age
| Males: | 38.1 years |
| Females: | 37.0 years |
Average estimated value of detached houses in 2021 (12.9% of all units):
| Anderson East: | $756,056 |
| San Jose: | $1,403,256 |
Most popular occupations of males: sales and office occupations (15.7%); management occupations (except farmers) (15.1%); service occupations (15.0%); transportation occupations (10.2%); business and financial operations occupations (7.7%); arts, design, entertainment, sports, and media occupations (6.1%); construction, extraction, and maintenance occupations (5.6%)
Most popular occupations of females: service occupations (38.1%); sales and office occupations (25.3%); management occupations (except farmers) (10.5%); education, training, and library occupations (7.8%); transportation occupations (6.4%); life, physical, and social science occupations (3.6%); healthcare practitioners and technical occupations (1.9%)
Roads and streets: Payne Ave; Will Rogers Dr; Teale Ave; Barrymore Dr; Freed Ave; Ranchero Way; Oakmont Dr; Topaz Ave; Flora Ave; Roewill Dr; Ranchero Dr; Rhoda Dr; Leslie Dr; Rosalia Ave; San Tomas Aquino Rd; Garbo Way; Piper Dr; Mitzi Dr.
Anderson East neighborhood detailed profile
Anderson West neighborhood in San Jose statistics: (Find on map)
Area: 0.325 square miles
Population: 3,739
Population density:
Median household income in 2021:
Median rent in in 2021:
Male vs Females
Median age
Housing prices:
Average estimated value of detached houses in 2021 (97.4% of all units):
Average estimated value of townhouses or other attached units in 2021 (2.4% of all units):
Average estimated '21 value of housing units in 3-to-4-unit structures (32.6% of all units):
Average estimated '21 value of housing units in 5-or-more-unit structures (19.6% of all units):
Average estimated value of mobile home in 2021 (23.5% of all units):
Most popular occupations of males: service occupations (19.8%); transportation occupations (15.2%); computer and mathematical occupations (15.0%); production occupations (9.4%); construction, extraction, and maintenance occupations (8.0%); management occupations (except farmers) (5.3%); material moving occupations (5.3%)
Most popular occupations of females: sales and office occupations (23.9%); education, training, and library occupations (19.9%); service occupations (17.8%); healthcare practitioners and technical occupations (12.6%); management occupations (except farmers) (10.3%); computer and mathematical occupations (5.1%); architecture and engineering occupations (4.2%)
Limited-access highways (interstate or state) in this neighborhood: State Hwy 85.
Roads and streets: Herlong Ave; Calpine Dr; Beswick Dr; Wyandotte Dr; Bangor Ave; Manton Dr; Venado Way; Cohasset Way; Rohn Way; Noyo Dr; Benbow Ave; Falon Way; Ettersberg Dr; Embee Dr; Chris Dr; Pentz Way; Copco Ln; Venado Ct; Belden Dr; Lean Way (Herlong Ave).
Anderson West neighborhood detailed profile
Area: 0.325 square miles
Population: 3,739
Population density:
| Anderson West: | 11,500 people per square mile |
| San Jose: | 5,625 people per square mile |
Median household income in 2021:
| Anderson West: | $109,820 |
| San Jose: | $126,377 |
Median rent in in 2021:
| Anderson West: | $3,474 |
| San Jose: | $2,001 |
Male vs Females
| Males: | 1,819 |
| Females: | 1,919 |
Median age
| Males: | 33.8 years |
| Females: | 38.2 years |
Housing prices:
Average estimated value of detached houses in 2021 (97.4% of all units):
| Anderson West: | $911,025 |
| San Jose: | $1,403,256 |
Average estimated value of townhouses or other attached units in 2021 (2.4% of all units):
| This neighborhood: | $575,122 |
| city: | $892,629 |
Average estimated '21 value of housing units in 3-to-4-unit structures (32.6% of all units):
| Anderson West: | $480,000 |
| city: | $680,453 |
Average estimated '21 value of housing units in 5-or-more-unit structures (19.6% of all units):
| Anderson West: | $466,756 |
| San Jose: | $688,625 |
Average estimated value of mobile home in 2021 (23.5% of all units):
| Anderson West: | $199,171 |
| San Jose: | $240,963 |
Most popular occupations of males: service occupations (19.8%); transportation occupations (15.2%); computer and mathematical occupations (15.0%); production occupations (9.4%); construction, extraction, and maintenance occupations (8.0%); management occupations (except farmers) (5.3%); material moving occupations (5.3%)
Most popular occupations of females: sales and office occupations (23.9%); education, training, and library occupations (19.9%); service occupations (17.8%); healthcare practitioners and technical occupations (12.6%); management occupations (except farmers) (10.3%); computer and mathematical occupations (5.1%); architecture and engineering occupations (4.2%)
Limited-access highways (interstate or state) in this neighborhood: State Hwy 85.
Roads and streets: Herlong Ave; Calpine Dr; Beswick Dr; Wyandotte Dr; Bangor Ave; Manton Dr; Venado Way; Cohasset Way; Rohn Way; Noyo Dr; Benbow Ave; Falon Way; Ettersberg Dr; Embee Dr; Chris Dr; Pentz Way; Copco Ln; Venado Ct; Belden Dr; Lean Way (Herlong Ave).
Anderson West neighborhood detailed profile
Ann Darling neighborhood in San Jose statistics: (Find on map)
Area: 0.095 square miles
Population: 430
Population density:
Median household income in 2021:
Median rent in in 2021:
Male vs Females
Median age
Housing prices:
Average estimated value of detached houses in 2021 (41.4% of all units):
Average estimated value of townhouses or other attached units in 2021 (20.7% of all units):
Average estimated '21 value of housing units in 5-or-more-unit structures (3.4% of all units):
Most popular occupations of males: transportation occupations (31.6%); construction, extraction, and maintenance occupations (17.4%); service occupations (13.6%); management occupations (except farmers) (6.6%); computer and mathematical occupations (6.4%); arts, design, entertainment, sports, and media occupations (5.3%); material moving occupations (4.9%)
Most popular occupations of females: sales and office occupations (24.9%); service occupations (21.6%); production occupations (17.9%); business and financial operations occupations (11.4%); healthcare practitioners and technical occupations (6.3%); education, training, and library occupations (5.5%); computer and mathematical occupations (3.3%)
Roads and streets: Melody Ln; Berrywood Dr; Marburg Way; Royce Dr; N 33rd St; N King Rd; Ann Darling Dr.
Other features: Silver Crk.
Ann Darling neighborhood detailed profile
Area: 0.095 square miles
Population: 430
Population density:
| Ann Darling: | 4,511 people per square mile |
| San Jose: | 5,625 people per square mile |
Median household income in 2021:
| Ann Darling: | $64,782 |
| San Jose: | $126,377 |
Median rent in in 2021:
| Ann Darling: | $1,307 |
| San Jose: | $2,001 |
Male vs Females
| Males: | 237 |
| Females: | 193 |
Median age
| Males: | 36.7 years |
| Females: | 37.5 years |
Housing prices:
Average estimated value of detached houses in 2021 (41.4% of all units):
| Ann Darling: | $1,036,444 |
| San Jose: | $1,403,256 |
Average estimated value of townhouses or other attached units in 2021 (20.7% of all units):
| This neighborhood: | $639,511 |
| city: | $892,629 |
Average estimated '21 value of housing units in 5-or-more-unit structures (3.4% of all units):
| Ann Darling: | $307,992 |
| San Jose: | $688,625 |
Most popular occupations of males: transportation occupations (31.6%); construction, extraction, and maintenance occupations (17.4%); service occupations (13.6%); management occupations (except farmers) (6.6%); computer and mathematical occupations (6.4%); arts, design, entertainment, sports, and media occupations (5.3%); material moving occupations (4.9%)
Most popular occupations of females: sales and office occupations (24.9%); service occupations (21.6%); production occupations (17.9%); business and financial operations occupations (11.4%); healthcare practitioners and technical occupations (6.3%); education, training, and library occupations (5.5%); computer and mathematical occupations (3.3%)
Roads and streets: Melody Ln; Berrywood Dr; Marburg Way; Royce Dr; N 33rd St; N King Rd; Ann Darling Dr.
Other features: Silver Crk.
Ann Darling neighborhood detailed profile
Arbuckle neighborhood in San Jose statistics: (Find on map)
Area: 0.089 square miles
Population: 1,291
Population density:
Median household income in 2021:
Median rent in in 2021:
Male vs Females
Median age
Average estimated value of detached houses in 2021 (51.3% of all units):
Most popular occupations of males: service occupations (37.4%); construction, extraction, and maintenance occupations (23.5%); production occupations (10.2%); sales and office occupations (9.9%); material moving occupations (3.4%); architecture and engineering occupations (2.7%); transportation occupations (2.7%)
Most popular occupations of females: service occupations (53.6%); sales and office occupations (19.6%); production occupations (5.7%); business and financial operations occupations (4.4%); community and social services occupations (4.2%); material moving occupations (3.7%); healthcare practitioners and technical occupations (2.2%)
Limited-access highways (interstate or state) in this neighborhood: Sinclair Fwy (I- 680).
Roads and streets: Mc Creery Ave; Lido Way; Chaucer Dr; Turley Dr; Tomlinson Ln; Thackeray Ln; Tennyson Ln; Mc Creery Ct; S Sunset Ave; Luke Ct; Turley Ct.
Arbuckle neighborhood detailed profile
Area: 0.089 square miles
Population: 1,291
Population density:
| Arbuckle: | 14,522 people per square mile |
| San Jose: | 5,625 people per square mile |
Median household income in 2021:
| Arbuckle: | $77,454 |
| San Jose: | $126,377 |
Median rent in in 2021:
| Arbuckle: | $1,638 |
| San Jose: | $2,001 |
Male vs Females
| Males: | 694 |
| Females: | 596 |
Median age
| Males: | 35.9 years |
| Females: | 34.9 years |
Average estimated value of detached houses in 2021 (51.3% of all units):
| Arbuckle: | $657,730 |
| San Jose: | $1,403,256 |
Most popular occupations of males: service occupations (37.4%); construction, extraction, and maintenance occupations (23.5%); production occupations (10.2%); sales and office occupations (9.9%); material moving occupations (3.4%); architecture and engineering occupations (2.7%); transportation occupations (2.7%)
Most popular occupations of females: service occupations (53.6%); sales and office occupations (19.6%); production occupations (5.7%); business and financial operations occupations (4.4%); community and social services occupations (4.2%); material moving occupations (3.7%); healthcare practitioners and technical occupations (2.2%)
Limited-access highways (interstate or state) in this neighborhood: Sinclair Fwy (I- 680).
Roads and streets: Mc Creery Ave; Lido Way; Chaucer Dr; Turley Dr; Tomlinson Ln; Thackeray Ln; Tennyson Ln; Mc Creery Ct; S Sunset Ave; Luke Ct; Turley Ct.
Arbuckle neighborhood detailed profile
Arctic Sue neighborhood in San Jose statistics: (Find on map)
Area: 0.040 square miles
Population: 400
Population density:
Median household income in 2021:
Median rent in in 2021:
Male vs Females
Median age
Most popular occupations of males: production occupations (24.8%); service occupations (11.6%); architecture and engineering occupations (10.1%); construction, extraction, and maintenance occupations (10.0%); transportation occupations (6.6%); education, training, and library occupations (5.5%); healthcare practitioners and technical occupations (4.9%)
Most popular occupations of females: service occupations (32.7%); sales and office occupations (21.6%); production occupations (13.8%); healthcare practitioners and technical occupations (8.8%); management occupations (except farmers) (7.8%); education, training, and library occupations (5.0%); life, physical, and social science occupations (3.5%)
Roads and streets: Baltic Way; Feldspar Dr; Senter Rd; Sue Ave; Arctic Ave; Salmon Dr; Sheridan Pl.
Arctic Sue neighborhood detailed profile
Area: 0.040 square miles
Population: 400
Population density:
| Arctic Sue: | 10,003 people per square mile |
| San Jose: | 5,625 people per square mile |
Median household income in 2021:
| Arctic Sue: | $81,020 |
| San Jose: | $126,377 |
Median rent in in 2021:
| Arctic Sue: | $1,425 |
| San Jose: | $2,001 |
Male vs Females
| Males: | 202 |
| Females: | 198 |
Median age
| Males: | 36.6 years |
| Females: | 36.3 years |
Most popular occupations of males: production occupations (24.8%); service occupations (11.6%); architecture and engineering occupations (10.1%); construction, extraction, and maintenance occupations (10.0%); transportation occupations (6.6%); education, training, and library occupations (5.5%); healthcare practitioners and technical occupations (4.9%)
Most popular occupations of females: service occupations (32.7%); sales and office occupations (21.6%); production occupations (13.8%); healthcare practitioners and technical occupations (8.8%); management occupations (except farmers) (7.8%); education, training, and library occupations (5.0%); life, physical, and social science occupations (3.5%)
Roads and streets: Baltic Way; Feldspar Dr; Senter Rd; Sue Ave; Arctic Ave; Salmon Dr; Sheridan Pl.
Arctic Sue neighborhood detailed profile
Ashbridge neighborhood in San Jose statistics: (Find on map)
Area: 0.128 square miles
Roads and streets: Glengarry Dr; Edenwood Dr; Hurstglen Way; Shiangzone Ct; Glenstone Ct; Ashridge Ln; Glengrove Way; Ashridge Way; Hurstwood Ct; Eaglehurst Dr; Lorwick Way; Chenlen Ct; Carryduff Way; Linton Ct; Edenwood Ct.
Ashbridge neighborhood detailed profile
Area: 0.128 square miles
Roads and streets: Glengarry Dr; Edenwood Dr; Hurstglen Way; Shiangzone Ct; Glenstone Ct; Ashridge Ln; Glengrove Way; Ashridge Way; Hurstwood Ct; Eaglehurst Dr; Lorwick Way; Chenlen Ct; Carryduff Way; Linton Ct; Edenwood Ct.
Ashbridge neighborhood detailed profile
Atlanta neighborhood in San Jose statistics: (Find on map)
Area: 0.180 square miles
Population: 2,068
Population density:
Median household income in 2021:
Median rent in in 2021:
Male vs Females
Median age
Housing prices:
Average estimated value of detached houses in 2021 (80.0% of all units):
Average estimated value of townhouses or other attached units in 2021 (1.8% of all units):
Most popular occupations of males: management occupations (except farmers) (18.1%); sales and office occupations (15.2%); architecture and engineering occupations (12.4%); arts, design, entertainment, sports, and media occupations (8.6%); computer and mathematical occupations (7.9%); business and financial operations occupations (6.7%); life, physical, and social science occupations (6.0%)
Most popular occupations of females: sales and office occupations (26.5%); management occupations (except farmers) (25.8%); healthcare practitioners and technical occupations (10.8%); service occupations (10.5%); business and financial operations occupations (5.6%); legal occupations (4.9%); material moving occupations (4.7%)
Roads and streets: Delmas Ave; Prevost St; Willow St; Atlanta Ave; Hull Ave; Spencer Ave; Fuller Ave; Marshall Ave; Snyder Ave; Warren Ave; Shepherd Ave; Willis Ave; Mills Ct.
Railroad features: Union Pacific RR.
Other features: Guadalupe Riv.
Atlanta neighborhood detailed profile
Area: 0.180 square miles
Population: 2,068
Population density:
| Atlanta (Bird): | 11,513 people per square mile |
| San Jose: | 5,625 people per square mile |
Median household income in 2021:
| Atlanta (Bird): | $154,551 |
| San Jose: | $126,377 |
Median rent in in 2021:
| Atlanta (Bird): | $2,288 |
| San Jose: | $2,001 |
Male vs Females
| Males: | 977 |
| Females: | 1,091 |
Median age
| Males: | 39.0 years |
| Females: | 38.0 years |
Housing prices:
Average estimated value of detached houses in 2021 (80.0% of all units):
| Atlanta (Bird): | $965,985 |
| San Jose: | $1,403,256 |
Average estimated value of townhouses or other attached units in 2021 (1.8% of all units):
| This neighborhood: | $912,195 |
| city: | $892,629 |
Most popular occupations of males: management occupations (except farmers) (18.1%); sales and office occupations (15.2%); architecture and engineering occupations (12.4%); arts, design, entertainment, sports, and media occupations (8.6%); computer and mathematical occupations (7.9%); business and financial operations occupations (6.7%); life, physical, and social science occupations (6.0%)
Most popular occupations of females: sales and office occupations (26.5%); management occupations (except farmers) (25.8%); healthcare practitioners and technical occupations (10.8%); service occupations (10.5%); business and financial operations occupations (5.6%); legal occupations (4.9%); material moving occupations (4.7%)
Roads and streets: Delmas Ave; Prevost St; Willow St; Atlanta Ave; Hull Ave; Spencer Ave; Fuller Ave; Marshall Ave; Snyder Ave; Warren Ave; Shepherd Ave; Willis Ave; Mills Ct.
Railroad features: Union Pacific RR.
Other features: Guadalupe Riv.
Atlanta neighborhood detailed profile
Autumn neighborhood in San Jose statistics: (Find on map)
Area: 0.045 square miles
Population: 259
Population density:
Median household income in 2021:
Median rent in in 2021:
Male vs Females
Median age
Most popular occupations of males: management occupations (except farmers) (29.9%); computer and mathematical occupations (21.0%); architecture and engineering occupations (13.7%); sales and office occupations (9.8%); business and financial operations occupations (6.4%); service occupations (5.2%); production occupations (2.7%)
Most popular occupations of females: management occupations (except farmers) (22.4%); sales and office occupations (14.4%); arts, design, entertainment, sports, and media occupations (12.5%); architecture and engineering occupations (8.8%); community and social services occupations (8.1%); healthcare practitioners and technical occupations (7.8%); service occupations (6.1%)
Roads and streets: W Julian St; W Saint John St; N Autumn St; Autom Ct (Autumn Ct); N River St; N Almaden Blvd; W St James St.
Other features: Guadalupe Riv.
Autumn neighborhood detailed profile
Area: 0.045 square miles
Population: 259
Population density:
| Autumn (Montgomery): | 5,702 people per square mile |
| San Jose: | 5,625 people per square mile |
Median household income in 2021:
| Autumn (Montgomery): | $178,983 |
| San Jose: | $126,377 |
Median rent in in 2021:
| Autumn (Montgomery): | $3,020 |
| San Jose: | $2,001 |
Male vs Females
| Males: | 155 |
| Females: | 104 |
Median age
| Males: | 35.7 years |
| Females: | 36.6 years |
Most popular occupations of males: management occupations (except farmers) (29.9%); computer and mathematical occupations (21.0%); architecture and engineering occupations (13.7%); sales and office occupations (9.8%); business and financial operations occupations (6.4%); service occupations (5.2%); production occupations (2.7%)
Most popular occupations of females: management occupations (except farmers) (22.4%); sales and office occupations (14.4%); arts, design, entertainment, sports, and media occupations (12.5%); architecture and engineering occupations (8.8%); community and social services occupations (8.1%); healthcare practitioners and technical occupations (7.8%); service occupations (6.1%)
Roads and streets: W Julian St; W Saint John St; N Autumn St; Autom Ct (Autumn Ct); N River St; N Almaden Blvd; W St James St.
Other features: Guadalupe Riv.
Autumn neighborhood detailed profile
Auzerais neighborhood in San Jose statistics: (Find on map)
Area: 0.058 square miles
Population: 290
Population density:
Median household income in 2021:
Median rent in in 2021:
Male vs Females
Median age
Most popular occupations of males: management occupations (except farmers) (40.9%); computer and mathematical occupations (20.3%); architecture and engineering occupations (12.8%); business and financial operations occupations (10.2%); sales and office occupations (7.1%); education, training, and library occupations (6.0%); construction, extraction, and maintenance occupations (5.9%)
Most popular occupations of females: computer and mathematical occupations (25.7%); education, training, and library occupations (14.0%); business and financial operations occupations (12.5%); management occupations (except farmers) (12.2%); sales and office occupations (12.2%); production occupations (10.5%); healthcare practitioners and technical occupations (9.8%)
Roads and streets: Auzerais Ave; Josefa St; Willis Ave; Minor Ave; Illinois Ave.
Auzerais neighborhood detailed profile
Area: 0.058 square miles
Population: 290
Population density:
| Auzerais (Josefa): | 4,986 people per square mile |
| San Jose: | 5,625 people per square mile |
Median household income in 2021:
| Auzerais (Josefa): | $173,459 |
| San Jose: | $126,377 |
Median rent in in 2021:
| Auzerais (Josefa): | $2,899 |
| San Jose: | $2,001 |
Male vs Females
| Males: | 156 |
| Females: | 134 |
Median age
| Males: | 35.3 years |
| Females: | 37.4 years |
Most popular occupations of males: management occupations (except farmers) (40.9%); computer and mathematical occupations (20.3%); architecture and engineering occupations (12.8%); business and financial operations occupations (10.2%); sales and office occupations (7.1%); education, training, and library occupations (6.0%); construction, extraction, and maintenance occupations (5.9%)
Most popular occupations of females: computer and mathematical occupations (25.7%); education, training, and library occupations (14.0%); business and financial operations occupations (12.5%); management occupations (except farmers) (12.2%); sales and office occupations (12.2%); production occupations (10.5%); healthcare practitioners and technical occupations (9.8%)
Roads and streets: Auzerais Ave; Josefa St; Willis Ave; Minor Ave; Illinois Ave.
Auzerais neighborhood detailed profile
Avenida Espana neighborhood in San Jose statistics: (Find on map)
Area: 0.216 square miles
Population: 1,520
Population density:
Median household income in 2021:
Median rent in in 2021:
Male vs Females
Median age
Housing prices:
Average estimated value of detached houses in 2021 (95.9% of all units):
Average estimated value of townhouses or other attached units in 2021 (2.5% of all units):
Most popular occupations of males: material moving occupations (26.3%); management occupations (except farmers) (21.5%); architecture and engineering occupations (10.6%); computer and mathematical occupations (9.8%); construction, extraction, and maintenance occupations (8.4%); sales and office occupations (5.7%); arts, design, entertainment, sports, and media occupations (5.1%)
Most popular occupations of females: healthcare practitioners and technical occupations (26.9%); service occupations (20.4%); management occupations (except farmers) (12.7%); sales and office occupations (12.5%); production occupations (8.1%); computer and mathematical occupations (6.2%); arts, design, entertainment, sports, and media occupations (5.5%)
Roads and streets: Bayliss Dr; Phinney Way; Santa Teresa Blvd; Ave Espana; N Creek Dr; Cheltenham Pl; Rawls Ct; Giddings Ct; French Ct; Keeler Ct; Briggs Ct; Granville Ct; Manley Ct; Manresa Ct; Phinney Pl; Ingram Ct; Turner Ct; Downs Dr; Kaybe Ct; Bayliss Pl; Aaron Pl; Rawls Way; Gresham Ct; Tolin Ct; Bayliss Ct; Aaron Ct; Drumm Ct; Drumm Pl; Moen Ct; Abra Ct.
Other features: Stream.
Avenida Espana neighborhood detailed profile
Area: 0.216 square miles
Population: 1,520
Population density:
| Avenida Espana: | 7,046 people per square mile |
| San Jose: | 5,625 people per square mile |
Median household income in 2021:
| Avenida Espana: | $147,715 |
| San Jose: | $126,377 |
Median rent in in 2021:
| Avenida Espana: | $2,932 |
| San Jose: | $2,001 |
Male vs Females
| Males: | 727 |
| Females: | 792 |
Median age
| Males: | 40.8 years |
| Females: | 36.2 years |
Housing prices:
Average estimated value of detached houses in 2021 (95.9% of all units):
| Avenida Espana: | $1,380,096 |
| San Jose: | $1,403,256 |
Average estimated value of townhouses or other attached units in 2021 (2.5% of all units):
| This neighborhood: | $694,723 |
| city: | $892,629 |
Most popular occupations of males: material moving occupations (26.3%); management occupations (except farmers) (21.5%); architecture and engineering occupations (10.6%); computer and mathematical occupations (9.8%); construction, extraction, and maintenance occupations (8.4%); sales and office occupations (5.7%); arts, design, entertainment, sports, and media occupations (5.1%)
Most popular occupations of females: healthcare practitioners and technical occupations (26.9%); service occupations (20.4%); management occupations (except farmers) (12.7%); sales and office occupations (12.5%); production occupations (8.1%); computer and mathematical occupations (6.2%); arts, design, entertainment, sports, and media occupations (5.5%)
Roads and streets: Bayliss Dr; Phinney Way; Santa Teresa Blvd; Ave Espana; N Creek Dr; Cheltenham Pl; Rawls Ct; Giddings Ct; French Ct; Keeler Ct; Briggs Ct; Granville Ct; Manley Ct; Manresa Ct; Phinney Pl; Ingram Ct; Turner Ct; Downs Dr; Kaybe Ct; Bayliss Pl; Aaron Pl; Rawls Way; Gresham Ct; Tolin Ct; Bayliss Ct; Aaron Ct; Drumm Ct; Drumm Pl; Moen Ct; Abra Ct.
Other features: Stream.
Avenida Espana neighborhood detailed profile
Avis neighborhood in San Jose statistics: (Find on map)
Area: 0.076 square miles
Roads and streets: Fruitdale Ave; Avis Dr; Twin Brook Dr; Cherry Ave; Delbert Way; Nantucket Ct; Twin Brook Ct; Cherry Ct.
Other features: Los Gatos Crk.
Avis neighborhood detailed profile
Area: 0.076 square miles
Roads and streets: Fruitdale Ave; Avis Dr; Twin Brook Dr; Cherry Ave; Delbert Way; Nantucket Ct; Twin Brook Ct; Cherry Ct.
Other features: Los Gatos Crk.
Avis neighborhood detailed profile
Banana Grove neighborhood in San Jose statistics: (Find on map)
Area: 0.090 square miles
Population: 1,313
Population density:
Median household income in 2021:
Median rent in in 2021:
Male vs Females
Median age
Housing prices:
Average estimated value of detached houses in 2021 (20.5% of all units):
Average estimated value of townhouses or other attached units in 2021 (35.7% of all units):
Average estimated '21 value of housing units in 3-to-4-unit structures (15.1% of all units):
Average estimated '21 value of housing units in 5-or-more-unit structures (12.7% of all units):
Most popular occupations of males: sales and office occupations (18.3%); service occupations (13.5%); business and financial operations occupations (12.9%); computer and mathematical occupations (10.3%); management occupations (except farmers) (10.2%); architecture and engineering occupations (7.9%); construction, extraction, and maintenance occupations (6.5%)
Most popular occupations of females: sales and office occupations (21.7%); service occupations (16.9%); management occupations (except farmers) (12.8%); healthcare practitioners and technical occupations (12.3%); community and social services occupations (7.0%); education, training, and library occupations (5.9%); production occupations (5.6%)
Roads and streets: Banana Grove Ln; Wong Dr; Jacana Ln; Cheris Dr; Birch Grove Ct; Larch Grove Ct; Beech Grove Ct; Wong Ct; Hansell Dr; Mayten Grove Ct; Dexter Dr; Macaw Pl; Macaw Ct; Plum Grove Ct; Jacana Ct; Macaw Ln; Macaw Way; Ostrich Ct; Wong Way; Bingham Ct; Cheris Ct; Banana Grove Ct; Centerhart Ct; Sigrid Way; Myna Ct.
Banana Grove neighborhood detailed profile
Area: 0.090 square miles
Population: 1,313
Population density:
| Banana Grove: | 14,620 people per square mile |
| San Jose: | 5,625 people per square mile |
Median household income in 2021:
| Banana Grove: | $132,341 |
| San Jose: | $126,377 |
Median rent in in 2021:
| Banana Grove: | $2,356 |
| San Jose: | $2,001 |
Male vs Females
| Males: | 581 |
| Females: | 731 |
Median age
| Males: | 37.6 years |
| Females: | 38.6 years |
Housing prices:
Average estimated value of detached houses in 2021 (20.5% of all units):
| Banana Grove: | $1,115,641 |
| San Jose: | $1,403,256 |
Average estimated value of townhouses or other attached units in 2021 (35.7% of all units):
| This neighborhood: | $586,197 |
| city: | $892,629 |
Average estimated '21 value of housing units in 3-to-4-unit structures (15.1% of all units):
| Banana Grove: | $489,998 |
| city: | $680,453 |
Average estimated '21 value of housing units in 5-or-more-unit structures (12.7% of all units):
| Banana Grove: | $535,124 |
| San Jose: | $688,625 |
Most popular occupations of males: sales and office occupations (18.3%); service occupations (13.5%); business and financial operations occupations (12.9%); computer and mathematical occupations (10.3%); management occupations (except farmers) (10.2%); architecture and engineering occupations (7.9%); construction, extraction, and maintenance occupations (6.5%)
Most popular occupations of females: sales and office occupations (21.7%); service occupations (16.9%); management occupations (except farmers) (12.8%); healthcare practitioners and technical occupations (12.3%); community and social services occupations (7.0%); education, training, and library occupations (5.9%); production occupations (5.6%)
Roads and streets: Banana Grove Ln; Wong Dr; Jacana Ln; Cheris Dr; Birch Grove Ct; Larch Grove Ct; Beech Grove Ct; Wong Ct; Hansell Dr; Mayten Grove Ct; Dexter Dr; Macaw Pl; Macaw Ct; Plum Grove Ct; Jacana Ct; Macaw Ln; Macaw Way; Ostrich Ct; Wong Way; Bingham Ct; Cheris Ct; Banana Grove Ct; Centerhart Ct; Sigrid Way; Myna Ct.
Banana Grove neighborhood detailed profile
Barbera neighborhood in San Jose statistics: (Find on map)
Area: 0.128 square miles
Roads and streets: Stokes St; de Rose Way; Lakeshire Ct; Huddersfield Ct; Willowhaven Dr; Arbor Park Dr; McKinley Ave; St Elizabeth Dr; Francisco Ave; Vanessa Dr; la Barbera Dr; N Loop Dr; Willowhaven Ct; Easington Way; Fitchville Ave; Portage Mountain Dr; O'Higgins Dr; Green Glen Ct; Longbranch Ct; Kirkside Ct; Caspian Sea Dr; Cooper River Dr; Rhodesia Way; Triborough Ln; Rhinecliff Way; Aurelian Ln; Arbor Vista Way; Sava River Dr (Cooper River Dr); Carnot Dr; Fairweather Ln; Coalbrook Dr; E Lake Dr; Lima Ct; Alonso Dr; Eastern Star Dr; Southwest Expy.
Barbera neighborhood detailed profile
Barletta neighborhood in San Jose statistics: (Find on map)
Area: 0.022 square miles
Roads and streets: Barletta Ln; Madeline Dr.
Barletta neighborhood detailed profile
Area: 0.022 square miles
Roads and streets: Barletta Ln; Madeline Dr.
Barletta neighborhood detailed profile
Bascom neighborhood in San Jose statistics: (Find on map)
Area: 0.231 square miles
Population: 1,656
Population density:
Median household income in 2021:
Median rent in in 2021:
Male vs Females
Median age
Average estimated value of detached houses in 2021 (69.5% of all units):
Most popular occupations of males: education, training, and library occupations (35.6%); sales and office occupations (13.1%); service occupations (10.8%); management occupations (except farmers) (9.2%); computer and mathematical occupations (8.4%); business and financial operations occupations (4.0%); architecture and engineering occupations (4.0%)
Most popular occupations of females: service occupations (29.2%); sales and office occupations (16.5%); education, training, and library occupations (13.6%); management occupations (except farmers) (11.6%); business and financial operations occupations (9.1%); healthcare practitioners and technical occupations (5.6%); legal occupations (4.7%)
Limited-access highways (interstate or state) in this neighborhood: I- 880 (Nimitz Fwy).
Roads and streets: N Bascom Ave (Bascom Ave); W Hedding St; Forest Ave; Emory St; Laurelei Ave; Bel Air Ave; Bellerose Dr; Mc Daniel Ave; Lynwood Ter; Clarmar Way; Oconnor Dr; Naglee Ave; University Ave; Mc Alister Dr; University Way; Revey Ave; Bailey Ave.
Bascom neighborhood detailed profile
Area: 0.231 square miles
Population: 1,656
Population density:
| Bascom (Forest): | 7,174 people per square mile |
| San Jose: | 5,625 people per square mile |
Median household income in 2021:
| Bascom (Forest): | $132,438 |
| San Jose: | $126,377 |
Median rent in in 2021:
| Bascom (Forest): | $1,668 |
| San Jose: | $2,001 |
Male vs Females
| Males: | 958 |
| Females: | 697 |
Median age
| Males: | 37.2 years |
| Females: | 41.6 years |
Average estimated value of detached houses in 2021 (69.5% of all units):
| Bascom (Forest): | $1,146,558 |
| San Jose: | $1,403,256 |
Most popular occupations of males: education, training, and library occupations (35.6%); sales and office occupations (13.1%); service occupations (10.8%); management occupations (except farmers) (9.2%); computer and mathematical occupations (8.4%); business and financial operations occupations (4.0%); architecture and engineering occupations (4.0%)
Most popular occupations of females: service occupations (29.2%); sales and office occupations (16.5%); education, training, and library occupations (13.6%); management occupations (except farmers) (11.6%); business and financial operations occupations (9.1%); healthcare practitioners and technical occupations (5.6%); legal occupations (4.7%)
Limited-access highways (interstate or state) in this neighborhood: I- 880 (Nimitz Fwy).
Roads and streets: N Bascom Ave (Bascom Ave); W Hedding St; Forest Ave; Emory St; Laurelei Ave; Bel Air Ave; Bellerose Dr; Mc Daniel Ave; Lynwood Ter; Clarmar Way; Oconnor Dr; Naglee Ave; University Ave; Mc Alister Dr; University Way; Revey Ave; Bailey Ave.
Bascom neighborhood detailed profile
Baton Rouge neighborhood in San Jose statistics: (Find on map)
Area: 0.081 square miles
Population: 437
Population density:
Median household income in 2021:
Median rent in in 2021:
Male vs Females
Median age
Housing prices:
Average estimated value of detached houses in 2021 (97.7% of all units):
Average estimated '21 value of housing units in 3-to-4-unit structures (27.9% of all units):
Average estimated '21 value of housing units in 5-or-more-unit structures (23.3% of all units):
Average estimated value of mobile home in 2021 (6.2% of all units):
Most popular occupations of males: service occupations (20.0%); architecture and engineering occupations (17.0%); construction, extraction, and maintenance occupations (15.2%); arts, design, entertainment, sports, and media occupations (8.0%); management occupations (except farmers) (6.4%); computer and mathematical occupations (5.3%); production occupations (5.2%)
Most popular occupations of females: service occupations (38.1%); sales and office occupations (13.3%); computer and mathematical occupations (12.9%); business and financial operations occupations (10.7%); management occupations (except farmers) (9.3%); community and social services occupations (5.9%); education, training, and library occupations (3.1%)
Roads and streets: Rainview Dr; Rainwell Dr; Rough and Ready Rd; Grandview Dr; Rainfield Dr; Baton Rouge Dr; Rainwell Ct; Des Moines Pl; Bonaccorso Pl; Harrisburg Pl.
Baton Rouge neighborhood detailed profile
Area: 0.081 square miles
Population: 437
Population density:
| Baton Rouge: | 5,426 people per square mile |
| San Jose: | 5,625 people per square mile |
Median household income in 2021:
| Baton Rouge: | $127,800 |
| San Jose: | $126,377 |
Median rent in in 2021:
| Baton Rouge: | $2,956 |
| San Jose: | $2,001 |
Male vs Females
| Males: | 223 |
| Females: | 214 |
Median age
| Males: | 39.7 years |
| Females: | 39.9 years |
Housing prices:
Average estimated value of detached houses in 2021 (97.7% of all units):
| Baton Rouge: | $863,333 |
| San Jose: | $1,403,256 |
Average estimated '21 value of housing units in 3-to-4-unit structures (27.9% of all units):
| Baton Rouge: | $362,979 |
| city: | $680,453 |
Average estimated '21 value of housing units in 5-or-more-unit structures (23.3% of all units):
| Baton Rouge: | $826,854 |
| San Jose: | $688,625 |
Average estimated value of mobile home in 2021 (6.2% of all units):
| Baton Rouge: | $253,459 |
| San Jose: | $240,963 |
Most popular occupations of males: service occupations (20.0%); architecture and engineering occupations (17.0%); construction, extraction, and maintenance occupations (15.2%); arts, design, entertainment, sports, and media occupations (8.0%); management occupations (except farmers) (6.4%); computer and mathematical occupations (5.3%); production occupations (5.2%)
Most popular occupations of females: service occupations (38.1%); sales and office occupations (13.3%); computer and mathematical occupations (12.9%); business and financial operations occupations (10.7%); management occupations (except farmers) (9.3%); community and social services occupations (5.9%); education, training, and library occupations (3.1%)
Roads and streets: Rainview Dr; Rainwell Dr; Rough and Ready Rd; Grandview Dr; Rainfield Dr; Baton Rouge Dr; Rainwell Ct; Des Moines Pl; Bonaccorso Pl; Harrisburg Pl.
Baton Rouge neighborhood detailed profile
Battaglia neighborhood in San Jose statistics: (Find on map)
Area: 0.090 square miles
Population: 593
Population density:
Median household income in 2021:
Median rent in in 2021:
Male vs Females
Median age
Most popular occupations of males: sales and office occupations (18.8%); production occupations (17.2%); service occupations (13.5%); construction, extraction, and maintenance occupations (11.7%); transportation occupations (9.3%); computer and mathematical occupations (6.6%); architecture and engineering occupations (6.4%)
Most popular occupations of females: service occupations (29.0%); sales and office occupations (23.7%); production occupations (9.1%); management occupations (except farmers) (8.6%); healthcare practitioners and technical occupations (7.6%); material moving occupations (7.1%); business and financial operations occupations (4.7%)
Roads and streets: N Capitol Ave; Battaglia Cir; Berryessa Rd; Old Abbey Pl; Old Manor Pl; Old Forge Ln; Niemeyer Ct; Old Crest Pl; Old Ridge Ct; Old Elm Ct; Old Gate Ct.
Battaglia neighborhood detailed profile
Area: 0.090 square miles
Population: 593
Population density:
| Battaglia: | 6,601 people per square mile |
| San Jose: | 5,625 people per square mile |
Median household income in 2021:
| Battaglia: | $146,448 |
| San Jose: | $126,377 |
Median rent in in 2021:
| Battaglia: | $2,431 |
| San Jose: | $2,001 |
Male vs Females
| Males: | 325 |
| Females: | 268 |
Median age
| Males: | 32.2 years |
| Females: | 37.7 years |
Most popular occupations of males: sales and office occupations (18.8%); production occupations (17.2%); service occupations (13.5%); construction, extraction, and maintenance occupations (11.7%); transportation occupations (9.3%); computer and mathematical occupations (6.6%); architecture and engineering occupations (6.4%)
Most popular occupations of females: service occupations (29.0%); sales and office occupations (23.7%); production occupations (9.1%); management occupations (except farmers) (8.6%); healthcare practitioners and technical occupations (7.6%); material moving occupations (7.1%); business and financial operations occupations (4.7%)
Roads and streets: N Capitol Ave; Battaglia Cir; Berryessa Rd; Old Abbey Pl; Old Manor Pl; Old Forge Ln; Niemeyer Ct; Old Crest Pl; Old Ridge Ct; Old Elm Ct; Old Gate Ct.
Battaglia neighborhood detailed profile
Berry Park neighborhood in San Jose statistics: (Find on map)
Area: 0.230 square miles
Population: 1,951
Population density:
Median household income in 2021:
Median rent in in 2021:
Male vs Females
Median age
Housing prices:
Average estimated value of detached houses in 2021 (54.0% of all units):
Average estimated value of townhouses or other attached units in 2021 (42.1% of all units):
Most popular occupations of males: management occupations (except farmers) (23.2%); education, training, and library occupations (18.5%); sales and office occupations (14.0%); production occupations (9.8%); construction, extraction, and maintenance occupations (8.9%); service occupations (6.6%); community and social services occupations (4.5%)
Most popular occupations of females: service occupations (28.9%); sales and office occupations (23.9%); healthcare practitioners and technical occupations (13.8%); business and financial operations occupations (13.3%); education, training, and library occupations (12.4%); arts, design, entertainment, sports, and media occupations (7.8%); construction, extraction, and maintenance occupations (1.1%)
Highways in this neighborhood: State Hwy 82 (Monterey Hwy).
Roads and streets: Park Sharon Dr; Park Paxton Pl; Skyway Dr; Stone Canyon Dr; Park Ellen Dr; Park Sommers Way; Pinon Pl; Shellbark Dr; Park Arcadia Dr; Sweetberry Ct; Pitch Pine Ct; Poinsettia Ct; River Ash Ct; Park Bolton Pl; Park Essex Pl; Park Belmont Pl; Park Oxford Pl; Park Groton Pl; Park Village Pl; Park Fletcher Pl; Park Milford Pl; Silverberry Dr; Park Warren Pl; Park Bristol Pl; Park Concord Pl; Sugar Maple Dr; Park Watson Pl; Park Dartmouth Pl; Illsley Ct; Corkwood Ct; Spoonwood Ct; Park Douglas Pl; Park Sutton Pl; Park Norton Pl; Smoke Tree Ct.
Railroad features: Union Pacific RR.
Berry Park neighborhood detailed profile
Area: 0.230 square miles
Population: 1,951
Population density:
| Berry Park: | 8,486 people per square mile |
| San Jose: | 5,625 people per square mile |
Median household income in 2021:
| Berry Park: | $137,851 |
| San Jose: | $126,377 |
Median rent in in 2021:
| Berry Park: | $3,196 |
| San Jose: | $2,001 |
Male vs Females
| Males: | 1,149 |
| Females: | 802 |
Median age
| Males: | 44.5 years |
| Females: | 38.0 years |
Housing prices:
Average estimated value of detached houses in 2021 (54.0% of all units):
| Berry Park: | $833,645 |
| San Jose: | $1,403,256 |
Average estimated value of townhouses or other attached units in 2021 (42.1% of all units):
| This neighborhood: | $938,774 |
| city: | $892,629 |
Most popular occupations of males: management occupations (except farmers) (23.2%); education, training, and library occupations (18.5%); sales and office occupations (14.0%); production occupations (9.8%); construction, extraction, and maintenance occupations (8.9%); service occupations (6.6%); community and social services occupations (4.5%)
Most popular occupations of females: service occupations (28.9%); sales and office occupations (23.9%); healthcare practitioners and technical occupations (13.8%); business and financial operations occupations (13.3%); education, training, and library occupations (12.4%); arts, design, entertainment, sports, and media occupations (7.8%); construction, extraction, and maintenance occupations (1.1%)
Highways in this neighborhood: State Hwy 82 (Monterey Hwy).
Roads and streets: Park Sharon Dr; Park Paxton Pl; Skyway Dr; Stone Canyon Dr; Park Ellen Dr; Park Sommers Way; Pinon Pl; Shellbark Dr; Park Arcadia Dr; Sweetberry Ct; Pitch Pine Ct; Poinsettia Ct; River Ash Ct; Park Bolton Pl; Park Essex Pl; Park Belmont Pl; Park Oxford Pl; Park Groton Pl; Park Village Pl; Park Fletcher Pl; Park Milford Pl; Silverberry Dr; Park Warren Pl; Park Bristol Pl; Park Concord Pl; Sugar Maple Dr; Park Watson Pl; Park Dartmouth Pl; Illsley Ct; Corkwood Ct; Spoonwood Ct; Park Douglas Pl; Park Sutton Pl; Park Norton Pl; Smoke Tree Ct.
Railroad features: Union Pacific RR.
Berry Park neighborhood detailed profile
Berryessa Creek neighborhood in San Jose statistics: (Find on map)
Area: 0.137 square miles
Population: 1,535
Population density:
Median household income in 2021:
Median rent in in 2021:
Male vs Females
Median age
Housing prices:
Average estimated value of detached houses in 2021 (31.3% of all units):
Average estimated value of townhouses or other attached units in 2021 (68.8% of all units):
Average estimated '21 value of housing units in 3-to-4-unit structures (4.8% of all units):
Most popular occupations of males: computer and mathematical occupations (17.9%); architecture and engineering occupations (17.8%); management occupations (except farmers) (13.2%); sales and office occupations (12.0%); service occupations (10.1%); production occupations (9.4%); construction, extraction, and maintenance occupations (7.8%)
Most popular occupations of females: healthcare practitioners and technical occupations (17.7%); business and financial operations occupations (16.5%); sales and office occupations (15.8%); service occupations (12.2%); management occupations (except farmers) (11.6%); architecture and engineering occupations (9.8%); life, physical, and social science occupations (5.1%)
Roads and streets: Parkhaven Dr; Creekside Dr; Baywood Sq; Cavendish Dr; Bluewood Cir; Scenic Sq; Vinedale Sq; Countrywalk Cir; Parkrow Ln; Ironside Ct; Messina Dr; Lambeth Ct; Fernside Sq; Quiet Cir; Cedarcrest Ln; Crewe Ct; Parkhaven Dr (Parkhaven Ct); Grosvenor Dr.
Other features: Berryessa Crk.
Berryessa Creek neighborhood detailed profile
Area: 0.137 square miles
Population: 1,535
Population density:
| Berryessa Creek: | 11,167 people per square mile |
| San Jose: | 5,625 people per square mile |
Median household income in 2021:
| Berryessa Creek: | $158,290 |
| San Jose: | $126,377 |
Median rent in in 2021:
| Berryessa Creek: | $2,730 |
| San Jose: | $2,001 |
Male vs Females
| Males: | 790 |
| Females: | 744 |
Median age
| Males: | 39.0 years |
| Females: | 42.9 years |
Housing prices:
Average estimated value of detached houses in 2021 (31.3% of all units):
| Berryessa Creek: | $1,027,094 |
| San Jose: | $1,403,256 |
Average estimated value of townhouses or other attached units in 2021 (68.8% of all units):
| This neighborhood: | $523,611 |
| city: | $892,629 |
Average estimated '21 value of housing units in 3-to-4-unit structures (4.8% of all units):
| Berryessa Creek: | $615,349 |
| city: | $680,453 |
Most popular occupations of males: computer and mathematical occupations (17.9%); architecture and engineering occupations (17.8%); management occupations (except farmers) (13.2%); sales and office occupations (12.0%); service occupations (10.1%); production occupations (9.4%); construction, extraction, and maintenance occupations (7.8%)
Most popular occupations of females: healthcare practitioners and technical occupations (17.7%); business and financial operations occupations (16.5%); sales and office occupations (15.8%); service occupations (12.2%); management occupations (except farmers) (11.6%); architecture and engineering occupations (9.8%); life, physical, and social science occupations (5.1%)
Roads and streets: Parkhaven Dr; Creekside Dr; Baywood Sq; Cavendish Dr; Bluewood Cir; Scenic Sq; Vinedale Sq; Countrywalk Cir; Parkrow Ln; Ironside Ct; Messina Dr; Lambeth Ct; Fernside Sq; Quiet Cir; Cedarcrest Ln; Crewe Ct; Parkhaven Dr (Parkhaven Ct); Grosvenor Dr.
Other features: Berryessa Crk.
Berryessa Creek neighborhood detailed profile
Beverly neighborhood in San Jose statistics: (Find on map)
Area: 0.104 square miles
Population: 1,080
Population density:
Median household income in 2021:
Median rent in in 2021:
Male vs Females
Median age
Housing prices:
Average estimated value of detached houses in 2021 (50.0% of all units):
Average estimated value of townhouses or other attached units in 2021 (21.7% of all units):
Average estimated '21 value of housing units in 5-or-more-unit structures (10.8% of all units):
Most popular occupations of males: sales and office occupations (16.7%); transportation occupations (16.6%); management occupations (except farmers) (10.8%); service occupations (9.5%); material moving occupations (7.7%); education, training, and library occupations (5.0%); community and social services occupations (3.3%)
Most popular occupations of females: service occupations (51.9%); production occupations (11.8%); management occupations (except farmers) (8.3%); healthcare practitioners and technical occupations (5.8%); sales and office occupations (4.8%); business and financial operations occupations (4.2%); education, training, and library occupations (4.2%)
Roads and streets: Silcreek Dr; Balboa Ave; Magellan Ave; Beverly Blvd; Basch Ave; Melrose Ave; E St James St; Wilshire Blvd; Cll de Plata; Checkers Dr.
Other features: Silver Crk.
Beverly neighborhood detailed profile
Area: 0.104 square miles
Population: 1,080
Population density:
| Beverly (Wilshire): | 10,352 people per square mile |
| San Jose: | 5,625 people per square mile |
Median household income in 2021:
| Beverly (Wilshire): | $66,396 |
| San Jose: | $126,377 |
Median rent in in 2021:
| Beverly (Wilshire): | $1,859 |
| San Jose: | $2,001 |
Male vs Females
| Males: | 646 |
| Females: | 434 |
Median age
| Males: | 38.3 years |
| Females: | 41.0 years |
Housing prices:
Average estimated value of detached houses in 2021 (50.0% of all units):
| Beverly (Wilshire): | $471,900 |
| San Jose: | $1,403,256 |
Average estimated value of townhouses or other attached units in 2021 (21.7% of all units):
| This neighborhood: | $1,161,966 |
| city: | $892,629 |
Average estimated '21 value of housing units in 5-or-more-unit structures (10.8% of all units):
| Beverly (Wilshire): | $423,467 |
| San Jose: | $688,625 |
Most popular occupations of males: sales and office occupations (16.7%); transportation occupations (16.6%); management occupations (except farmers) (10.8%); service occupations (9.5%); material moving occupations (7.7%); education, training, and library occupations (5.0%); community and social services occupations (3.3%)
Most popular occupations of females: service occupations (51.9%); production occupations (11.8%); management occupations (except farmers) (8.3%); healthcare practitioners and technical occupations (5.8%); sales and office occupations (4.8%); business and financial operations occupations (4.2%); education, training, and library occupations (4.2%)
Roads and streets: Silcreek Dr; Balboa Ave; Magellan Ave; Beverly Blvd; Basch Ave; Melrose Ave; E St James St; Wilshire Blvd; Cll de Plata; Checkers Dr.
Other features: Silver Crk.
Beverly neighborhood detailed profile
Bevin Brook neighborhood in San Jose statistics: (Find on map)
Area: 0.008 square miles
Population: 24
Population density:
Median household income in 2021:
Median rent in in 2021:
Male vs Females
Median age
Housing prices:
Average estimated value of detached houses in 2021 (25.0% of all units):
Average estimated '21 value of housing units in 5-or-more-unit structures (12.5% of all units):
Most popular occupations of males: service occupations (18.9%); computer and mathematical occupations (14.9%); sales and office occupations (12.9%); production occupations (12.7%); construction, extraction, and maintenance occupations (10.9%); management occupations (except farmers) (7.5%); transportation occupations (6.9%)
Most popular occupations of females: service occupations (35.7%); sales and office occupations (26.3%); management occupations (except farmers) (9.6%); production occupations (7.4%); healthcare practitioners and technical occupations (6.4%); business and financial operations occupations (3.4%); education, training, and library occupations (3.0%)
Roads and streets: Bevin Brook Dr.
Bevin Brook neighborhood detailed profile
Area: 0.008 square miles
Population: 24
Population density:
| Bevin Brook: | 3,144 people per square mile |
| San Jose: | 5,625 people per square mile |
Median household income in 2021:
| Bevin Brook: | $52,734 |
| San Jose: | $126,377 |
Median rent in in 2021:
| Bevin Brook: | $740 |
| San Jose: | $2,001 |
Male vs Females
| Males: | 12 |
| Females: | 12 |
Median age
| Males: | 34.9 years |
| Females: | 48.0 years |
Housing prices:
Average estimated value of detached houses in 2021 (25.0% of all units):
| Bevin Brook: | $737,733 |
| San Jose: | $1,403,256 |
Average estimated '21 value of housing units in 5-or-more-unit structures (12.5% of all units):
| Bevin Brook: | $555,588 |
| San Jose: | $688,625 |
Most popular occupations of males: service occupations (18.9%); computer and mathematical occupations (14.9%); sales and office occupations (12.9%); production occupations (12.7%); construction, extraction, and maintenance occupations (10.9%); management occupations (except farmers) (7.5%); transportation occupations (6.9%)
Most popular occupations of females: service occupations (35.7%); sales and office occupations (26.3%); management occupations (except farmers) (9.6%); production occupations (7.4%); healthcare practitioners and technical occupations (6.4%); business and financial operations occupations (3.4%); education, training, and library occupations (3.0%)
Roads and streets: Bevin Brook Dr.
Bevin Brook neighborhood detailed profile
Blackford neighborhood in San Jose statistics: (Find on map)
Area: 0.362 square miles
Population: 3,840
Population density:
Median household income in 2021:
Median rent in in 2021:
Male vs Females
Median age
Housing prices:
Average estimated value of detached houses in 2021 (39.8% of all units):
Average estimated value of townhouses or other attached units in 2021 (15.9% of all units):
Average estimated '21 value of housing units in 5-or-more-unit structures (9.3% of all units):
Most popular occupations of males: construction, extraction, and maintenance occupations (17.5%); service occupations (16.1%); sales and office occupations (12.4%); production occupations (12.1%); architecture and engineering occupations (9.6%); management occupations (except farmers) (9.4%); computer and mathematical occupations (9.3%)
Most popular occupations of females: sales and office occupations (26.7%); business and financial operations occupations (16.2%); architecture and engineering occupations (14.9%); production occupations (11.3%); arts, design, entertainment, sports, and media occupations (8.4%); service occupations (7.8%); management occupations (except farmers) (5.7%)
Roads and streets: Williams Rd; Boynton Ave; Hibiscus Ln; Blackford Ave; Daffodil Way; Manzanita Dr; Hamann Dr; Underwood Dr; Desert Isle Dr; Blackford Cir; Cabernet Vineyards Cir; Olga Dr; Gretchen Ln; Camellia Way; Orchid Way; Panda Dr; Moorpark Ave; Larkmead Rd; Barker Dr; Lindenwood Dr; Debra Way; Hibiscus Pl; Blackford Ct; Keltner Ave; Temple Dr; Panda Ct; Panda Pl; Panda Ln; Cabernet Vineyards Ct; Blackford Cl.
Blackford neighborhood detailed profile
Area: 0.362 square miles
Population: 3,840
Population density:
| Blackford: | 10,619 people per square mile |
| San Jose: | 5,625 people per square mile |
Median household income in 2021:
| Blackford: | $99,446 |
| San Jose: | $126,377 |
Median rent in in 2021:
| Blackford: | $2,278 |
| San Jose: | $2,001 |
Male vs Females
| Males: | 2,196 |
| Females: | 1,644 |
Median age
| Males: | 39.9 years |
| Females: | 38.8 years |
Housing prices:
Average estimated value of detached houses in 2021 (39.8% of all units):
| Blackford: | $1,422,370 |
| San Jose: | $1,403,256 |
Average estimated value of townhouses or other attached units in 2021 (15.9% of all units):
| This neighborhood: | $1,155,687 |
| city: | $892,629 |
Average estimated '21 value of housing units in 5-or-more-unit structures (9.3% of all units):
| Blackford: | $562,153 |
| San Jose: | $688,625 |
Most popular occupations of males: construction, extraction, and maintenance occupations (17.5%); service occupations (16.1%); sales and office occupations (12.4%); production occupations (12.1%); architecture and engineering occupations (9.6%); management occupations (except farmers) (9.4%); computer and mathematical occupations (9.3%)
Most popular occupations of females: sales and office occupations (26.7%); business and financial operations occupations (16.2%); architecture and engineering occupations (14.9%); production occupations (11.3%); arts, design, entertainment, sports, and media occupations (8.4%); service occupations (7.8%); management occupations (except farmers) (5.7%)
Roads and streets: Williams Rd; Boynton Ave; Hibiscus Ln; Blackford Ave; Daffodil Way; Manzanita Dr; Hamann Dr; Underwood Dr; Desert Isle Dr; Blackford Cir; Cabernet Vineyards Cir; Olga Dr; Gretchen Ln; Camellia Way; Orchid Way; Panda Dr; Moorpark Ave; Larkmead Rd; Barker Dr; Lindenwood Dr; Debra Way; Hibiscus Pl; Blackford Ct; Keltner Ave; Temple Dr; Panda Ct; Panda Pl; Panda Ln; Cabernet Vineyards Ct; Blackford Cl.
Blackford neighborhood detailed profile
Blossom Crest neighborhood in San Jose statistics: (Find on map)
Area: 0.197 square miles
Population: 1,720
Population density:
Median household income in 2021:
Median rent in in 2021:
Male vs Females
Median age
Housing prices:
Average estimated value of detached houses in 2021 (66.8% of all units):
Average estimated value of townhouses or other attached units in 2021 (9.1% of all units):
Most popular occupations of males: service occupations (29.7%); management occupations (except farmers) (17.3%); sales and office occupations (15.0%); business and financial operations occupations (9.8%); architecture and engineering occupations (9.1%); computer and mathematical occupations (6.6%); healthcare practitioners and technical occupations (3.8%)
Most popular occupations of females: healthcare practitioners and technical occupations (33.9%); sales and office occupations (17.7%); management occupations (except farmers) (12.4%); business and financial operations occupations (9.1%); education, training, and library occupations (9.1%); service occupations (6.4%); computer and mathematical occupations (4.1%)
Roads and streets: Taft Dr; Los Gatos Almaden Rd; Blossom Crest Way; Blossom Valley Dr; Nimrick Ln; Blossom Hill Rd; Blossom Dale Dr; Coronet Dr; Westchester Dr; Keene Dr; Baron Dr; Blossom Wood Dr; Blossom Acres Dr; Kunkel Dr; Blossom Terrace Ct; Blossom Vista Ave; Blossom Tree Ln; Adalina Ct; Union Ave; Lynn Ave; Grey Ct; Blossom Villa Way.
Blossom Crest neighborhood detailed profile
Area: 0.197 square miles
Population: 1,720
Population density:
| Blossom Crest: | 8,727 people per square mile |
| San Jose: | 5,625 people per square mile |
Median household income in 2021:
| Blossom Crest: | $180,222 |
| San Jose: | $126,377 |
Median rent in in 2021:
| Blossom Crest: | $3,002 |
| San Jose: | $2,001 |
Male vs Females
| Males: | 895 |
| Females: | 825 |
Median age
| Males: | 44.4 years |
| Females: | 47.0 years |
Housing prices:
Average estimated value of detached houses in 2021 (66.8% of all units):
| Blossom Crest: | $1,507,121 |
| San Jose: | $1,403,256 |
Average estimated value of townhouses or other attached units in 2021 (9.1% of all units):
| This neighborhood: | $909,054 |
| city: | $892,629 |
Most popular occupations of males: service occupations (29.7%); management occupations (except farmers) (17.3%); sales and office occupations (15.0%); business and financial operations occupations (9.8%); architecture and engineering occupations (9.1%); computer and mathematical occupations (6.6%); healthcare practitioners and technical occupations (3.8%)
Most popular occupations of females: healthcare practitioners and technical occupations (33.9%); sales and office occupations (17.7%); management occupations (except farmers) (12.4%); business and financial operations occupations (9.1%); education, training, and library occupations (9.1%); service occupations (6.4%); computer and mathematical occupations (4.1%)
Roads and streets: Taft Dr; Los Gatos Almaden Rd; Blossom Crest Way; Blossom Valley Dr; Nimrick Ln; Blossom Hill Rd; Blossom Dale Dr; Coronet Dr; Westchester Dr; Keene Dr; Baron Dr; Blossom Wood Dr; Blossom Acres Dr; Kunkel Dr; Blossom Terrace Ct; Blossom Vista Ave; Blossom Tree Ln; Adalina Ct; Union Ave; Lynn Ave; Grey Ct; Blossom Villa Way.
Blossom Crest neighborhood detailed profile
Blossom Hill Homes neighborhood in San Jose statistics: (Find on map)
Area: 0.049 square miles
Population: 169
Population density:
Median household income in 2021:
Median rent in in 2021:
Male vs Females
Median age
Housing prices:
Average estimated value of detached houses in 2021 (6.5% of all units):
Average estimated value of townhouses or other attached units in 2021 (59.7% of all units):
Average estimated '21 value of housing units in 3-to-4-unit structures (19.4% of all units):
Average estimated '21 value of housing units in 5-or-more-unit structures (1.6% of all units):
Most popular occupations of males: service occupations (15.1%); education, training, and library occupations (11.9%); computer and mathematical occupations (9.9%); sales and office occupations (9.3%); production occupations (8.6%); management occupations (except farmers) (7.9%); construction, extraction, and maintenance occupations (6.2%)
Most popular occupations of females: sales and office occupations (26.6%); management occupations (except farmers) (17.0%); education, training, and library occupations (12.1%); life, physical, and social science occupations (10.3%); service occupations (8.5%); business and financial operations occupations (5.9%); production occupations (5.9%)
Roads and streets: Don Juan Cir; Velasco Dr; Ent Cedros; Don Fernando Way; Don Jose Way; Don Basillo Way; Don Giovanni Ct; Don Scala Ct; Don Marco Ct; Don Pizzaro Ct; Don Edgardo Ct; Don Diablo Ct; Don Alfonso Way; Don Seville Ct; Don Manrico Ct; Don Carlos Ct; Don Andres Way; Don Marcello Ct; Don Andres Ct; Don Pedro Ct; Don Corelli Ct; Don Edmondo Ct; Don del Monico Ct; Don Alfonso Ct; Don Diego Ct; Don Basillo Ct; Don Mateo Ct; Don Correlli Way.
Blossom Hill Homes neighborhood detailed profile
Area: 0.049 square miles
Population: 169
Population density:
| Blossom Hill Homes: | 3,414 people per square mile |
| San Jose: | 5,625 people per square mile |
Median household income in 2021:
| Blossom Hill Homes: | $109,435 |
| San Jose: | $126,377 |
Median rent in in 2021:
| Blossom Hill Homes: | $2,576 |
| San Jose: | $2,001 |
Male vs Females
| Males: | 88 |
| Females: | 80 |
Median age
| Males: | 41.2 years |
| Females: | 39.1 years |
Housing prices:
Average estimated value of detached houses in 2021 (6.5% of all units):
| Blossom Hill Homes: | $7,050,099 |
| San Jose: | $1,403,256 |
Average estimated value of townhouses or other attached units in 2021 (59.7% of all units):
| This neighborhood: | $363,958 |
| city: | $892,629 |
Average estimated '21 value of housing units in 3-to-4-unit structures (19.4% of all units):
| Blossom Hill Homes: | $323,793 |
| city: | $680,453 |
Average estimated '21 value of housing units in 5-or-more-unit structures (1.6% of all units):
| Blossom Hill Homes: | $610,416 |
| San Jose: | $688,625 |
Most popular occupations of males: service occupations (15.1%); education, training, and library occupations (11.9%); computer and mathematical occupations (9.9%); sales and office occupations (9.3%); production occupations (8.6%); management occupations (except farmers) (7.9%); construction, extraction, and maintenance occupations (6.2%)
Most popular occupations of females: sales and office occupations (26.6%); management occupations (except farmers) (17.0%); education, training, and library occupations (12.1%); life, physical, and social science occupations (10.3%); service occupations (8.5%); business and financial operations occupations (5.9%); production occupations (5.9%)
Roads and streets: Don Juan Cir; Velasco Dr; Ent Cedros; Don Fernando Way; Don Jose Way; Don Basillo Way; Don Giovanni Ct; Don Scala Ct; Don Marco Ct; Don Pizzaro Ct; Don Edgardo Ct; Don Diablo Ct; Don Alfonso Way; Don Seville Ct; Don Manrico Ct; Don Carlos Ct; Don Andres Way; Don Marcello Ct; Don Andres Ct; Don Pedro Ct; Don Corelli Ct; Don Edmondo Ct; Don del Monico Ct; Don Alfonso Ct; Don Diego Ct; Don Basillo Ct; Don Mateo Ct; Don Correlli Way.
Blossom Hill Homes neighborhood detailed profile
Blossom River neighborhood in San Jose statistics: (Find on map)
Area: 0.026 square miles
Population: 121
Population density:
Median household income in 2021:
Median rent in in 2021:
Male vs Females
Median age
Most popular occupations of males: service occupations (23.4%); construction, extraction, and maintenance occupations (22.5%); computer and mathematical occupations (9.8%); material moving occupations (9.5%); business and financial operations occupations (7.3%); sales and office occupations (7.1%); transportation occupations (6.8%)
Most popular occupations of females: service occupations (37.9%); sales and office occupations (37.6%); education, training, and library occupations (8.0%); computer and mathematical occupations (7.3%); management occupations (except farmers) (6.8%); healthcare practitioners and technical occupations (4.0%); business and financial operations occupations (2.8%)
Blossom River neighborhood detailed profile
Area: 0.026 square miles
Population: 121
Population density:
| Blossom River: | 4,732 people per square mile |
| San Jose: | 5,625 people per square mile |
Median household income in 2021:
| Blossom River: | $55,223 |
| San Jose: | $126,377 |
Median rent in in 2021:
| Blossom River: | $2,323 |
| San Jose: | $2,001 |
Male vs Females
| Males: | 57 |
| Females: | 63 |
Median age
| Males: | 43.1 years |
| Females: | 49.7 years |
Most popular occupations of males: service occupations (23.4%); construction, extraction, and maintenance occupations (22.5%); computer and mathematical occupations (9.8%); material moving occupations (9.5%); business and financial operations occupations (7.3%); sales and office occupations (7.1%); transportation occupations (6.8%)
Most popular occupations of females: service occupations (37.9%); sales and office occupations (37.6%); education, training, and library occupations (8.0%); computer and mathematical occupations (7.3%); management occupations (except farmers) (6.8%); healthcare practitioners and technical occupations (4.0%); business and financial operations occupations (2.8%)
Blossom River neighborhood detailed profile
Bluewater neighborhood in San Jose statistics: (Find on map)
Area: 0.061 square miles
Population: 689
Population density:
Median household income in 2021:
Median rent in in 2021:
Male vs Females
Median age
Average estimated value of detached houses in 2021 (93.5% of all units):
Most popular occupations of males: production occupations (16.9%); sales and office occupations (16.1%); architecture and engineering occupations (10.3%); service occupations (10.3%); material moving occupations (7.9%); construction, extraction, and maintenance occupations (6.8%); computer and mathematical occupations (6.6%)
Most popular occupations of females: sales and office occupations (24.3%); service occupations (19.8%); production occupations (17.4%); healthcare practitioners and technical occupations (7.9%); education, training, and library occupations (6.8%); business and financial operations occupations (6.7%); computer and mathematical occupations (4.1%)
Roads and streets: Ocala Ave; Rosenelfe Cir; Rose Creek Dr; S White Rd; Ridgemont Dr; Bluewater Ct; Moonstar Ct.
Bluewater neighborhood detailed profile
Area: 0.061 square miles
Population: 689
Population density:
| Bluewater: | 11,223 people per square mile |
| San Jose: | 5,625 people per square mile |
Median household income in 2021:
| Bluewater: | $118,816 |
| San Jose: | $126,377 |
Median rent in in 2021:
| Bluewater: | $2,759 |
| San Jose: | $2,001 |
Male vs Females
| Males: | 334 |
| Females: | 354 |
Median age
| Males: | 37.8 years |
| Females: | 37.3 years |
Average estimated value of detached houses in 2021 (93.5% of all units):
| Bluewater: | $907,326 |
| San Jose: | $1,403,256 |
Most popular occupations of males: production occupations (16.9%); sales and office occupations (16.1%); architecture and engineering occupations (10.3%); service occupations (10.3%); material moving occupations (7.9%); construction, extraction, and maintenance occupations (6.8%); computer and mathematical occupations (6.6%)
Most popular occupations of females: sales and office occupations (24.3%); service occupations (19.8%); production occupations (17.4%); healthcare practitioners and technical occupations (7.9%); education, training, and library occupations (6.8%); business and financial operations occupations (6.7%); computer and mathematical occupations (4.1%)
Roads and streets: Ocala Ave; Rosenelfe Cir; Rose Creek Dr; S White Rd; Ridgemont Dr; Bluewater Ct; Moonstar Ct.
Bluewater neighborhood detailed profile
Bonita neighborhood in San Jose statistics: (Find on map)
Area: 0.240 square miles
Population: 2,694
Population density:
Median household income in 2021:
Median rent in in 2021:
Male vs Females
Median age
Housing prices:
Average estimated value of detached houses in 2021 (46.6% of all units):
Average estimated value of mobile home in 2021 (31.7% of all units):
Most popular occupations of males: service occupations (25.7%); computer and mathematical occupations (17.0%); construction, extraction, and maintenance occupations (13.6%); sales and office occupations (12.0%); production occupations (6.3%); transportation occupations (3.4%); management occupations (except farmers) (2.8%)
Most popular occupations of females: sales and office occupations (18.9%); service occupations (18.3%); production occupations (17.2%); arts, design, entertainment, sports, and media occupations (12.0%); education, training, and library occupations (7.7%); business and financial operations occupations (6.4%); management occupations (except farmers) (4.8%)
Limited-access highways (interstate or state) in this neighborhood: US Hwy 101; Sinclair Fwy (I- 280).
Roads and streets: Bonita Ave; Herald Ave; E William Ct; Rayos del Sol Dr; Jasper St; Lotus St; E San Antonio St; Banff St; Sunny Ct; Spiro Dr; Althoff Way; Danube Way; Kelly Ct; Remo St; Mirador Trl; Siler Ln; Luz Clara Dr; Cielo Lindo Dr; Brisa Pura Dr; Rayos de Estrella Dr; Mirador Ct.
Bonita neighborhood detailed profile
Area: 0.240 square miles
Population: 2,694
Population density:
| Bonita (24th): | 11,213 people per square mile |
| San Jose: | 5,625 people per square mile |
Median household income in 2021:
| Bonita (24th): | $81,452 |
| San Jose: | $126,377 |
Median rent in in 2021:
| Bonita (24th): | $1,634 |
| San Jose: | $2,001 |
Male vs Females
| Males: | 1,433 |
| Females: | 1,261 |
Median age
| Males: | 32.7 years |
| Females: | 31.9 years |
Housing prices:
Average estimated value of detached houses in 2021 (46.6% of all units):
| Bonita (24th): | $785,110 |
| San Jose: | $1,403,256 |
Average estimated value of mobile home in 2021 (31.7% of all units):
| Bonita (24th): | $168,464 |
| San Jose: | $240,963 |
Most popular occupations of males: service occupations (25.7%); computer and mathematical occupations (17.0%); construction, extraction, and maintenance occupations (13.6%); sales and office occupations (12.0%); production occupations (6.3%); transportation occupations (3.4%); management occupations (except farmers) (2.8%)
Most popular occupations of females: sales and office occupations (18.9%); service occupations (18.3%); production occupations (17.2%); arts, design, entertainment, sports, and media occupations (12.0%); education, training, and library occupations (7.7%); business and financial operations occupations (6.4%); management occupations (except farmers) (4.8%)
Limited-access highways (interstate or state) in this neighborhood: US Hwy 101; Sinclair Fwy (I- 280).
Roads and streets: Bonita Ave; Herald Ave; E William Ct; Rayos del Sol Dr; Jasper St; Lotus St; E San Antonio St; Banff St; Sunny Ct; Spiro Dr; Althoff Way; Danube Way; Kelly Ct; Remo St; Mirador Trl; Siler Ln; Luz Clara Dr; Cielo Lindo Dr; Brisa Pura Dr; Rayos de Estrella Dr; Mirador Ct.
Bonita neighborhood detailed profile
Boulder neighborhood in San Jose statistics: (Find on map)
Area: 0.312 square miles
Population: 190
Population density:
Median household income in 2021:
Median rent in in 2021:
Male vs Females
Median age
Average estimated value of detached houses in 2021 (76.6% of all units):
Most popular occupations of males: architecture and engineering occupations (24.7%); sales and office occupations (13.2%); management occupations (except farmers) (11.4%); service occupations (9.8%); education, training, and library occupations (9.6%); production occupations (9.5%); computer and mathematical occupations (6.1%)
Most popular occupations of females: sales and office occupations (21.6%); service occupations (17.4%); management occupations (except farmers) (15.7%); computer and mathematical occupations (9.1%); material moving occupations (8.1%); business and financial operations occupations (7.8%); architecture and engineering occupations (5.4%)
Roads and streets: Boulder Dr; Perie Ln; Claitor Way; Suncrest Ave; Sophist Dr; Lariat Ln; Mylinda Dr; Penitencia Creek Rd; Steinbaugh Ct; Pescos Pt.
Boulder neighborhood detailed profile
Area: 0.312 square miles
Population: 190
Population density:
| Boulder: | 609 people per square mile |
| San Jose: | 5,625 people per square mile |
Median household income in 2021:
| Boulder: | $151,992 |
| San Jose: | $126,377 |
Median rent in in 2021:
| Boulder: | $2,716 |
| San Jose: | $2,001 |
Male vs Females
| Males: | 80 |
| Females: | 109 |
Median age
| Males: | 45.8 years |
| Females: | 43.5 years |
Average estimated value of detached houses in 2021 (76.6% of all units):
| Boulder: | $1,456,081 |
| San Jose: | $1,403,256 |
Most popular occupations of males: architecture and engineering occupations (24.7%); sales and office occupations (13.2%); management occupations (except farmers) (11.4%); service occupations (9.8%); education, training, and library occupations (9.6%); production occupations (9.5%); computer and mathematical occupations (6.1%)
Most popular occupations of females: sales and office occupations (21.6%); service occupations (17.4%); management occupations (except farmers) (15.7%); computer and mathematical occupations (9.1%); material moving occupations (8.1%); business and financial operations occupations (7.8%); architecture and engineering occupations (5.4%)
Roads and streets: Boulder Dr; Perie Ln; Claitor Way; Suncrest Ave; Sophist Dr; Lariat Ln; Mylinda Dr; Penitencia Creek Rd; Steinbaugh Ct; Pescos Pt.
Boulder neighborhood detailed profile
Branham neighborhood in San Jose statistics: (Find on map)
Area: 0.100 square miles
Population: 443
Population density:
Median household income in 2021:
Median rent in in 2021:
Male vs Females
Median age
Housing prices:
Average estimated value of detached houses in 2021 (72.5% of all units):
Average estimated value of townhouses or other attached units in 2021 (27.5% of all units):
Most popular occupations of males: management occupations (except farmers) (46.2%); architecture and engineering occupations (9.9%); construction, extraction, and maintenance occupations (9.5%); service occupations (8.9%); computer and mathematical occupations (7.1%); business and financial operations occupations (6.2%); healthcare practitioners and technical occupations (3.4%)
Most popular occupations of females: sales and office occupations (37.6%); service occupations (11.4%); education, training, and library occupations (11.2%); healthcare practitioners and technical occupations (10.7%); management occupations (except farmers) (9.1%); life, physical, and social science occupations (6.2%); arts, design, entertainment, sports, and media occupations (5.6%)
Limited-access highways (interstate or state) in this neighborhood: State Hwy 87 (Guadalupe Fwy).
Roads and streets: Branham Ln; Joseph Speciale Dr; Columbia River Ct; Adamo Dr; Kings River Ct; Durango River Ct; Cimarron River Ct; Smoke River Ct; Canyon River Ct; Meadowhurst Ct; Cimmaron River Ct; Clear River Ct; Pinto River Ct; Powderborn Ct S; Holston River Ct; Powderborn Ct; Noyo River Ct; Shadowhurst Ct; Powderborn Ct N; Capitol Reef Ct; Little River Ct; Napa River Ct; Black River Ct; Adobe River Ct; Adamo Ct; Joseph Speciale Ct.
Branham neighborhood detailed profile
Area: 0.100 square miles
Population: 443
Population density:
| Branham: | 4,440 people per square mile |
| San Jose: | 5,625 people per square mile |
Median household income in 2021:
| Branham: | $138,540 |
| San Jose: | $126,377 |
Median rent in in 2021:
| Branham: | $2,894 |
| San Jose: | $2,001 |
Male vs Females
| Males: | 221 |
| Females: | 222 |
Median age
| Males: | 40.8 years |
| Females: | 45.7 years |
Housing prices:
Average estimated value of detached houses in 2021 (72.5% of all units):
| Branham: | $1,169,303 |
| San Jose: | $1,403,256 |
Average estimated value of townhouses or other attached units in 2021 (27.5% of all units):
| This neighborhood: | $993,590 |
| city: | $892,629 |
Most popular occupations of males: management occupations (except farmers) (46.2%); architecture and engineering occupations (9.9%); construction, extraction, and maintenance occupations (9.5%); service occupations (8.9%); computer and mathematical occupations (7.1%); business and financial operations occupations (6.2%); healthcare practitioners and technical occupations (3.4%)
Most popular occupations of females: sales and office occupations (37.6%); service occupations (11.4%); education, training, and library occupations (11.2%); healthcare practitioners and technical occupations (10.7%); management occupations (except farmers) (9.1%); life, physical, and social science occupations (6.2%); arts, design, entertainment, sports, and media occupations (5.6%)
Limited-access highways (interstate or state) in this neighborhood: State Hwy 87 (Guadalupe Fwy).
Roads and streets: Branham Ln; Joseph Speciale Dr; Columbia River Ct; Adamo Dr; Kings River Ct; Durango River Ct; Cimarron River Ct; Smoke River Ct; Canyon River Ct; Meadowhurst Ct; Cimmaron River Ct; Clear River Ct; Pinto River Ct; Powderborn Ct S; Holston River Ct; Powderborn Ct; Noyo River Ct; Shadowhurst Ct; Powderborn Ct N; Capitol Reef Ct; Little River Ct; Napa River Ct; Black River Ct; Adobe River Ct; Adamo Ct; Joseph Speciale Ct.
Branham neighborhood detailed profile
Branham Jarvis neighborhood in San Jose statistics: (Find on map)
Area: 0.532 square miles
Population: 4,359
Population density:
Median household income in 2021:
Median rent in in 2021:
Male vs Females
Median age
Housing prices:
Average estimated value of detached houses in 2021 (86.1% of all units):
Average estimated value of townhouses or other attached units in 2021 (4.7% of all units):
Average estimated '21 value of housing units in 3-to-4-unit structures (26.8% of all units):
Average estimated '21 value of housing units in 5-or-more-unit structures (23.9% of all units):
Most popular occupations of males: management occupations (except farmers) (23.6%); computer and mathematical occupations (15.1%); sales and office occupations (14.8%); service occupations (7.9%); architecture and engineering occupations (7.0%); construction, extraction, and maintenance occupations (6.0%); business and financial operations occupations (5.3%)
Most popular occupations of females: sales and office occupations (18.8%); service occupations (14.7%); management occupations (except farmers) (14.6%); education, training, and library occupations (13.3%); healthcare practitioners and technical occupations (11.1%); business and financial operations occupations (6.7%); computer and mathematical occupations (5.6%)
Limited-access highways (interstate or state) in this neighborhood: State Hwy 85 (W Valley Fwy).
Roads and streets: Branham Ln; Jarvis Ave; Luning Dr; Ilikai Ave; Cll de Stuarda; Sutcliff Ave; Montmorency Dr; Rio Verde Dr; Lansing Ave; Bouret Dr; Annapolis Way; Tampico Way; Prosper Ave; Santa Fe Dr; Courtyard Dr; Portobelo Dr; Cll de Farrar; Gerlach Dr; Casa de Ponselle; Searcy Dr; Boysea Dr; Cresthaven Ln; Yucatan Way; Cll de Tosca; Bald Eagle Way; Desin Dr; Cherry Ave; Silva Ave; Scossa Ave; Trego Dr; Lahaina Way; Via de Caballe; Lonardo Ave; Durango Ct; George Oaks Dr; Bordwell Ct; Las Cruces Ct; Waimea Ct; Cll de Arroyo; Cherry Ct; Kipling Ct; el Roble Ct; Cll de Gilda; Ranwick Ct; Saint Croix Ct; Usona Dr; Montmorency Ct; la Paz Ct; Puebla Ct; Robb Dr; Russo Dr; Rio Verde Ct; Corte de Boleyn; Sage Hen Ct; Pintail Ct; Corte de Thais; Corte de Moffo; Hanalei Pl; Corte de Tebaldi; Bordwell Dr.
Branham Jarvis neighborhood detailed profile
Area: 0.532 square miles
Population: 4,359
Population density:
| Branham Jarvis (Jarvis): | 8,198 people per square mile |
| San Jose: | 5,625 people per square mile |
Median household income in 2021:
| Branham Jarvis (Jarvis): | $129,668 |
| San Jose: | $126,377 |
Median rent in in 2021:
| Branham Jarvis (Jarvis): | $2,794 |
| San Jose: | $2,001 |
Male vs Females
| Males: | 2,302 |
| Females: | 2,056 |
Median age
| Males: | 41.3 years |
| Females: | 44.0 years |
Housing prices:
Average estimated value of detached houses in 2021 (86.1% of all units):
| Branham Jarvis (Jarvis): | $1,134,507 |
| San Jose: | $1,403,256 |
Average estimated value of townhouses or other attached units in 2021 (4.7% of all units):
| This neighborhood: | $781,657 |
| city: | $892,629 |
Average estimated '21 value of housing units in 3-to-4-unit structures (26.8% of all units):
| Branham Jarvis (Jarvis): | $443,848 |
| city: | $680,453 |
Average estimated '21 value of housing units in 5-or-more-unit structures (23.9% of all units):
| Branham Jarvis (Jarvis): | $633,871 |
| San Jose: | $688,625 |
Most popular occupations of males: management occupations (except farmers) (23.6%); computer and mathematical occupations (15.1%); sales and office occupations (14.8%); service occupations (7.9%); architecture and engineering occupations (7.0%); construction, extraction, and maintenance occupations (6.0%); business and financial operations occupations (5.3%)
Most popular occupations of females: sales and office occupations (18.8%); service occupations (14.7%); management occupations (except farmers) (14.6%); education, training, and library occupations (13.3%); healthcare practitioners and technical occupations (11.1%); business and financial operations occupations (6.7%); computer and mathematical occupations (5.6%)
Limited-access highways (interstate or state) in this neighborhood: State Hwy 85 (W Valley Fwy).
Roads and streets: Branham Ln; Jarvis Ave; Luning Dr; Ilikai Ave; Cll de Stuarda; Sutcliff Ave; Montmorency Dr; Rio Verde Dr; Lansing Ave; Bouret Dr; Annapolis Way; Tampico Way; Prosper Ave; Santa Fe Dr; Courtyard Dr; Portobelo Dr; Cll de Farrar; Gerlach Dr; Casa de Ponselle; Searcy Dr; Boysea Dr; Cresthaven Ln; Yucatan Way; Cll de Tosca; Bald Eagle Way; Desin Dr; Cherry Ave; Silva Ave; Scossa Ave; Trego Dr; Lahaina Way; Via de Caballe; Lonardo Ave; Durango Ct; George Oaks Dr; Bordwell Ct; Las Cruces Ct; Waimea Ct; Cll de Arroyo; Cherry Ct; Kipling Ct; el Roble Ct; Cll de Gilda; Ranwick Ct; Saint Croix Ct; Usona Dr; Montmorency Ct; la Paz Ct; Puebla Ct; Robb Dr; Russo Dr; Rio Verde Ct; Corte de Boleyn; Sage Hen Ct; Pintail Ct; Corte de Thais; Corte de Moffo; Hanalei Pl; Corte de Tebaldi; Bordwell Dr.
Branham Jarvis neighborhood detailed profile
Branham Kirk neighborhood in San Jose statistics: (Find on map)
Area: 0.316 square miles
Population: 1,957
Population density:
Median household income in 2021:
Median rent in in 2021:
Male vs Females
Median age
Housing prices:
Average estimated value of detached houses in 2021 (72.3% of all units):
Average estimated value of townhouses or other attached units in 2021 (9.3% of all units):
Average estimated '21 value of housing units in 3-to-4-unit structures (10.7% of all units):
Average estimated '21 value of housing units in 5-or-more-unit structures (10.1% of all units):
Most popular occupations of males: management occupations (except farmers) (17.5%); computer and mathematical occupations (14.5%); service occupations (11.4%); sales and office occupations (9.2%); business and financial operations occupations (8.5%); transportation occupations (6.6%); architecture and engineering occupations (6.1%)
Most popular occupations of females: sales and office occupations (25.6%); management occupations (except farmers) (17.9%); education, training, and library occupations (14.5%); service occupations (13.5%); healthcare practitioners and technical occupations (10.1%); business and financial operations occupations (5.0%); computer and mathematical occupations (4.2%)
Limited-access highways (interstate or state) in this neighborhood: State Hwy 85 (W Valley Fwy).
Roads and streets: Branham Ln; Meridian Ave; Tupolo Dr; Sherbourne Dr; Kirk Rd; St Regis Dr; Pine Forest Pl; Inverness Cir; Dent Ave; Cll de Lucia; Klipspringer Dr; Branham Park Pl; Pso Tranquillo; Wyndham Dr; Montrose Way; Tawnygate Way; Hollowgate Ln; Ross Ave; Carter Ave; Swangate Way; Corte de Pons; Corte de Medea; Pine Forest Ln; Corte de Callas; Corte de Pearson; Lawson Ct; Corte de Anna; Abbeygate Ct; Canberra Dr; Branham Park Ct; Little Branham Ln; Canberra Ct; Popejoy Ct; Calais Ct; Mandrill Ct.
Other features: Ross Crk.
Branham Kirk neighborhood detailed profile
Area: 0.316 square miles
Population: 1,957
Population density:
| Branham Kirk (Kirk): | 6,194 people per square mile |
| San Jose: | 5,625 people per square mile |
Median household income in 2021:
| Branham Kirk (Kirk): | $149,075 |
| San Jose: | $126,377 |
Median rent in in 2021:
| Branham Kirk (Kirk): | $2,921 |
| San Jose: | $2,001 |
Male vs Females
| Males: | 1,040 |
| Females: | 916 |
Median age
| Males: | 40.5 years |
| Females: | 43.7 years |
Housing prices:
Average estimated value of detached houses in 2021 (72.3% of all units):
| Branham Kirk (Kirk): | $1,406,146 |
| San Jose: | $1,403,256 |
Average estimated value of townhouses or other attached units in 2021 (9.3% of all units):
| This neighborhood: | $778,138 |
| city: | $892,629 |
Average estimated '21 value of housing units in 3-to-4-unit structures (10.7% of all units):
| Branham Kirk (Kirk): | $443,848 |
| city: | $680,453 |
Average estimated '21 value of housing units in 5-or-more-unit structures (10.1% of all units):
| Branham Kirk (Kirk): | $396,425 |
| San Jose: | $688,625 |
Most popular occupations of males: management occupations (except farmers) (17.5%); computer and mathematical occupations (14.5%); service occupations (11.4%); sales and office occupations (9.2%); business and financial operations occupations (8.5%); transportation occupations (6.6%); architecture and engineering occupations (6.1%)
Most popular occupations of females: sales and office occupations (25.6%); management occupations (except farmers) (17.9%); education, training, and library occupations (14.5%); service occupations (13.5%); healthcare practitioners and technical occupations (10.1%); business and financial operations occupations (5.0%); computer and mathematical occupations (4.2%)
Limited-access highways (interstate or state) in this neighborhood: State Hwy 85 (W Valley Fwy).
Roads and streets: Branham Ln; Meridian Ave; Tupolo Dr; Sherbourne Dr; Kirk Rd; St Regis Dr; Pine Forest Pl; Inverness Cir; Dent Ave; Cll de Lucia; Klipspringer Dr; Branham Park Pl; Pso Tranquillo; Wyndham Dr; Montrose Way; Tawnygate Way; Hollowgate Ln; Ross Ave; Carter Ave; Swangate Way; Corte de Pons; Corte de Medea; Pine Forest Ln; Corte de Callas; Corte de Pearson; Lawson Ct; Corte de Anna; Abbeygate Ct; Canberra Dr; Branham Park Ct; Little Branham Ln; Canberra Ct; Popejoy Ct; Calais Ct; Mandrill Ct.
Other features: Ross Crk.
Branham Kirk neighborhood detailed profile
Brenning neighborhood in San Jose statistics: (Find on map)
Area: 0.017 square miles
Roads and streets: Brenning Dr; Senter Rd; Guerra Ct; Mekler Ct; Conti Ct; Mekler Dr; Guerra Dr.
Brenning neighborhood detailed profile
Area: 0.017 square miles
Roads and streets: Brenning Dr; Senter Rd; Guerra Ct; Mekler Ct; Conti Ct; Mekler Dr; Guerra Dr.
Brenning neighborhood detailed profile
Brianna neighborhood in San Jose statistics: (Find on map)
Area: 0.066 square miles
Population: 28
Population density:
Median household income in 2021:
Median rent in in 2021:
Male vs Females
Median age
Housing prices:
Average estimated value of detached houses in 2021 (28.6% of all units):
Average estimated value of townhouses or other attached units in 2021 (14.3% of all units):
Most popular occupations of males: computer and mathematical occupations (17.9%); management occupations (except farmers) (17.3%); sales and office occupations (16.8%); service occupations (9.8%); construction, extraction, and maintenance occupations (9.8%); education, training, and library occupations (6.8%); life, physical, and social science occupations (4.5%)
Most popular occupations of females: management occupations (except farmers) (23.1%); healthcare practitioners and technical occupations (14.2%); sales and office occupations (13.7%); service occupations (10.7%); education, training, and library occupations (10.1%); business and financial operations occupations (9.1%); architecture and engineering occupations (5.7%)
Roads and streets: Graystone Ln; Briana Ct.
Brianna neighborhood detailed profile
Area: 0.066 square miles
Population: 28
Population density:
| Brianna: | 426 people per square mile |
| San Jose: | 5,625 people per square mile |
Median household income in 2021:
| Brianna: | $105,625 |
| San Jose: | $126,377 |
Median rent in in 2021:
| Brianna: | $1,449 |
| San Jose: | $2,001 |
Male vs Females
| Males: | 11 |
| Females: | 16 |
Median age
| Males: | 47.9 years |
| Females: | 42.9 years |
Housing prices:
Average estimated value of detached houses in 2021 (28.6% of all units):
| Brianna: | $1,668,392 |
| San Jose: | $1,403,256 |
Average estimated value of townhouses or other attached units in 2021 (14.3% of all units):
| This neighborhood: | $676,398 |
| city: | $892,629 |
Most popular occupations of males: computer and mathematical occupations (17.9%); management occupations (except farmers) (17.3%); sales and office occupations (16.8%); service occupations (9.8%); construction, extraction, and maintenance occupations (9.8%); education, training, and library occupations (6.8%); life, physical, and social science occupations (4.5%)
Most popular occupations of females: management occupations (except farmers) (23.1%); healthcare practitioners and technical occupations (14.2%); sales and office occupations (13.7%); service occupations (10.7%); education, training, and library occupations (10.1%); business and financial operations occupations (9.1%); architecture and engineering occupations (5.7%)
Roads and streets: Graystone Ln; Briana Ct.
Brianna neighborhood detailed profile
Brigadoon neighborhood in San Jose statistics: (Find on map)
Area: 0.413 square miles
Population: 3,124
Population density:
Median household income in 2021:
Median rent in in 2021:
Male vs Females
Median age
Housing prices:
Average estimated value of detached houses in 2021 (73.6% of all units):
Average estimated value of mobile home in 2021 (23.9% of all units):
Most popular occupations of males: service occupations (28.5%); construction, extraction, and maintenance occupations (10.2%); business and financial operations occupations (8.4%); legal occupations (7.6%); transportation occupations (7.6%); material moving occupations (7.6%); production occupations (5.2%)
Most popular occupations of females: service occupations (40.5%); sales and office occupations (31.1%); life, physical, and social science occupations (9.3%); business and financial operations occupations (4.8%); healthcare practitioners and technical occupations (4.7%); computer and mathematical occupations (2.8%); community and social services occupations (2.7%)
Roads and streets: Nieman Blvd; Brigadoon Way; Aborn Rd; Loch Ness Way; Bagpipe Way; Daniel Maloney Dr; Camperdown Way; Laddie Way; Turnhouse Ln; Cranworth Cir; Threadneedle Way; Methilhaven Ln; Mac Duee Way; Maple Leaf Ct; Innerwick Ln; Corkerhill Way; Firth Way; Heathcot Ct; Toryglen Way; Pine Spring Ct; Ben Lomond Way; Bathgate Ln; Curling Ct; Provanmill Way; Wendover Ln; Canongate Ct; Teola Way; Bridgecastle Ct; Mac Duee Ct; Danderhall Way; Postgate Ct; Annerly Ct; Uphall Ct; Thimblehall Ln; Poltonhall Ct; (Bankhead Way); Pine Way; Dundonald Ct; Methilhaven Ct; Halbreath Ct; Boswall Ct; Tweedsmuir Ct; Camperdown Ct; Lochness Ct.
Brigadoon neighborhood detailed profile
Area: 0.413 square miles
Population: 3,124
Population density:
| Brigadoon: | 7,568 people per square mile |
| San Jose: | 5,625 people per square mile |
Median household income in 2021:
| Brigadoon: | $126,022 |
| San Jose: | $126,377 |
Median rent in in 2021:
| Brigadoon: | $2,416 |
| San Jose: | $2,001 |
Male vs Females
| Males: | 1,443 |
| Females: | 1,681 |
Median age
| Males: | 34.9 years |
| Females: | 32.9 years |
Housing prices:
Average estimated value of detached houses in 2021 (73.6% of all units):
| Brigadoon: | $676,271 |
| San Jose: | $1,403,256 |
Average estimated value of mobile home in 2021 (23.9% of all units):
| Brigadoon: | $198,700 |
| San Jose: | $240,963 |
Most popular occupations of males: service occupations (28.5%); construction, extraction, and maintenance occupations (10.2%); business and financial operations occupations (8.4%); legal occupations (7.6%); transportation occupations (7.6%); material moving occupations (7.6%); production occupations (5.2%)
Most popular occupations of females: service occupations (40.5%); sales and office occupations (31.1%); life, physical, and social science occupations (9.3%); business and financial operations occupations (4.8%); healthcare practitioners and technical occupations (4.7%); computer and mathematical occupations (2.8%); community and social services occupations (2.7%)
Roads and streets: Nieman Blvd; Brigadoon Way; Aborn Rd; Loch Ness Way; Bagpipe Way; Daniel Maloney Dr; Camperdown Way; Laddie Way; Turnhouse Ln; Cranworth Cir; Threadneedle Way; Methilhaven Ln; Mac Duee Way; Maple Leaf Ct; Innerwick Ln; Corkerhill Way; Firth Way; Heathcot Ct; Toryglen Way; Pine Spring Ct; Ben Lomond Way; Bathgate Ln; Curling Ct; Provanmill Way; Wendover Ln; Canongate Ct; Teola Way; Bridgecastle Ct; Mac Duee Ct; Danderhall Way; Postgate Ct; Annerly Ct; Uphall Ct; Thimblehall Ln; Poltonhall Ct; (Bankhead Way); Pine Way; Dundonald Ct; Methilhaven Ct; Halbreath Ct; Boswall Ct; Tweedsmuir Ct; Camperdown Ct; Lochness Ct.
Brigadoon neighborhood detailed profile
Broadway neighborhood in San Jose statistics: (Find on map)
Area: 0.179 square miles
Population: 1,925
Population density:
Median household income in 2021:
Median rent in in 2021:
Male vs Females
Median age
Housing prices:
Average estimated value of detached houses in 2021 (68.2% of all units):
Most popular occupations of males: material moving occupations (269.1%); production occupations (219.0%); community and social services occupations (194.0%); architecture and engineering occupations (21.2%); sales and office occupations (19.7%); management occupations (except farmers) (15.5%); arts, design, entertainment, sports, and media occupations (11.6%)
Most popular occupations of females: service occupations (1235.9%); transportation occupations (118.3%); community and social services occupations (81.6%); arts, design, entertainment, sports, and media occupations (57.1%); farming, fishing, and forestry occupations (53.0%); life, physical, and social science occupations (32.6%); sales and office occupations (30.8%)
Roads and streets: Riverside Dr; Bird Ave; Coe Ave; Clintonia Ave; Broadway Ave; Palm Haven Ave; Plaza Dr; Willow St; Ramona Ave; Chabrant Way; Patricia Way; Merle Ave; Leona Ct; Hartford Ave; Iris Gardens Ct; Broadway Ct.
Railroad features: Union Pacific RR.
Broadway neighborhood detailed profile
Area: 0.179 square miles
Population: 1,925
Population density:
| Broadway (Palmhaven): | 10,783 people per square mile |
| San Jose: | 5,625 people per square mile |
Median household income in 2021:
| Broadway (Palmhaven): | $160,506 |
| San Jose: | $126,377 |
Median rent in in 2021:
| Broadway (Palmhaven): | $1,953 |
| San Jose: | $2,001 |
Male vs Females
| Males: | 898 |
| Females: | 1,027 |
Median age
| Males: | 42.4 years |
| Females: | 37.5 years |
Housing prices:
Average estimated value of detached houses in 2021 (68.2% of all units):
| Broadway (Palmhaven): | $1,081,706 |
| San Jose: | $1,403,256 |
Most popular occupations of males: material moving occupations (269.1%); production occupations (219.0%); community and social services occupations (194.0%); architecture and engineering occupations (21.2%); sales and office occupations (19.7%); management occupations (except farmers) (15.5%); arts, design, entertainment, sports, and media occupations (11.6%)
Most popular occupations of females: service occupations (1235.9%); transportation occupations (118.3%); community and social services occupations (81.6%); arts, design, entertainment, sports, and media occupations (57.1%); farming, fishing, and forestry occupations (53.0%); life, physical, and social science occupations (32.6%); sales and office occupations (30.8%)
Roads and streets: Riverside Dr; Bird Ave; Coe Ave; Clintonia Ave; Broadway Ave; Palm Haven Ave; Plaza Dr; Willow St; Ramona Ave; Chabrant Way; Patricia Way; Merle Ave; Leona Ct; Hartford Ave; Iris Gardens Ct; Broadway Ct.
Railroad features: Union Pacific RR.
Broadway neighborhood detailed profile
Brooktree neighborhood in San Jose statistics: (Find on map)
Area: 0.298 square miles
Population: 1,723
Population density:
Median household income in 2021:
Median rent in in 2021:
Male vs Females
Median age
Average estimated value of detached houses in 2021 (59.8% of all units):
Most popular occupations of males: sales and office occupations (19.3%); production occupations (13.9%); computer and mathematical occupations (12.1%); service occupations (9.3%); construction, extraction, and maintenance occupations (8.8%); management occupations (except farmers) (8.3%); architecture and engineering occupations (7.3%)
Most popular occupations of females: sales and office occupations (24.0%); service occupations (23.4%); production occupations (9.2%); healthcare practitioners and technical occupations (8.2%); business and financial operations occupations (7.8%); management occupations (except farmers) (7.0%); material moving occupations (4.6%)
Limited-access highways (interstate or state) in this neighborhood: Sinclair Fwy (I- 680).
Roads and streets: Hostetter Rd; Flickinger Ave; Ridgetree Way; Fallingtree Dr; N Capitol Ave; Flickinger Rd; Silvertree Dr; Four Oaks Rd; Royaltree Cir; Coraltree Pl; Goldentree Dr; Ramstree Dr; Shade Tree Ln; Oak Flat Rd; Minuet Dr; Shadowtree Dr; Olivetree Dr; Tambour Way; Stanwich Rd; Autumntree Ct; Ralene Pl; Montage Ct; Sonnet Ct; Libretto Ct; Poetry Dr; Four Seasons Ct; Yesler Ct; Oldtree Ct; Forgetree Ct; Flickinger Way; Ridgecliff Ct; Hamlet Ct; Rocktree Ct; Four Oaks Ct; Flickinger Ct; Elmtree Ct; Espirit Ct; Flickinger Pl; Ralene Ct.
Brooktree neighborhood detailed profile
Area: 0.298 square miles
Population: 1,723
Population density:
| Brooktree: | 5,778 people per square mile |
| San Jose: | 5,625 people per square mile |
Median household income in 2021:
| Brooktree: | $131,810 |
| San Jose: | $126,377 |
Median rent in in 2021:
| Brooktree: | $2,737 |
| San Jose: | $2,001 |
Male vs Females
| Males: | 962 |
| Females: | 760 |
Median age
| Males: | 39.9 years |
| Females: | 45.6 years |
Average estimated value of detached houses in 2021 (59.8% of all units):
| Brooktree: | $1,076,182 |
| San Jose: | $1,403,256 |
Most popular occupations of males: sales and office occupations (19.3%); production occupations (13.9%); computer and mathematical occupations (12.1%); service occupations (9.3%); construction, extraction, and maintenance occupations (8.8%); management occupations (except farmers) (8.3%); architecture and engineering occupations (7.3%)
Most popular occupations of females: sales and office occupations (24.0%); service occupations (23.4%); production occupations (9.2%); healthcare practitioners and technical occupations (8.2%); business and financial operations occupations (7.8%); management occupations (except farmers) (7.0%); material moving occupations (4.6%)
Limited-access highways (interstate or state) in this neighborhood: Sinclair Fwy (I- 680).
Roads and streets: Hostetter Rd; Flickinger Ave; Ridgetree Way; Fallingtree Dr; N Capitol Ave; Flickinger Rd; Silvertree Dr; Four Oaks Rd; Royaltree Cir; Coraltree Pl; Goldentree Dr; Ramstree Dr; Shade Tree Ln; Oak Flat Rd; Minuet Dr; Shadowtree Dr; Olivetree Dr; Tambour Way; Stanwich Rd; Autumntree Ct; Ralene Pl; Montage Ct; Sonnet Ct; Libretto Ct; Poetry Dr; Four Seasons Ct; Yesler Ct; Oldtree Ct; Forgetree Ct; Flickinger Way; Ridgecliff Ct; Hamlet Ct; Rocktree Ct; Four Oaks Ct; Flickinger Ct; Elmtree Ct; Espirit Ct; Flickinger Pl; Ralene Ct.
Brooktree neighborhood detailed profile
Brookvale neighborhood in San Jose statistics: (Find on map)
Area: 0.060 square miles
Population: 550
Population density:
Median household income in 2021:
Median rent in in 2021:
Male vs Females
Median age
Most popular occupations of males: computer and mathematical occupations (29.1%); architecture and engineering occupations (21.7%); management occupations (except farmers) (18.6%); sales and office occupations (8.6%); material moving occupations (7.5%); life, physical, and social science occupations (5.7%); education, training, and library occupations (5.7%)
Most popular occupations of females: sales and office occupations (22.4%); management occupations (except farmers) (15.6%); architecture and engineering occupations (15.0%); education, training, and library occupations (9.2%); business and financial operations occupations (8.8%); life, physical, and social science occupations (8.8%); service occupations (8.0%)
Roads and streets: Brookvale Dr; Sharon Dr; Sharon Manor Ct; Triumph Ct.
Other features: Calabazas Crk.
Brookvale neighborhood detailed profile
Area: 0.060 square miles
Population: 550
Population density:
| Brookvale (Chantel): | 9,200 people per square mile |
| San Jose: | 5,625 people per square mile |
Median household income in 2021:
| Brookvale (Chantel): | $160,547 |
| San Jose: | $126,377 |
Median rent in in 2021:
| Brookvale (Chantel): | $2,285 |
| San Jose: | $2,001 |
Male vs Females
| Males: | 286 |
| Females: | 263 |
Median age
| Males: | 40.7 years |
| Females: | 42.0 years |
Most popular occupations of males: computer and mathematical occupations (29.1%); architecture and engineering occupations (21.7%); management occupations (except farmers) (18.6%); sales and office occupations (8.6%); material moving occupations (7.5%); life, physical, and social science occupations (5.7%); education, training, and library occupations (5.7%)
Most popular occupations of females: sales and office occupations (22.4%); management occupations (except farmers) (15.6%); architecture and engineering occupations (15.0%); education, training, and library occupations (9.2%); business and financial operations occupations (8.8%); life, physical, and social science occupations (8.8%); service occupations (8.0%)
Roads and streets: Brookvale Dr; Sharon Dr; Sharon Manor Ct; Triumph Ct.
Other features: Calabazas Crk.
Brookvale neighborhood detailed profile
Brookwood South neighborhood in San Jose statistics: (Find on map)
Area: 0.023 square miles
Population: 141
Population density:
Median household income in 2021:
Median rent in in 2021:
Male vs Females
Median age
Average estimated value of detached houses in 2021 (64.1% of all units):
Most popular occupations of males: construction, extraction, and maintenance occupations (44.8%); service occupations (20.9%); management occupations (except farmers) (12.0%); production occupations (6.1%); transportation occupations (5.4%); sales and office occupations (2.6%); healthcare practitioners and technical occupations (2.5%)
Most popular occupations of females: sales and office occupations (52.4%); service occupations (25.4%); computer and mathematical occupations (8.1%); production occupations (6.6%); material moving occupations (5.7%); architecture and engineering occupations (4.0%); life, physical, and social science occupations (2.8%)
Roads and streets: E William St; S 21st St; Woodvale Ct; Woodfalls Ct; Woodtown Ct.
Railroad features: Union Pacific RR.
Brookwood South neighborhood detailed profile
Area: 0.023 square miles
Population: 141
Population density:
| Brookwood South: | 6,174 people per square mile |
| San Jose: | 5,625 people per square mile |
Median household income in 2021:
| Brookwood South: | $57,064 |
| San Jose: | $126,377 |
Median rent in in 2021:
| Brookwood South: | $1,647 |
| San Jose: | $2,001 |
Male vs Females
| Males: | 58 |
| Females: | 83 |
Median age
| Males: | 32.2 years |
| Females: | 35.3 years |
Average estimated value of detached houses in 2021 (64.1% of all units):
| Brookwood South: | $598,580 |
| San Jose: | $1,403,256 |
Most popular occupations of males: construction, extraction, and maintenance occupations (44.8%); service occupations (20.9%); management occupations (except farmers) (12.0%); production occupations (6.1%); transportation occupations (5.4%); sales and office occupations (2.6%); healthcare practitioners and technical occupations (2.5%)
Most popular occupations of females: sales and office occupations (52.4%); service occupations (25.4%); computer and mathematical occupations (8.1%); production occupations (6.6%); material moving occupations (5.7%); architecture and engineering occupations (4.0%); life, physical, and social science occupations (2.8%)
Roads and streets: E William St; S 21st St; Woodvale Ct; Woodfalls Ct; Woodtown Ct.
Railroad features: Union Pacific RR.
Brookwood South neighborhood detailed profile
Brookwood Terrace neighborhood in San Jose statistics: (Find on map)
Area: 0.106 square miles
Population: 1,545
Population density:
Median household income in 2021:
Median rent in in 2021:
Male vs Females
Median age
Average estimated value of detached houses in 2021 (79.3% of all units):
Most popular occupations of males: service occupations (23.7%); construction, extraction, and maintenance occupations (12.0%); sales and office occupations (11.3%); healthcare practitioners and technical occupations (10.7%); transportation occupations (9.6%); management occupations (except farmers) (8.9%); production occupations (6.0%)
Most popular occupations of females: service occupations (30.9%); management occupations (except farmers) (17.7%); education, training, and library occupations (16.6%); healthcare practitioners and technical occupations (12.6%); sales and office occupations (8.6%); business and financial operations occupations (6.8%); community and social services occupations (6.3%)
Roads and streets: Brookwood Ave; E San Antonio St; S 23rd St; S 24th St; S 19th St; S 20th St; S 21st St; S 22nd St; S 18th St.
Railroad features: Union Pacific RR.
Brookwood Terrace neighborhood detailed profile
Area: 0.106 square miles
Population: 1,545
Population density:
| Brookwood Terrace: | 14,512 people per square mile |
| San Jose: | 5,625 people per square mile |
Median household income in 2021:
| Brookwood Terrace: | $84,632 |
| San Jose: | $126,377 |
Median rent in in 2021:
| Brookwood Terrace: | $2,219 |
| San Jose: | $2,001 |
Male vs Females
| Males: | 829 |
| Females: | 716 |
Median age
| Males: | 32.8 years |
| Females: | 40.0 years |
Average estimated value of detached houses in 2021 (79.3% of all units):
| Brookwood Terrace: | $1,278,371 |
| San Jose: | $1,403,256 |
Most popular occupations of males: service occupations (23.7%); construction, extraction, and maintenance occupations (12.0%); sales and office occupations (11.3%); healthcare practitioners and technical occupations (10.7%); transportation occupations (9.6%); management occupations (except farmers) (8.9%); production occupations (6.0%)
Most popular occupations of females: service occupations (30.9%); management occupations (except farmers) (17.7%); education, training, and library occupations (16.6%); healthcare practitioners and technical occupations (12.6%); sales and office occupations (8.6%); business and financial operations occupations (6.8%); community and social services occupations (6.3%)
Roads and streets: Brookwood Ave; E San Antonio St; S 23rd St; S 24th St; S 19th St; S 20th St; S 21st St; S 22nd St; S 18th St.
Railroad features: Union Pacific RR.
Brookwood Terrace neighborhood detailed profile
Brush Glen neighborhood in San Jose statistics: (Find on map)
Area: 0.106 square miles
Population: 750
Population density:
Median household income in 2021:
Median rent in in 2021:
Male vs Females
Median age
Housing prices:
Average estimated value of detached houses in 2021 (59.3% of all units):
Average estimated value of townhouses or other attached units in 2021 (15.5% of all units):
Average estimated '21 value of housing units in 3-to-4-unit structures (5.2% of all units):
Average estimated '21 value of housing units in 5-or-more-unit structures (4.1% of all units):
Average estimated value of mobile home in 2021 (8.8% of all units):
Most popular occupations of males: sales and office occupations (20.3%); service occupations (19.8%); construction, extraction, and maintenance occupations (9.6%); production occupations (9.4%); transportation occupations (6.9%); computer and mathematical occupations (5.3%); life, physical, and social science occupations (5.3%)
Most popular occupations of females: service occupations (27.3%); sales and office occupations (17.3%); business and financial operations occupations (10.8%); production occupations (9.5%); healthcare practitioners and technical occupations (9.4%); management occupations (except farmers) (8.0%); education, training, and library occupations (5.8%)
Limited-access highways (interstate or state) in this neighborhood: Sinclair Fwy (I- 680).
Roads and streets: Brushglen Way; Lanning Way; Rhinehart Dr; Ridgeglen Way; Downsglen Way; Caribe Way; Breezyglen Ct; Ashglen Way; Chilberg Ct; Bataan Ct; Clogstone Ct; Tortola Way; Lanning Ct; Foundry Ct; Moorglen Ct; Bayside Ct.
Brush Glen neighborhood detailed profile
Area: 0.106 square miles
Population: 750
Population density:
| Brush Glen: | 7,085 people per square mile |
| San Jose: | 5,625 people per square mile |
Median household income in 2021:
| Brush Glen: | $114,107 |
| San Jose: | $126,377 |
Median rent in in 2021:
| Brush Glen: | $1,010 |
| San Jose: | $2,001 |
Male vs Females
| Males: | 360 |
| Females: | 389 |
Median age
| Males: | 41.2 years |
| Females: | 42.8 years |
Housing prices:
Average estimated value of detached houses in 2021 (59.3% of all units):
| Brush Glen: | $641,041 |
| San Jose: | $1,403,256 |
Average estimated value of townhouses or other attached units in 2021 (15.5% of all units):
| This neighborhood: | $605,837 |
| city: | $892,629 |
Average estimated '21 value of housing units in 3-to-4-unit structures (5.2% of all units):
| Brush Glen: | $499,643 |
| city: | $680,453 |
Average estimated '21 value of housing units in 5-or-more-unit structures (4.1% of all units):
| Brush Glen: | $995,647 |
| San Jose: | $688,625 |
Average estimated value of mobile home in 2021 (8.8% of all units):
| Brush Glen: | $253,459 |
| San Jose: | $240,963 |
Most popular occupations of males: sales and office occupations (20.3%); service occupations (19.8%); construction, extraction, and maintenance occupations (9.6%); production occupations (9.4%); transportation occupations (6.9%); computer and mathematical occupations (5.3%); life, physical, and social science occupations (5.3%)
Most popular occupations of females: service occupations (27.3%); sales and office occupations (17.3%); business and financial operations occupations (10.8%); production occupations (9.5%); healthcare practitioners and technical occupations (9.4%); management occupations (except farmers) (8.0%); education, training, and library occupations (5.8%)
Limited-access highways (interstate or state) in this neighborhood: Sinclair Fwy (I- 680).
Roads and streets: Brushglen Way; Lanning Way; Rhinehart Dr; Ridgeglen Way; Downsglen Way; Caribe Way; Breezyglen Ct; Ashglen Way; Chilberg Ct; Bataan Ct; Clogstone Ct; Tortola Way; Lanning Ct; Foundry Ct; Moorglen Ct; Bayside Ct.
Brush Glen neighborhood detailed profile
Bucknall neighborhood in San Jose statistics: (Find on map)
Area: 0.556 square miles
Population: 4,559
Population density:
Median household income in 2021:
Median rent in in 2021:
Male vs Females
Median age
Average estimated value of detached houses in 2021 (88.9% of all units):
Most popular occupations of males: management occupations (except farmers) (21.9%); computer and mathematical occupations (18.4%); sales and office occupations (13.5%); architecture and engineering occupations (11.2%); business and financial operations occupations (10.3%); education, training, and library occupations (7.5%); service occupations (5.8%)
Most popular occupations of females: sales and office occupations (26.4%); business and financial operations occupations (22.1%); management occupations (except farmers) (14.2%); computer and mathematical occupations (11.1%); education, training, and library occupations (8.4%); service occupations (7.7%); healthcare practitioners and technical occupations (5.5%)
Roads and streets: Vanderbilt Dr; Bucknall Rd; Grimsby Dr; Alex Dr; McCoy Ave; Camrose Ave; Elmwood Dr; Norwich Way; Northlawn Dr; Colusa Way; Pso Olivos; Mayfield Ave; Weston Dr; Tilbury Dr; Madoc Way; Fenian Dr; Bobbie Ave; Chaparral Ave; Lantana Ave; Maroel Dr; Tamie Ln; Chesley Dr; Rincon Ave (W Rincon Ave); Wood Glen Dr; Denevi Dr; Morden Dr; S San Tomas Aquino Rd; Verwood Dr; Lage Dr; Tiberan Way; Neville Ave; Grandby Dr; Le Bain Dr; Fulton St; Datoro Dr; Villanova Rd; Riordan Dr; Arleen Way; Whitwood Ln; Dorval Dr; Harmony Way; Ottawa Way; Ashland Way; Rossotto Dr; Melville Way; Serge Ave; W Campbell Ave; Elmgrove Ln; Betlo Ct; Shalen Ct; Reden Dr; Paseo Olivos Ct; Heathview Dr; Arrowood Ln; Meta Dr; Grimsby Ct; Elmgrove Ct; Bass Ct; Quito Rd.
Bucknall neighborhood detailed profile
Area: 0.556 square miles
Population: 4,559
Population density:
| Bucknall: | 8,194 people per square mile |
| San Jose: | 5,625 people per square mile |
Median household income in 2021:
| Bucknall: | $207,155 |
| San Jose: | $126,377 |
Median rent in in 2021:
| Bucknall: | $2,062 |
| San Jose: | $2,001 |
Male vs Females
| Males: | 2,374 |
| Females: | 2,185 |
Median age
| Males: | 41.5 years |
| Females: | 40.3 years |
Average estimated value of detached houses in 2021 (88.9% of all units):
| Bucknall: | $1,345,068 |
| San Jose: | $1,403,256 |
Most popular occupations of males: management occupations (except farmers) (21.9%); computer and mathematical occupations (18.4%); sales and office occupations (13.5%); architecture and engineering occupations (11.2%); business and financial operations occupations (10.3%); education, training, and library occupations (7.5%); service occupations (5.8%)
Most popular occupations of females: sales and office occupations (26.4%); business and financial operations occupations (22.1%); management occupations (except farmers) (14.2%); computer and mathematical occupations (11.1%); education, training, and library occupations (8.4%); service occupations (7.7%); healthcare practitioners and technical occupations (5.5%)
Roads and streets: Vanderbilt Dr; Bucknall Rd; Grimsby Dr; Alex Dr; McCoy Ave; Camrose Ave; Elmwood Dr; Norwich Way; Northlawn Dr; Colusa Way; Pso Olivos; Mayfield Ave; Weston Dr; Tilbury Dr; Madoc Way; Fenian Dr; Bobbie Ave; Chaparral Ave; Lantana Ave; Maroel Dr; Tamie Ln; Chesley Dr; Rincon Ave (W Rincon Ave); Wood Glen Dr; Denevi Dr; Morden Dr; S San Tomas Aquino Rd; Verwood Dr; Lage Dr; Tiberan Way; Neville Ave; Grandby Dr; Le Bain Dr; Fulton St; Datoro Dr; Villanova Rd; Riordan Dr; Arleen Way; Whitwood Ln; Dorval Dr; Harmony Way; Ottawa Way; Ashland Way; Rossotto Dr; Melville Way; Serge Ave; W Campbell Ave; Elmgrove Ln; Betlo Ct; Shalen Ct; Reden Dr; Paseo Olivos Ct; Heathview Dr; Arrowood Ln; Meta Dr; Grimsby Ct; Elmgrove Ct; Bass Ct; Quito Rd.
Bucknall neighborhood detailed profile
Buena Park neighborhood in San Jose statistics: (Find on map)
Area: 0.085 square miles
Population: 548
Population density:
Median household income in 2021:
Median rent in in 2021:
Male vs Females
Median age
Average estimated value of detached houses in 2021 (63.3% of all units):
Most popular occupations of males: sales and office occupations (18.3%); management occupations (except farmers) (16.4%); material moving occupations (14.2%); arts, design, entertainment, sports, and media occupations (12.9%); construction, extraction, and maintenance occupations (8.6%); service occupations (7.3%); education, training, and library occupations (6.7%)
Most popular occupations of females: education, training, and library occupations (24.8%); management occupations (except farmers) (19.2%); business and financial operations occupations (18.4%); sales and office occupations (14.5%); service occupations (12.0%); healthcare practitioners and technical occupations (7.3%); production occupations (6.6%)
Roads and streets: San Felipe Rd; Buena Park Ct; Buena Point Ct; Buena View Ct; Buena Crest Ct; Buena Knoll Ct; Yerba Buena Rd.
Other features: Thompson Crk.
Buena Park neighborhood detailed profile
Area: 0.085 square miles
Population: 548
Population density:
| Buena Park: | 6,474 people per square mile |
| San Jose: | 5,625 people per square mile |
Median household income in 2021:
| Buena Park: | $101,635 |
| San Jose: | $126,377 |
Median rent in in 2021:
| Buena Park: | $3,038 |
| San Jose: | $2,001 |
Male vs Females
| Males: | 275 |
| Females: | 273 |
Median age
| Males: | 34.5 years |
| Females: | 52.0 years |
Average estimated value of detached houses in 2021 (63.3% of all units):
| Buena Park: | $1,038,438 |
| San Jose: | $1,403,256 |
Most popular occupations of males: sales and office occupations (18.3%); management occupations (except farmers) (16.4%); material moving occupations (14.2%); arts, design, entertainment, sports, and media occupations (12.9%); construction, extraction, and maintenance occupations (8.6%); service occupations (7.3%); education, training, and library occupations (6.7%)
Most popular occupations of females: education, training, and library occupations (24.8%); management occupations (except farmers) (19.2%); business and financial operations occupations (18.4%); sales and office occupations (14.5%); service occupations (12.0%); healthcare practitioners and technical occupations (7.3%); production occupations (6.6%)
Roads and streets: San Felipe Rd; Buena Park Ct; Buena Point Ct; Buena View Ct; Buena Crest Ct; Buena Knoll Ct; Yerba Buena Rd.
Other features: Thompson Crk.
Buena Park neighborhood detailed profile
Buena Vista neighborhood in San Jose statistics: (Find on map)
Area: 0.096 square miles
Population: 1,899
Population density:
Median household income in 2021:
Median rent in in 2021:
Male vs Females
Median age
Most popular occupations of males: service occupations (31.7%); construction, extraction, and maintenance occupations (15.5%); management occupations (except farmers) (11.3%); sales and office occupations (7.2%); business and financial operations occupations (6.9%); computer and mathematical occupations (6.1%); production occupations (5.5%)
Most popular occupations of females: service occupations (48.1%); sales and office occupations (18.3%); management occupations (except farmers) (12.7%); computer and mathematical occupations (3.2%); business and financial operations occupations (3.1%); education, training, and library occupations (2.9%); arts, design, entertainment, sports, and media occupations (2.8%)
Roads and streets: Scott St; Mayellen Ave; Clifton Ave; New St; S Willard Ave.
Buena Vista neighborhood detailed profile
Area: 0.096 square miles
Population: 1,899
Population density:
| Buena Vista: | 19,800 people per square mile |
| San Jose: | 5,625 people per square mile |
Median household income in 2021:
| Buena Vista: | $103,786 |
| San Jose: | $126,377 |
Median rent in in 2021:
| Buena Vista: | $1,928 |
| San Jose: | $2,001 |
Male vs Females
| Males: | 1,062 |
| Females: | 836 |
Median age
| Males: | 34.4 years |
| Females: | 33.5 years |
Most popular occupations of males: service occupations (31.7%); construction, extraction, and maintenance occupations (15.5%); management occupations (except farmers) (11.3%); sales and office occupations (7.2%); business and financial operations occupations (6.9%); computer and mathematical occupations (6.1%); production occupations (5.5%)
Most popular occupations of females: service occupations (48.1%); sales and office occupations (18.3%); management occupations (except farmers) (12.7%); computer and mathematical occupations (3.2%); business and financial operations occupations (3.1%); education, training, and library occupations (2.9%); arts, design, entertainment, sports, and media occupations (2.8%)
Roads and streets: Scott St; Mayellen Ave; Clifton Ave; New St; S Willard Ave.
Buena Vista neighborhood detailed profile
Burning Tree neighborhood in San Jose statistics: (Find on map)
Area: 0.103 square miles
Population: 742
Population density:
Median household income in 2021:
Median rent in in 2021:
Male vs Females
Median age
Housing prices:
Average estimated value of detached houses in 2021 (98.3% of all units):
Average estimated value of townhouses or other attached units in 2021 (1.7% of all units):
Average estimated '21 value of housing units in 5-or-more-unit structures (4.9% of all units):
Most popular occupations of males: management occupations (except farmers) (31.8%); service occupations (17.0%); computer and mathematical occupations (9.5%); architecture and engineering occupations (9.1%); sales and office occupations (7.9%); production occupations (6.7%); transportation occupations (5.5%)
Most popular occupations of females: education, training, and library occupations (24.6%); sales and office occupations (23.6%); service occupations (15.2%); business and financial operations occupations (13.8%); computer and mathematical occupations (11.7%); production occupations (6.3%); management occupations (except farmers) (4.7%)
Roads and streets: Bernal Rd; Burning Tree Dr; Polvadero Dr; Bolado Dr; del Rio Dr; Burning Tree Ct; Santa Teresa Blvd; New River Dr.
Burning Tree neighborhood detailed profile
Area: 0.103 square miles
Population: 742
Population density:
| Burning Tree: | 7,187 people per square mile |
| San Jose: | 5,625 people per square mile |
Median household income in 2021:
| Burning Tree: | $136,140 |
| San Jose: | $126,377 |
Median rent in in 2021:
| Burning Tree: | $2,678 |
| San Jose: | $2,001 |
Male vs Females
| Males: | 354 |
| Females: | 387 |
Median age
| Males: | 45.9 years |
| Females: | 42.4 years |
Housing prices:
Average estimated value of detached houses in 2021 (98.3% of all units):
| Burning Tree: | $944,028 |
| San Jose: | $1,403,256 |
Average estimated value of townhouses or other attached units in 2021 (1.7% of all units):
| This neighborhood: | $711,862 |
| city: | $892,629 |
Average estimated '21 value of housing units in 5-or-more-unit structures (4.9% of all units):
| Burning Tree: | $593,216 |
| San Jose: | $688,625 |
Most popular occupations of males: management occupations (except farmers) (31.8%); service occupations (17.0%); computer and mathematical occupations (9.5%); architecture and engineering occupations (9.1%); sales and office occupations (7.9%); production occupations (6.7%); transportation occupations (5.5%)
Most popular occupations of females: education, training, and library occupations (24.6%); sales and office occupations (23.6%); service occupations (15.2%); business and financial operations occupations (13.8%); computer and mathematical occupations (11.7%); production occupations (6.3%); management occupations (except farmers) (4.7%)
Roads and streets: Bernal Rd; Burning Tree Dr; Polvadero Dr; Bolado Dr; del Rio Dr; Burning Tree Ct; Santa Teresa Blvd; New River Dr.
Burning Tree neighborhood detailed profile
Cadillac East neighborhood in San Jose statistics: (Find on map)
Area: 0.046 square miles
Roads and streets: Eden Ave.
Cadillac East neighborhood detailed profile
Area: 0.046 square miles
Roads and streets: Eden Ave.
Cadillac East neighborhood detailed profile
Cadillac West neighborhood in San Jose statistics: (Find on map)
Area: 0.029 square miles
Roads and streets: Cadillac Dr; Merrimac Dr; Lexington Dr; Maria Way.
Cadillac West neighborhood detailed profile
Area: 0.029 square miles
Roads and streets: Cadillac Dr; Merrimac Dr; Lexington Dr; Maria Way.
Cadillac West neighborhood detailed profile
Cadwallader neighborhood in San Jose statistics: (Find on map)
Area: 0.224 square miles
Population: 1,735
Population density:
Median household income in 2021:
Median rent in in 2021:
Male vs Females
Median age
Housing prices:
Average estimated value of detached houses in 2021 (94.1% of all units):
Average estimated value of townhouses or other attached units in 2021 (1.0% of all units):
Most popular occupations of males: sales and office occupations (22.7%); computer and mathematical occupations (20.7%); material moving occupations (9.6%); management occupations (except farmers) (9.5%); healthcare practitioners and technical occupations (6.9%); construction, extraction, and maintenance occupations (6.9%); production occupations (5.6%)
Most popular occupations of females: business and financial operations occupations (28.6%); education, training, and library occupations (15.4%); service occupations (13.0%); healthcare practitioners and technical occupations (10.9%); sales and office occupations (8.5%); management occupations (except farmers) (6.5%); production occupations (6.5%)
Roads and streets: Cadwallader Ave; Suisun Ave; Woodside Ln; San Felipe Rd; Orinda Dr; Keaton Loop; Hillsborough Way; Millbrae Way; Los Altos Dr; Country Vista Ct; Clarebank Way; Blenheim Ln; Tankerland Ct; Woodside Ct; Los Altos Ct; Ramirez Ct; Mc Andrew Ct; Casey Way; Mc Ann Ct; Spruce Rock St; Belgravian Ct; Toy Ln; Woodtree Ct; Yerba Buena Ave; Caterpillar Ct; Aborn Rd.
Other features: Thompson Crk.
Cadwallader neighborhood detailed profile
Area: 0.224 square miles
Population: 1,735
Population density:
| Cadwallader: | 7,744 people per square mile |
| San Jose: | 5,625 people per square mile |
Median household income in 2021:
| Cadwallader: | $138,992 |
| San Jose: | $126,377 |
Median rent in in 2021:
| Cadwallader: | $2,286 |
| San Jose: | $2,001 |
Male vs Females
| Males: | 1,032 |
| Females: | 703 |
Median age
| Males: | 36.2 years |
| Females: | 39.6 years |
Housing prices:
Average estimated value of detached houses in 2021 (94.1% of all units):
| Cadwallader: | $1,112,134 |
| San Jose: | $1,403,256 |
Average estimated value of townhouses or other attached units in 2021 (1.0% of all units):
| This neighborhood: | $668,367 |
| city: | $892,629 |
Most popular occupations of males: sales and office occupations (22.7%); computer and mathematical occupations (20.7%); material moving occupations (9.6%); management occupations (except farmers) (9.5%); healthcare practitioners and technical occupations (6.9%); construction, extraction, and maintenance occupations (6.9%); production occupations (5.6%)
Most popular occupations of females: business and financial operations occupations (28.6%); education, training, and library occupations (15.4%); service occupations (13.0%); healthcare practitioners and technical occupations (10.9%); sales and office occupations (8.5%); management occupations (except farmers) (6.5%); production occupations (6.5%)
Roads and streets: Cadwallader Ave; Suisun Ave; Woodside Ln; San Felipe Rd; Orinda Dr; Keaton Loop; Hillsborough Way; Millbrae Way; Los Altos Dr; Country Vista Ct; Clarebank Way; Blenheim Ln; Tankerland Ct; Woodside Ct; Los Altos Ct; Ramirez Ct; Mc Andrew Ct; Casey Way; Mc Ann Ct; Spruce Rock St; Belgravian Ct; Toy Ln; Woodtree Ct; Yerba Buena Ave; Caterpillar Ct; Aborn Rd.
Other features: Thompson Crk.
Cadwallader neighborhood detailed profile
Cahalan neighborhood in San Jose statistics: (Find on map)
Area: 0.181 square miles
Roads and streets: Calero Ave; Tandera Ave; Cadiz Dr; Cahalan Ave; Moraga Ave; Cabral Ave; Pearlwood Way; Taormino Ave; Fishburne Ave; Pronto Dr; Almeria Dr; Garces Ave; Soltero Dr; Mabie Ct; Terrazzo Ct; Terrazzo Dr; Coralwood Way.
Cahalan neighborhood detailed profile
Area: 0.181 square miles
Roads and streets: Calero Ave; Tandera Ave; Cadiz Dr; Cahalan Ave; Moraga Ave; Cabral Ave; Pearlwood Way; Taormino Ave; Fishburne Ave; Pronto Dr; Almeria Dr; Garces Ave; Soltero Dr; Mabie Ct; Terrazzo Ct; Terrazzo Dr; Coralwood Way.
Cahalan neighborhood detailed profile
Calabazas North neighborhood in San Jose statistics: (Find on map)
Area: 0.359 square miles
Population: 3,038
Population density:
Median household income in 2021:
Median rent in in 2021:
Male vs Females
Median age
Average estimated value of detached houses in 2021 (49.9% of all units):
Most popular occupations of males: computer and mathematical occupations (24.2%); architecture and engineering occupations (18.0%); management occupations (except farmers) (10.1%); sales and office occupations (9.6%); education, training, and library occupations (8.9%); material moving occupations (7.5%); life, physical, and social science occupations (6.9%)
Most popular occupations of females: management occupations (except farmers) (25.0%); sales and office occupations (18.8%); architecture and engineering occupations (11.8%); service occupations (10.9%); education, training, and library occupations (8.8%); computer and mathematical occupations (6.5%); business and financial operations occupations (6.0%)
Roads and streets: Arlington Ln; Weyburn Ln; S Blaney Ave; Bollinger Rd; Chiala Ln; Avondale St; Windsor St; W Riverside Way; Blue Hill Dr; Melvin Dr; Phyllis Ave; Riverside Way; Rainbow Dr; Golden Gate Dr; Bark Ln; Cynthia Ln; Jacqueline Way; Coronado Dr; Galli Dr; Michele Way; Clarendon St; Mason Way; Galli Ct; Crosby Ct; Ventana Pl; Charlene Ct.
Other features: Calabazas Crk.
Calabazas North neighborhood detailed profile
Area: 0.359 square miles
Population: 3,038
Population density:
| Calabazas North: | 8,462 people per square mile |
| San Jose: | 5,625 people per square mile |
Median household income in 2021:
| Calabazas North: | $171,156 |
| San Jose: | $126,377 |
Median rent in in 2021:
| Calabazas North: | $2,424 |
| San Jose: | $2,001 |
Male vs Females
| Males: | 1,519 |
| Females: | 1,519 |
Median age
| Males: | 42.6 years |
| Females: | 44.6 years |
Average estimated value of detached houses in 2021 (49.9% of all units):
| Calabazas North: | $1,873,199 |
| San Jose: | $1,403,256 |
Most popular occupations of males: computer and mathematical occupations (24.2%); architecture and engineering occupations (18.0%); management occupations (except farmers) (10.1%); sales and office occupations (9.6%); education, training, and library occupations (8.9%); material moving occupations (7.5%); life, physical, and social science occupations (6.9%)
Most popular occupations of females: management occupations (except farmers) (25.0%); sales and office occupations (18.8%); architecture and engineering occupations (11.8%); service occupations (10.9%); education, training, and library occupations (8.8%); computer and mathematical occupations (6.5%); business and financial operations occupations (6.0%)
Roads and streets: Arlington Ln; Weyburn Ln; S Blaney Ave; Bollinger Rd; Chiala Ln; Avondale St; Windsor St; W Riverside Way; Blue Hill Dr; Melvin Dr; Phyllis Ave; Riverside Way; Rainbow Dr; Golden Gate Dr; Bark Ln; Cynthia Ln; Jacqueline Way; Coronado Dr; Galli Dr; Michele Way; Clarendon St; Mason Way; Galli Ct; Crosby Ct; Ventana Pl; Charlene Ct.
Other features: Calabazas Crk.
Calabazas North neighborhood detailed profile
Calabazas South neighborhood in San Jose statistics: (Find on map)
Area: 0.121 square miles
Population: 1,154
Population density:
Median household income in 2021:
Median rent in in 2021:
Male vs Females
Median age
Average estimated value of detached houses in 2021 (49.2% of all units):
Most popular occupations of males: computer and mathematical occupations (31.6%); architecture and engineering occupations (22.5%); management occupations (except farmers) (17.2%); sales and office occupations (8.5%); life, physical, and social science occupations (4.7%); education, training, and library occupations (4.7%); service occupations (4.4%)
Most popular occupations of females: sales and office occupations (20.0%); management occupations (except farmers) (15.5%); architecture and engineering occupations (14.3%); business and financial operations occupations (9.8%); education, training, and library occupations (9.3%); life, physical, and social science occupations (7.4%); service occupations (6.8%)
Roads and streets: S Blaney Ave; Calabazas Creek Cir; Dartmoor Way; Kintyre Way; Eddington Pl; Westmoor Way; Windsor Way; Buckthorne Way; Longfellow Way; Devon Way; Mc Gregor Way; Longfellow Ct; Loch Lomond Ln; Rutherford Ave.
Calabazas South neighborhood detailed profile
Area: 0.121 square miles
Population: 1,154
Population density:
| Calabazas South: | 9,513 people per square mile |
| San Jose: | 5,625 people per square mile |
Median household income in 2021:
| Calabazas South: | $197,629 |
| San Jose: | $126,377 |
Median rent in in 2021:
| Calabazas South: | $2,420 |
| San Jose: | $2,001 |
Male vs Females
| Males: | 598 |
| Females: | 556 |
Median age
| Males: | 43.7 years |
| Females: | 44.5 years |
Average estimated value of detached houses in 2021 (49.2% of all units):
| Calabazas South: | $1,932,629 |
| San Jose: | $1,403,256 |
Most popular occupations of males: computer and mathematical occupations (31.6%); architecture and engineering occupations (22.5%); management occupations (except farmers) (17.2%); sales and office occupations (8.5%); life, physical, and social science occupations (4.7%); education, training, and library occupations (4.7%); service occupations (4.4%)
Most popular occupations of females: sales and office occupations (20.0%); management occupations (except farmers) (15.5%); architecture and engineering occupations (14.3%); business and financial operations occupations (9.8%); education, training, and library occupations (9.3%); life, physical, and social science occupations (7.4%); service occupations (6.8%)
Roads and streets: S Blaney Ave; Calabazas Creek Cir; Dartmoor Way; Kintyre Way; Eddington Pl; Westmoor Way; Windsor Way; Buckthorne Way; Longfellow Way; Devon Way; Mc Gregor Way; Longfellow Ct; Loch Lomond Ln; Rutherford Ave.
Calabazas South neighborhood detailed profile
Calderwood neighborhood in San Jose statistics: (Find on map)
Area: 0.114 square miles
Population: 806
Population density:
Median household income in 2021:
Median rent in in 2021:
Male vs Females
Median age
Average estimated value of townhouses or other attached units in 2021 (18.7% of all units):
Most popular occupations of males: computer and mathematical occupations (27.7%); sales and office occupations (16.5%); service occupations (15.2%); transportation occupations (14.6%); architecture and engineering occupations (9.0%); business and financial operations occupations (6.1%); management occupations (except farmers) (3.2%)
Most popular occupations of females: business and financial operations occupations (26.9%); sales and office occupations (25.2%); service occupations (24.0%); healthcare practitioners and technical occupations (11.3%); education, training, and library occupations (6.4%); management occupations (except farmers) (6.2%); life, physical, and social science occupations (2.4%)
Roads and streets: Dentwood Dr; Merrywood Dr; Melwood Dr; Sprucewood Dr; Dellwood Way; Ridgewood Dr; Calderwood Ln; Stanwood Dr.
Calderwood neighborhood detailed profile
Area: 0.114 square miles
Population: 806
Population density:
| Calderwood (Delwood): | 7,092 people per square mile |
| San Jose: | 5,625 people per square mile |
Median household income in 2021:
| Calderwood (Delwood): | $89,522 |
| San Jose: | $126,377 |
Median rent in in 2021:
| Calderwood (Delwood): | $2,048 |
| San Jose: | $2,001 |
Male vs Females
| Males: | 418 |
| Females: | 388 |
Median age
| Males: | 40.0 years |
| Females: | 40.9 years |
Average estimated value of townhouses or other attached units in 2021 (18.7% of all units):
| This neighborhood: | $778,138 |
| city: | $892,629 |
Most popular occupations of males: computer and mathematical occupations (27.7%); sales and office occupations (16.5%); service occupations (15.2%); transportation occupations (14.6%); architecture and engineering occupations (9.0%); business and financial operations occupations (6.1%); management occupations (except farmers) (3.2%)
Most popular occupations of females: business and financial operations occupations (26.9%); sales and office occupations (25.2%); service occupations (24.0%); healthcare practitioners and technical occupations (11.3%); education, training, and library occupations (6.4%); management occupations (except farmers) (6.2%); life, physical, and social science occupations (2.4%)
Roads and streets: Dentwood Dr; Merrywood Dr; Melwood Dr; Sprucewood Dr; Dellwood Way; Ridgewood Dr; Calderwood Ln; Stanwood Dr.
Calderwood neighborhood detailed profile
Calero neighborhood in San Jose statistics: (Find on map)
Area: 0.382 square miles
Population: 2,434
Population density:
Median household income in 2021:
Median rent in in 2021:
Male vs Females
Median age
Average estimated value of detached houses in 2021 (99.2% of all units):
Most popular occupations of males: computer and mathematical occupations (18.1%); management occupations (except farmers) (13.2%); service occupations (13.2%); sales and office occupations (10.3%); transportation occupations (8.7%); production occupations (6.8%); architecture and engineering occupations (6.6%)
Most popular occupations of females: sales and office occupations (25.8%); service occupations (17.4%); education, training, and library occupations (14.8%); healthcare practitioners and technical occupations (14.8%); business and financial operations occupations (5.4%); computer and mathematical occupations (4.5%); management occupations (except farmers) (4.2%)
Roads and streets: Calero Ave; Conestoga Way; Ariel Dr; Shawcroft Dr; Safari Dr; Dunn Ave; Bay St; Santa Teresa Blvd; Surber Dr; Pineland Ave (); Hillbright Cir; Santa Mesa Dr; Sorrel Ave; Tuscarora Dr; Roan St; Lean Ave; Arabian St; Bufkin Dr; Clydesdale Ave; Bridle Way; Mac Adam Ct; Glen Harbor Dr; Bufkin Ct; Manichetti Ct; Pontius Ct; Ridgefarm Dr; Tuscarora Ct; Ariel Ct; Covina Ave; Madison Ct; Hillbright Pl; Arabian Ct; Hillbright Ct; Rachel Ct; Snell Ave.
Calero neighborhood detailed profile
Area: 0.382 square miles
Population: 2,434
Population density:
| Calero: | 6,373 people per square mile |
| San Jose: | 5,625 people per square mile |
Median household income in 2021:
| Calero: | $153,720 |
| San Jose: | $126,377 |
Median rent in in 2021:
| Calero: | $3,248 |
| San Jose: | $2,001 |
Male vs Females
| Males: | 1,192 |
| Females: | 1,241 |
Median age
| Males: | 38.6 years |
| Females: | 37.6 years |
Average estimated value of detached houses in 2021 (99.2% of all units):
| Calero: | $1,101,578 |
| San Jose: | $1,403,256 |
Most popular occupations of males: computer and mathematical occupations (18.1%); management occupations (except farmers) (13.2%); service occupations (13.2%); sales and office occupations (10.3%); transportation occupations (8.7%); production occupations (6.8%); architecture and engineering occupations (6.6%)
Most popular occupations of females: sales and office occupations (25.8%); service occupations (17.4%); education, training, and library occupations (14.8%); healthcare practitioners and technical occupations (14.8%); business and financial operations occupations (5.4%); computer and mathematical occupations (4.5%); management occupations (except farmers) (4.2%)
Roads and streets: Calero Ave; Conestoga Way; Ariel Dr; Shawcroft Dr; Safari Dr; Dunn Ave; Bay St; Santa Teresa Blvd; Surber Dr; Pineland Ave (); Hillbright Cir; Santa Mesa Dr; Sorrel Ave; Tuscarora Dr; Roan St; Lean Ave; Arabian St; Bufkin Dr; Clydesdale Ave; Bridle Way; Mac Adam Ct; Glen Harbor Dr; Bufkin Ct; Manichetti Ct; Pontius Ct; Ridgefarm Dr; Tuscarora Ct; Ariel Ct; Covina Ave; Madison Ct; Hillbright Pl; Arabian Ct; Hillbright Ct; Rachel Ct; Snell Ave.
Calero neighborhood detailed profile
California Maison neighborhood in San Jose statistics: (Find on map)
Area: 0.092 square miles
Population: 432
Population density:
Median household income in 2021:
Median rent in in 2021:
Male vs Females
Median age
Housing prices:
Average estimated value of detached houses in 2021 (82.3% of all units):
Average estimated value of townhouses or other attached units in 2021 (16.9% of all units):
Most popular occupations of males: management occupations (except farmers) (20.8%); sales and office occupations (18.2%); architecture and engineering occupations (9.8%); transportation occupations (9.2%); service occupations (9.0%); production occupations (6.3%); construction, extraction, and maintenance occupations (5.0%)
Most popular occupations of females: service occupations (28.7%); education, training, and library occupations (21.3%); sales and office occupations (20.5%); management occupations (except farmers) (8.2%); production occupations (5.1%); legal occupations (4.9%); business and financial operations occupations (4.8%)
Highways in this neighborhood: US Hwy 101 Bus (State Hwy 82, Monterey Hwy, Monterey Rd).
Roads and streets: Forsum Rd; Prindiville Dr; Urshan Way; Rodling Dr; Gregorich Dr; Menard Dr; Urshan Ct; Forsum Ct; Rodling Way; Yasui Ct; Felice Ct; Prindiville Ct.
California Maison neighborhood detailed profile
Area: 0.092 square miles
Population: 432
Population density:
| California Maison: | 4,716 people per square mile |
| San Jose: | 5,625 people per square mile |
Median household income in 2021:
| California Maison: | $164,486 |
| San Jose: | $126,377 |
Median rent in in 2021:
| California Maison: | $2,850 |
| San Jose: | $2,001 |
Male vs Females
| Males: | 239 |
| Females: | 193 |
Median age
| Males: | 41.2 years |
| Females: | 40.9 years |
Housing prices:
Average estimated value of detached houses in 2021 (82.3% of all units):
| California Maison: | $1,380,096 |
| San Jose: | $1,403,256 |
Average estimated value of townhouses or other attached units in 2021 (16.9% of all units):
| This neighborhood: | $694,723 |
| city: | $892,629 |
Most popular occupations of males: management occupations (except farmers) (20.8%); sales and office occupations (18.2%); architecture and engineering occupations (9.8%); transportation occupations (9.2%); service occupations (9.0%); production occupations (6.3%); construction, extraction, and maintenance occupations (5.0%)
Most popular occupations of females: service occupations (28.7%); education, training, and library occupations (21.3%); sales and office occupations (20.5%); management occupations (except farmers) (8.2%); production occupations (5.1%); legal occupations (4.9%); business and financial operations occupations (4.8%)
Highways in this neighborhood: US Hwy 101 Bus (State Hwy 82, Monterey Hwy, Monterey Rd).
Roads and streets: Forsum Rd; Prindiville Dr; Urshan Way; Rodling Dr; Gregorich Dr; Menard Dr; Urshan Ct; Forsum Ct; Rodling Way; Yasui Ct; Felice Ct; Prindiville Ct.
California Maison neighborhood detailed profile
California Ridge neighborhood in San Jose statistics: (Find on map)
Area: 0.118 square miles
Roads and streets: Chilanian Ln; Shelby Creek Ln; Copper Peak Ln; Charise Ct; Linder Hill Ln; Lindner Hill Ct; Polk Spring Ct; Shelby Creek Ct; Tiffany Hill Way.
California Ridge neighborhood detailed profile
Area: 0.118 square miles
Roads and streets: Chilanian Ln; Shelby Creek Ln; Copper Peak Ln; Charise Ct; Linder Hill Ln; Lindner Hill Ct; Polk Spring Ct; Shelby Creek Ct; Tiffany Hill Way.
California Ridge neighborhood detailed profile
Cambrian Council District neighborhood in San Jose statistics: (Find on map)
Area: 0.734 square miles
Population: 5,807
Population density:
Median household income in 2021:
Median rent in in 2021:
Male vs Females
Median age
Housing prices:
Average estimated value of detached houses in 2021 (71.2% of all units):
Average estimated value of townhouses or other attached units in 2021 (9.6% of all units):
Most popular occupations of males: management occupations (except farmers) (19.9%); sales and office occupations (16.7%); computer and mathematical occupations (14.5%); service occupations (9.9%); architecture and engineering occupations (8.6%); business and financial operations occupations (7.3%); construction, extraction, and maintenance occupations (6.6%)
Most popular occupations of females: sales and office occupations (19.0%); healthcare practitioners and technical occupations (15.8%); service occupations (14.1%); education, training, and library occupations (13.9%); business and financial operations occupations (10.2%); management occupations (except farmers) (8.5%); computer and mathematical occupations (6.1%)
Roads and streets: Foxworthy Ave; Leigh Ave; New Jersey Ave; Lantz Ave; Rustic Dr; Willester Ave; Union Ave; Bernice Way; Geneva St; Pso del Oro; Casa Mia Dr; Borchers Dr; Via Carmen; Assunta Way; Taper Ave; Potrero Dr; Josephine Ave; Abinante Ln; Sun Glory Ln; Hilary Dr; Coit Dr; Fawn Dr; Todd Way; Kobara Ln; Cirone Way; Cambrianna Dr; Trenton Dr; Orange Grove Dr; Kathleen St; Nicholas Dr; Theresa Ln; Sutro Dr; Vivian Ln; Elaine Dr; Varden Ave; Jennifer Way; Benjamin Ave; Evora Dr; Pandora Dr; Pso del Sol; Minna Way; Cody Way; Newark Way; Janet Ave; Browning Ave; Trinity Pl; Byron Way; Casa Nueva Ct; Browning Dr; Briona Ct; Bolla Ct; Veronica Pl; Benjamin Ct; Jessie Ct; Carson Way; Via del Mar.
Cambrian Council District neighborhood detailed profile
Area: 0.734 square miles
Population: 5,807
Population density:
| Cambrian Council District: | 7,910 people per square mile |
| San Jose: | 5,625 people per square mile |
Median household income in 2021:
| Cambrian Council District: | $157,780 |
| San Jose: | $126,377 |
Median rent in in 2021:
| Cambrian Council District: | $2,487 |
| San Jose: | $2,001 |
Male vs Females
| Males: | 2,896 |
| Females: | 2,911 |
Median age
| Males: | 40.8 years |
| Females: | 41.5 years |
Housing prices:
Average estimated value of detached houses in 2021 (71.2% of all units):
| Cambrian Council District: | $1,225,664 |
| San Jose: | $1,403,256 |
Average estimated value of townhouses or other attached units in 2021 (9.6% of all units):
| This neighborhood: | $1,222,366 |
| city: | $892,629 |
Most popular occupations of males: management occupations (except farmers) (19.9%); sales and office occupations (16.7%); computer and mathematical occupations (14.5%); service occupations (9.9%); architecture and engineering occupations (8.6%); business and financial operations occupations (7.3%); construction, extraction, and maintenance occupations (6.6%)
Most popular occupations of females: sales and office occupations (19.0%); healthcare practitioners and technical occupations (15.8%); service occupations (14.1%); education, training, and library occupations (13.9%); business and financial operations occupations (10.2%); management occupations (except farmers) (8.5%); computer and mathematical occupations (6.1%)
Roads and streets: Foxworthy Ave; Leigh Ave; New Jersey Ave; Lantz Ave; Rustic Dr; Willester Ave; Union Ave; Bernice Way; Geneva St; Pso del Oro; Casa Mia Dr; Borchers Dr; Via Carmen; Assunta Way; Taper Ave; Potrero Dr; Josephine Ave; Abinante Ln; Sun Glory Ln; Hilary Dr; Coit Dr; Fawn Dr; Todd Way; Kobara Ln; Cirone Way; Cambrianna Dr; Trenton Dr; Orange Grove Dr; Kathleen St; Nicholas Dr; Theresa Ln; Sutro Dr; Vivian Ln; Elaine Dr; Varden Ave; Jennifer Way; Benjamin Ave; Evora Dr; Pandora Dr; Pso del Sol; Minna Way; Cody Way; Newark Way; Janet Ave; Browning Ave; Trinity Pl; Byron Way; Casa Nueva Ct; Browning Dr; Briona Ct; Bolla Ct; Veronica Pl; Benjamin Ct; Jessie Ct; Carson Way; Via del Mar.
Cambrian Council District neighborhood detailed profile
Candlestick neighborhood in San Jose statistics: (Find on map)
Area: 0.150 square miles
Population: 1,225
Population density:
Median household income in 2021:
Median rent in in 2021:
Male vs Females
Median age
Housing prices:
Average estimated value of detached houses in 2021 (100.0% of all units):
Most popular occupations of males: service occupations (20.3%); construction, extraction, and maintenance occupations (16.4%); production occupations (15.7%); sales and office occupations (10.6%); architecture and engineering occupations (8.3%); arts, design, entertainment, sports, and media occupations (4.0%); management occupations (except farmers) (3.8%)
Most popular occupations of females: service occupations (26.4%); sales and office occupations (24.2%); education, training, and library occupations (17.2%); production occupations (9.9%); healthcare practitioners and technical occupations (7.7%); management occupations (except farmers) (6.7%); business and financial operations occupations (3.0%)
Roads and streets: Hobie Ln; Feller Ave; Davenport Dr; Candlestick Way; Townsquare Dr; Fleming Ave; Jerilyn Dr; Giant Way; Buckner Dr; Story Rd; Dominick Way; Mahoney Dr; Gerard Way; Loes Way; Donald Ct; Louis Ct; Glasgow Ct; Dominick Ct; Heirloom Ct; Marchant Ct.
Candlestick neighborhood detailed profile
Area: 0.150 square miles
Population: 1,225
Population density:
| Candlestick: | 8,153 people per square mile |
| San Jose: | 5,625 people per square mile |
Median household income in 2021:
| Candlestick: | $144,871 |
| San Jose: | $126,377 |
Median rent in in 2021:
| Candlestick: | $2,596 |
| San Jose: | $2,001 |
Male vs Females
| Males: | 657 |
| Females: | 568 |
Median age
| Males: | 42.6 years |
| Females: | 45.4 years |
Housing prices:
Average estimated value of detached houses in 2021 (100.0% of all units):
| Candlestick: | $803,180 |
| San Jose: | $1,403,256 |
Most popular occupations of males: service occupations (20.3%); construction, extraction, and maintenance occupations (16.4%); production occupations (15.7%); sales and office occupations (10.6%); architecture and engineering occupations (8.3%); arts, design, entertainment, sports, and media occupations (4.0%); management occupations (except farmers) (3.8%)
Most popular occupations of females: service occupations (26.4%); sales and office occupations (24.2%); education, training, and library occupations (17.2%); production occupations (9.9%); healthcare practitioners and technical occupations (7.7%); management occupations (except farmers) (6.7%); business and financial operations occupations (3.0%)
Roads and streets: Hobie Ln; Feller Ave; Davenport Dr; Candlestick Way; Townsquare Dr; Fleming Ave; Jerilyn Dr; Giant Way; Buckner Dr; Story Rd; Dominick Way; Mahoney Dr; Gerard Way; Loes Way; Donald Ct; Louis Ct; Glasgow Ct; Dominick Ct; Heirloom Ct; Marchant Ct.
Candlestick neighborhood detailed profile
Canoas East neighborhood in San Jose statistics: (Find on map)
Area: 0.180 square miles
Roads and streets: Blossom Ave; Indian Ave; Shawnee Ln; Montalvo Dr; Azule Ave; Laguna Seca Way; Palm Springs Cir; Calero Ave; el Sereno Dr; Jacques Dr; Briarcliff Dr; Gettysburg Dr; Santa Teresa Blvd; Laguna Seca Ct; Colter Pl; Uvas Ct; Apache Ct; Navajo Ct; Iroquois Ct; Seneca Ct; Osage Ct.
Canoas East neighborhood detailed profile
Canoas Garden neighborhood in San Jose statistics: (Find on map)
Area: 0.187 square miles
Population: 1,244
Population density:
Median household income in 2021:
Median rent in in 2021:
Male vs Females
Median age
Housing prices:
Average estimated value of detached houses in 2021 (62.0% of all units):
Average estimated value of townhouses or other attached units in 2021 (5.8% of all units):
Most popular occupations of males: management occupations (except farmers) (32.3%); service occupations (30.8%); computer and mathematical occupations (11.7%); architecture and engineering occupations (7.2%); business and financial operations occupations (5.6%); sales and office occupations (3.2%); education, training, and library occupations (2.8%)
Most popular occupations of females: education, training, and library occupations (27.4%); service occupations (18.1%); management occupations (except farmers) (15.8%); sales and office occupations (9.6%); business and financial operations occupations (9.2%); arts, design, entertainment, sports, and media occupations (7.4%); healthcare practitioners and technical occupations (3.0%)
Roads and streets: Kingfisher Dr; Skylark Dr; Hummingbird Dr; Redbird Dr; Wren Dr; Nightingale Dr; Rinconada Dr; Thrush Dr; Ironwood Dr; Bluejay Dr; Pebble Beach Dr; Lanewood Dr; Bobolink Dr; Apple Valley Dr; Thrush Ct; Lanewood Ct; Pebble Beach Ct.
Other features: Canoas Crk.
Canoas Garden neighborhood detailed profile
Area: 0.187 square miles
Population: 1,244
Population density:
| Canoas Garden: | 6,636 people per square mile |
| San Jose: | 5,625 people per square mile |
Median household income in 2021:
| Canoas Garden: | $128,604 |
| San Jose: | $126,377 |
Median rent in in 2021:
| Canoas Garden: | $1,798 |
| San Jose: | $2,001 |
Male vs Females
| Males: | 590 |
| Females: | 654 |
Median age
| Males: | 43.0 years |
| Females: | 40.1 years |
Housing prices:
Average estimated value of detached houses in 2021 (62.0% of all units):
| Canoas Garden: | $1,644,012 |
| San Jose: | $1,403,256 |
Average estimated value of townhouses or other attached units in 2021 (5.8% of all units):
| This neighborhood: | $901,977 |
| city: | $892,629 |
Most popular occupations of males: management occupations (except farmers) (32.3%); service occupations (30.8%); computer and mathematical occupations (11.7%); architecture and engineering occupations (7.2%); business and financial operations occupations (5.6%); sales and office occupations (3.2%); education, training, and library occupations (2.8%)
Most popular occupations of females: education, training, and library occupations (27.4%); service occupations (18.1%); management occupations (except farmers) (15.8%); sales and office occupations (9.6%); business and financial operations occupations (9.2%); arts, design, entertainment, sports, and media occupations (7.4%); healthcare practitioners and technical occupations (3.0%)
Roads and streets: Kingfisher Dr; Skylark Dr; Hummingbird Dr; Redbird Dr; Wren Dr; Nightingale Dr; Rinconada Dr; Thrush Dr; Ironwood Dr; Bluejay Dr; Pebble Beach Dr; Lanewood Dr; Bobolink Dr; Apple Valley Dr; Thrush Ct; Lanewood Ct; Pebble Beach Ct.
Other features: Canoas Crk.
Canoas Garden neighborhood detailed profile
Canoas West neighborhood in San Jose statistics: (Find on map)
Area: 0.273 square miles
Roads and streets: Chesbro Ave; Loma Prieta Dr; Bolivar Dr; Alamo Dr; Chemeketa Dr; Calero Ave; Montevino Dr; el Sombroso Dr; Natoma Dr; Alcazar Dr; Lalor Dr; Vonna Ct; Estonia Ct; Enriquita Ct; Martinique Ct; Salida del Sol; Saxony Ct; Solito Ct; Vereda Ct.
Canoas West neighborhood detailed profile
Capewood neighborhood in San Jose statistics: (Find on map)
Area: 0.179 square miles
Population: 1,426
Population density:
Median household income in 2021:
Median rent in in 2021:
Male vs Females
Median age
Housing prices:
Average estimated value of detached houses in 2021 (88.4% of all units):
Average estimated value of townhouses or other attached units in 2021 (13.7% of all units):
Average estimated '21 value of housing units in 3-to-4-unit structures (5.6% of all units):
Most popular occupations of males: computer and mathematical occupations (22.5%); sales and office occupations (12.4%); architecture and engineering occupations (11.6%); management occupations (except farmers) (10.2%); business and financial operations occupations (7.8%); healthcare practitioners and technical occupations (6.6%); service occupations (6.2%)
Most popular occupations of females: service occupations (24.0%); sales and office occupations (18.9%); education, training, and library occupations (10.4%); computer and mathematical occupations (9.0%); management occupations (except farmers) (8.0%); business and financial operations occupations (6.7%); healthcare practitioners and technical occupations (5.4%)
Roads and streets: Capewood Ln; Postwood Dr; Junewood Ave; Amberwood Ln; Fallwood Ln; Meadowgate Way; Cropley Ave; Via Encinitas; Via del Sol; Morrill Ave; Camargo Dr; Via Montez; Suttergate Way; Rosario Dr; Via del Coronado; Kingsgate Ct; Spanishgate Ct; Via Encinitos Ct; Rosario Ct; Amberwood Ct; Plz Montez; Suttergate Ct; Spanish Ct; Juarez Ct; Capewood Ct.
Other features: Berryessa Crk.
Capewood neighborhood detailed profile
Area: 0.179 square miles
Population: 1,426
Population density:
| Capewood: | 7,986 people per square mile |
| San Jose: | 5,625 people per square mile |
Median household income in 2021:
| Capewood: | $160,824 |
| San Jose: | $126,377 |
Median rent in in 2021:
| Capewood: | $2,453 |
| San Jose: | $2,001 |
Male vs Females
| Males: | 724 |
| Females: | 702 |
Median age
| Males: | 41.8 years |
| Females: | 44.6 years |
Housing prices:
Average estimated value of detached houses in 2021 (88.4% of all units):
| Capewood: | $1,076,182 |
| San Jose: | $1,403,256 |
Average estimated value of townhouses or other attached units in 2021 (13.7% of all units):
| This neighborhood: | $343,624 |
| city: | $892,629 |
Average estimated '21 value of housing units in 3-to-4-unit structures (5.6% of all units):
| Capewood: | $1,563,142 |
| city: | $680,453 |
Most popular occupations of males: computer and mathematical occupations (22.5%); sales and office occupations (12.4%); architecture and engineering occupations (11.6%); management occupations (except farmers) (10.2%); business and financial operations occupations (7.8%); healthcare practitioners and technical occupations (6.6%); service occupations (6.2%)
Most popular occupations of females: service occupations (24.0%); sales and office occupations (18.9%); education, training, and library occupations (10.4%); computer and mathematical occupations (9.0%); management occupations (except farmers) (8.0%); business and financial operations occupations (6.7%); healthcare practitioners and technical occupations (5.4%)
Roads and streets: Capewood Ln; Postwood Dr; Junewood Ave; Amberwood Ln; Fallwood Ln; Meadowgate Way; Cropley Ave; Via Encinitas; Via del Sol; Morrill Ave; Camargo Dr; Via Montez; Suttergate Way; Rosario Dr; Via del Coronado; Kingsgate Ct; Spanishgate Ct; Via Encinitos Ct; Rosario Ct; Amberwood Ct; Plz Montez; Suttergate Ct; Spanish Ct; Juarez Ct; Capewood Ct.
Other features: Berryessa Crk.
Capewood neighborhood detailed profile
Capitol neighborhood in San Jose statistics: (Find on map)
Area: 0.144 square miles
Population: 888
Population density:
Median household income in 2021:
Median rent in in 2021:
Male vs Females
Median age
Average estimated value of detached houses in 2021 (46.4% of all units):
Most popular occupations of males: construction, extraction, and maintenance occupations (34.1%); service occupations (22.2%); computer and mathematical occupations (17.6%); production occupations (15.4%); sales and office occupations (12.4%); management occupations (except farmers) (10.5%); material moving occupations (9.0%)
Most popular occupations of females: sales and office occupations (22.0%); production occupations (18.8%); management occupations (except farmers) (16.0%); service occupations (15.9%); education, training, and library occupations (15.1%); architecture and engineering occupations (8.3%); healthcare practitioners and technical occupations (5.9%)
Limited-access highways (interstate or state) in this neighborhood: Capitol Expy (E Capitol Expy).
Roads and streets: Bambi Ln; Sleepy Hollow Ln; Cotton Tail Ave; Van Winkle Ln; Peter Pan Ave; Galahad Ave; S Capitol Ave; Sinbad Ave; Bagdhad Pl; Lilliput Ln; Cinderella Ln.
Capitol neighborhood detailed profile
Area: 0.144 square miles
Population: 888
Population density:
| Capitol (Goss): | 6,147 people per square mile |
| San Jose: | 5,625 people per square mile |
Median household income in 2021:
| Capitol (Goss): | $122,877 |
| San Jose: | $126,377 |
Median rent in in 2021:
| Capitol (Goss): | $2,207 |
| San Jose: | $2,001 |
Male vs Females
| Males: | 505 |
| Females: | 382 |
Median age
| Males: | 31.5 years |
| Females: | 40.0 years |
Average estimated value of detached houses in 2021 (46.4% of all units):
| Capitol (Goss): | $713,850 |
| San Jose: | $1,403,256 |
Most popular occupations of males: construction, extraction, and maintenance occupations (34.1%); service occupations (22.2%); computer and mathematical occupations (17.6%); production occupations (15.4%); sales and office occupations (12.4%); management occupations (except farmers) (10.5%); material moving occupations (9.0%)
Most popular occupations of females: sales and office occupations (22.0%); production occupations (18.8%); management occupations (except farmers) (16.0%); service occupations (15.9%); education, training, and library occupations (15.1%); architecture and engineering occupations (8.3%); healthcare practitioners and technical occupations (5.9%)
Limited-access highways (interstate or state) in this neighborhood: Capitol Expy (E Capitol Expy).
Roads and streets: Bambi Ln; Sleepy Hollow Ln; Cotton Tail Ave; Van Winkle Ln; Peter Pan Ave; Galahad Ave; S Capitol Ave; Sinbad Ave; Bagdhad Pl; Lilliput Ln; Cinderella Ln.
Capitol neighborhood detailed profile
Carlton neighborhood in San Jose statistics: (Find on map)
Area: 0.213 square miles
Population: 1,562
Population density:
Median household income in 2021:
Median rent in in 2021:
Male vs Females
Median age
Housing prices:
Average estimated value of detached houses in 2021 (76.9% of all units):
Average estimated value of townhouses or other attached units in 2021 (1.3% of all units):
Most popular occupations of males: sales and office occupations (27.0%); management occupations (except farmers) (20.0%); healthcare practitioners and technical occupations (12.4%); service occupations (8.3%); computer and mathematical occupations (7.9%); architecture and engineering occupations (7.1%); business and financial operations occupations (5.4%)
Most popular occupations of females: sales and office occupations (26.0%); education, training, and library occupations (25.8%); healthcare practitioners and technical occupations (17.2%); management occupations (except farmers) (14.4%); business and financial operations occupations (4.9%); service occupations (4.4%); arts, design, entertainment, sports, and media occupations (3.4%)
Roads and streets: Carlton Ave; Elester Dr; Adair Way; Saidel Dr; Lost Oaks Dr; Clydelle Ave; Redstone Dr; Samaritan Dr; Venndale Ave; Venn Ave; Kinghurst Dr (Kinghurst Way); Winton Way; Adonis Way; Wilma Way; Kingbrook Dr; Kingwood Way; Kingdale Dr; Los Gatos Almaden Rd; Marr Ln; Kingridge Dr; Kingfield Way; Hatfield Walkway.
Carlton neighborhood detailed profile
Area: 0.213 square miles
Population: 1,562
Population density:
| Carlton: | 7,330 people per square mile |
| San Jose: | 5,625 people per square mile |
Median household income in 2021:
| Carlton: | $198,992 |
| San Jose: | $126,377 |
Median rent in in 2021:
| Carlton: | $3,033 |
| San Jose: | $2,001 |
Male vs Females
| Males: | 862 |
| Females: | 699 |
Median age
| Males: | 42.7 years |
| Females: | 40.0 years |
Housing prices:
Average estimated value of detached houses in 2021 (76.9% of all units):
| Carlton: | $1,681,438 |
| San Jose: | $1,403,256 |
Average estimated value of townhouses or other attached units in 2021 (1.3% of all units):
| This neighborhood: | $909,054 |
| city: | $892,629 |
Most popular occupations of males: sales and office occupations (27.0%); management occupations (except farmers) (20.0%); healthcare practitioners and technical occupations (12.4%); service occupations (8.3%); computer and mathematical occupations (7.9%); architecture and engineering occupations (7.1%); business and financial operations occupations (5.4%)
Most popular occupations of females: sales and office occupations (26.0%); education, training, and library occupations (25.8%); healthcare practitioners and technical occupations (17.2%); management occupations (except farmers) (14.4%); business and financial operations occupations (4.9%); service occupations (4.4%); arts, design, entertainment, sports, and media occupations (3.4%)
Roads and streets: Carlton Ave; Elester Dr; Adair Way; Saidel Dr; Lost Oaks Dr; Clydelle Ave; Redstone Dr; Samaritan Dr; Venndale Ave; Venn Ave; Kinghurst Dr (Kinghurst Way); Winton Way; Adonis Way; Wilma Way; Kingbrook Dr; Kingwood Way; Kingdale Dr; Los Gatos Almaden Rd; Marr Ln; Kingridge Dr; Kingfield Way; Hatfield Walkway.
Carlton neighborhood detailed profile
Carmine neighborhood in San Jose statistics: (Find on map)
Area: 0.128 square miles
Population: 657
Population density:
Median household income in 2021:
Median rent in in 2021:
Male vs Females
Median age
Housing prices:
Average estimated value of detached houses in 2021 (28.3% of all units):
Average estimated value of townhouses or other attached units in 2021 (23.6% of all units):
Average estimated '21 value of housing units in 3-to-4-unit structures (11.2% of all units):
Average estimated '21 value of housing units in 5-or-more-unit structures (3.1% of all units):
Most popular occupations of males: computer and mathematical occupations (31.4%); architecture and engineering occupations (13.4%); sales and office occupations (12.4%); construction, extraction, and maintenance occupations (10.5%); management occupations (except farmers) (8.5%); service occupations (8.3%); production occupations (7.5%)
Most popular occupations of females: business and financial operations occupations (23.9%); sales and office occupations (22.3%); management occupations (except farmers) (11.8%); production occupations (11.7%); computer and mathematical occupations (11.2%); arts, design, entertainment, sports, and media occupations (6.5%); healthcare practitioners and technical occupations (3.3%)
Roads and streets: Sajak Ave; Mission Springs Cir; Adolfo Dr; Oyama Dr; Deluca Dr; Carmine Way; Nobu Dr; Goody Ln; Shanghai Cir; Chihong Dr; Oyama Pl; Ringwood Ave; Tainan Dr; Formosa Dr; Theo Dr; Laveille Ct; Vanna Ct; Carnavon Way; Loo Ln; Hong Kong Dr; Peiking Dr; Taipei Dr; Zeka Dr; Lundy Ave; Lefont Dr; Shanghai Ct; Mission Springs Ct; Tainan Pl; Tainan Ct.
Carmine neighborhood detailed profile
Area: 0.128 square miles
Population: 657
Population density:
| Carmine (Parkmont): | 5,135 people per square mile |
| San Jose: | 5,625 people per square mile |
Median household income in 2021:
| Carmine (Parkmont): | $150,662 |
| San Jose: | $126,377 |
Median rent in in 2021:
| Carmine (Parkmont): | $2,490 |
| San Jose: | $2,001 |
Male vs Females
| Males: | 365 |
| Females: | 291 |
Median age
| Males: | 36.6 years |
| Females: | 46.3 years |
Housing prices:
Average estimated value of detached houses in 2021 (28.3% of all units):
| Carmine (Parkmont): | $1,328,962 |
| San Jose: | $1,403,256 |
Average estimated value of townhouses or other attached units in 2021 (23.6% of all units):
| This neighborhood: | $783,272 |
| city: | $892,629 |
Average estimated '21 value of housing units in 3-to-4-unit structures (11.2% of all units):
| Carmine (Parkmont): | $633,807 |
| city: | $680,453 |
Average estimated '21 value of housing units in 5-or-more-unit structures (3.1% of all units):
| Carmine (Parkmont): | $565,857 |
| San Jose: | $688,625 |
Most popular occupations of males: computer and mathematical occupations (31.4%); architecture and engineering occupations (13.4%); sales and office occupations (12.4%); construction, extraction, and maintenance occupations (10.5%); management occupations (except farmers) (8.5%); service occupations (8.3%); production occupations (7.5%)
Most popular occupations of females: business and financial operations occupations (23.9%); sales and office occupations (22.3%); management occupations (except farmers) (11.8%); production occupations (11.7%); computer and mathematical occupations (11.2%); arts, design, entertainment, sports, and media occupations (6.5%); healthcare practitioners and technical occupations (3.3%)
Roads and streets: Sajak Ave; Mission Springs Cir; Adolfo Dr; Oyama Dr; Deluca Dr; Carmine Way; Nobu Dr; Goody Ln; Shanghai Cir; Chihong Dr; Oyama Pl; Ringwood Ave; Tainan Dr; Formosa Dr; Theo Dr; Laveille Ct; Vanna Ct; Carnavon Way; Loo Ln; Hong Kong Dr; Peiking Dr; Taipei Dr; Zeka Dr; Lundy Ave; Lefont Dr; Shanghai Ct; Mission Springs Ct; Tainan Pl; Tainan Ct.
Carmine neighborhood detailed profile
Carol Drive neighborhood in San Jose statistics: (Find on map)
Area: 0.050 square miles
Roads and streets: Carol Dr.
Carol Drive neighborhood detailed profile
Area: 0.050 square miles
Roads and streets: Carol Dr.
Carol Drive neighborhood detailed profile
Carson neighborhood in San Jose statistics: (Find on map)
Area: 0.302 square miles
Population: 2,139
Population density:
Median household income in 2021:
Median rent in in 2021:
Male vs Females
Median age
Housing prices:
Average estimated value of detached houses in 2021 (94.9% of all units):
Average estimated value of townhouses or other attached units in 2021 (28.0% of all units):
Average estimated value of mobile home in 2021 (30.4% of all units):
Most popular occupations of males: management occupations (except farmers) (25.1%); sales and office occupations (20.6%); material moving occupations (13.2%); transportation occupations (9.1%); production occupations (8.8%); education, training, and library occupations (4.7%); business and financial operations occupations (4.5%)
Most popular occupations of females: service occupations (26.0%); sales and office occupations (20.8%); education, training, and library occupations (11.4%); arts, design, entertainment, sports, and media occupations (11.2%); healthcare practitioners and technical occupations (11.0%); management occupations (except farmers) (10.2%); business and financial operations occupations (6.1%)
Limited-access highways (interstate or state) in this neighborhood: Guadalupe Fwy (State Hwy 87).
Roads and streets: Edelweiss Dr; Albion Dr; Narvaez Ave; Indigo Dr; Lanfair Cir; Lanfair Dr; Bluefield Dr; Meg Dr; Jonquil Dr; Yolo Dr; Thistle Dr; Agatha Way; Meadow Creek Dr; Faye Park Dr; Luneta Dr; Amanda Dr; Bliss Ct; Meadow Dale Ct; Bridget Dr; Cassaday Ct; Lux Ct; Luneta Ct; Britwell Ct; Heatherbray Ct; Albion Ct; Carlotta Ct; Taubeh Ct; Yolo Ct; Bluefield Ct; Lanfair Ct; Sarah Ct; Dagmar Ct; Naomi Ct.
Railroad features: Union Pacific RR.
Other features: Canoas Crk.
Carson neighborhood detailed profile
Area: 0.302 square miles
Population: 2,139
Population density:
| Carson: | 7,091 people per square mile |
| San Jose: | 5,625 people per square mile |
Median household income in 2021:
| Carson: | $126,659 |
| San Jose: | $126,377 |
Median rent in in 2021:
| Carson: | $2,592 |
| San Jose: | $2,001 |
Male vs Females
| Males: | 1,093 |
| Females: | 1,045 |
Median age
| Males: | 37.9 years |
| Females: | 38.9 years |
Housing prices:
Average estimated value of detached houses in 2021 (94.9% of all units):
| Carson: | $1,066,209 |
| San Jose: | $1,403,256 |
Average estimated value of townhouses or other attached units in 2021 (28.0% of all units):
| This neighborhood: | $934,624 |
| city: | $892,629 |
Average estimated value of mobile home in 2021 (30.4% of all units):
| Carson: | $136,711 |
| San Jose: | $240,963 |
Most popular occupations of males: management occupations (except farmers) (25.1%); sales and office occupations (20.6%); material moving occupations (13.2%); transportation occupations (9.1%); production occupations (8.8%); education, training, and library occupations (4.7%); business and financial operations occupations (4.5%)
Most popular occupations of females: service occupations (26.0%); sales and office occupations (20.8%); education, training, and library occupations (11.4%); arts, design, entertainment, sports, and media occupations (11.2%); healthcare practitioners and technical occupations (11.0%); management occupations (except farmers) (10.2%); business and financial operations occupations (6.1%)
Limited-access highways (interstate or state) in this neighborhood: Guadalupe Fwy (State Hwy 87).
Roads and streets: Edelweiss Dr; Albion Dr; Narvaez Ave; Indigo Dr; Lanfair Cir; Lanfair Dr; Bluefield Dr; Meg Dr; Jonquil Dr; Yolo Dr; Thistle Dr; Agatha Way; Meadow Creek Dr; Faye Park Dr; Luneta Dr; Amanda Dr; Bliss Ct; Meadow Dale Ct; Bridget Dr; Cassaday Ct; Lux Ct; Luneta Ct; Britwell Ct; Heatherbray Ct; Albion Ct; Carlotta Ct; Taubeh Ct; Yolo Ct; Bluefield Ct; Lanfair Ct; Sarah Ct; Dagmar Ct; Naomi Ct.
Railroad features: Union Pacific RR.
Other features: Canoas Crk.
Carson neighborhood detailed profile
Cassell neighborhood in San Jose statistics: (Find on map)
Area: 0.214 square miles
Population: 3,197
Population density:
Median household income in 2021:
Median rent in in 2021:
Male vs Females
Median age
Average estimated value of detached houses in 2021 (94.9% of all units):
Most popular occupations of males: service occupations (20.8%); production occupations (20.1%); sales and office occupations (15.2%); construction, extraction, and maintenance occupations (11.0%); material moving occupations (6.6%); transportation occupations (4.9%); management occupations (except farmers) (4.6%)
Most popular occupations of females: service occupations (31.1%); production occupations (17.4%); sales and office occupations (16.0%); management occupations (except farmers) (7.2%); business and financial operations occupations (6.9%); healthcare practitioners and technical occupations (4.9%); architecture and engineering occupations (4.2%)
Limited-access highways (interstate or state) in this neighborhood: E Capitol Expy (Capitol Expy).
Roads and streets: Story Rd; Adrian Way; Leeward Dr; Poplar Dr; Tallahassee Dr; Brenford Dr; Barlow Ave; Gainesville Ave; Dumont Cir; Amador Dr; Samoa Way; Arden Way; Logsden Way; Wenlock Dr; Chant Ct; Galahad Ave; Foxdale Loop; Berona Way; Galahad Ct; Dumont Ct; Leeward Ct; Amador Ct.
Cassell neighborhood detailed profile
Area: 0.214 square miles
Population: 3,197
Population density:
| Cassell: | 14,921 people per square mile |
| San Jose: | 5,625 people per square mile |
Median household income in 2021:
| Cassell: | $108,685 |
| San Jose: | $126,377 |
Median rent in in 2021:
| Cassell: | $2,523 |
| San Jose: | $2,001 |
Male vs Females
| Males: | 1,701 |
| Females: | 1,496 |
Median age
| Males: | 31.6 years |
| Females: | 34.7 years |
Average estimated value of detached houses in 2021 (94.9% of all units):
| Cassell: | $692,410 |
| San Jose: | $1,403,256 |
Most popular occupations of males: service occupations (20.8%); production occupations (20.1%); sales and office occupations (15.2%); construction, extraction, and maintenance occupations (11.0%); material moving occupations (6.6%); transportation occupations (4.9%); management occupations (except farmers) (4.6%)
Most popular occupations of females: service occupations (31.1%); production occupations (17.4%); sales and office occupations (16.0%); management occupations (except farmers) (7.2%); business and financial operations occupations (6.9%); healthcare practitioners and technical occupations (4.9%); architecture and engineering occupations (4.2%)
Limited-access highways (interstate or state) in this neighborhood: E Capitol Expy (Capitol Expy).
Roads and streets: Story Rd; Adrian Way; Leeward Dr; Poplar Dr; Tallahassee Dr; Brenford Dr; Barlow Ave; Gainesville Ave; Dumont Cir; Amador Dr; Samoa Way; Arden Way; Logsden Way; Wenlock Dr; Chant Ct; Galahad Ave; Foxdale Loop; Berona Way; Galahad Ct; Dumont Ct; Leeward Ct; Amador Ct.
Cassell neighborhood detailed profile
Castlemont neighborhood in San Jose statistics: (Find on map)
Area: 0.185 square miles
Population: 1,228
Population density:
Median household income in 2021:
Median rent in in 2021:
Male vs Females
Median age
Average estimated value of detached houses in 2021 (33.3% of all units):
Most popular occupations of males: computer and mathematical occupations (16.2%); business and financial operations occupations (12.4%); production occupations (12.4%); management occupations (except farmers) (11.8%); architecture and engineering occupations (10.5%); service occupations (10.2%); sales and office occupations (9.5%)
Most popular occupations of females: sales and office occupations (36.0%); management occupations (except farmers) (19.6%); healthcare practitioners and technical occupations (14.1%); business and financial operations occupations (10.6%); community and social services occupations (5.1%); legal occupations (4.1%); service occupations (3.1%)
Roads and streets: Greenbriar Ave; Castlemont Ave; Driftwood Dr; Westfield Ave; Payne Ave; Fireside Dr; Woodlawn Ave; Redoaks Dr; Neet Ave; Greentree Way; Barkwood Way; Walgrove Way; Teakwood Dr; Greenbriar Ct; San Filippo Ct.
Castlemont neighborhood detailed profile
Area: 0.185 square miles
Population: 1,228
Population density:
| Castlemont: | 6,651 people per square mile |
| San Jose: | 5,625 people per square mile |
Median household income in 2021:
| Castlemont: | $111,377 |
| San Jose: | $126,377 |
Median rent in in 2021:
| Castlemont: | $2,292 |
| San Jose: | $2,001 |
Male vs Females
| Males: | 587 |
| Females: | 641 |
Median age
| Males: | 42.7 years |
| Females: | 39.7 years |
Average estimated value of detached houses in 2021 (33.3% of all units):
| Castlemont: | $1,330,313 |
| San Jose: | $1,403,256 |
Most popular occupations of males: computer and mathematical occupations (16.2%); business and financial operations occupations (12.4%); production occupations (12.4%); management occupations (except farmers) (11.8%); architecture and engineering occupations (10.5%); service occupations (10.2%); sales and office occupations (9.5%)
Most popular occupations of females: sales and office occupations (36.0%); management occupations (except farmers) (19.6%); healthcare practitioners and technical occupations (14.1%); business and financial operations occupations (10.6%); community and social services occupations (5.1%); legal occupations (4.1%); service occupations (3.1%)
Roads and streets: Greenbriar Ave; Castlemont Ave; Driftwood Dr; Westfield Ave; Payne Ave; Fireside Dr; Woodlawn Ave; Redoaks Dr; Neet Ave; Greentree Way; Barkwood Way; Walgrove Way; Teakwood Dr; Greenbriar Ct; San Filippo Ct.
Castlemont neighborhood detailed profile
Castro neighborhood in San Jose statistics: (Find on map)
Area: 0.174 square miles
Population: 1,112
Population density:
Median household income in 2021:
Median rent in in 2021:
Male vs Females
Median age
Housing prices:
Average estimated value of detached houses in 2021 (50.5% of all units):
Average estimated value of townhouses or other attached units in 2021 (3.6% of all units):
Average estimated value of housing units in 2-unit structures in 2021 (5.4% of all units):
Average estimated '21 value of housing units in 3-to-4-unit structures (9.4% of all units):
Most popular occupations of males: sales and office occupations (16.5%); management occupations (except farmers) (12.4%); computer and mathematical occupations (11.5%); service occupations (9.8%); construction, extraction, and maintenance occupations (9.1%); architecture and engineering occupations (8.2%); business and financial operations occupations (7.2%)
Most popular occupations of females: service occupations (17.4%); sales and office occupations (16.1%); education, training, and library occupations (14.4%); management occupations (except farmers) (11.2%); business and financial operations occupations (10.5%); computer and mathematical occupations (8.3%); production occupations (5.3%)
Roads and streets: Fallbrook Ave; Duvall Dr; Castro Dr; Latimer Ave; Mossbrook Cir; Student Ln; Mossbrook Ave; Parkwest Dr; W Campbell Ave; Sagemont Ave; Calado Ave; Rio Serena Ave.
Castro neighborhood detailed profile
Area: 0.174 square miles
Population: 1,112
Population density:
| Castro: | 6,406 people per square mile |
| San Jose: | 5,625 people per square mile |
Median household income in 2021:
| Castro: | $149,513 |
| San Jose: | $126,377 |
Median rent in in 2021:
| Castro: | $2,096 |
| San Jose: | $2,001 |
Male vs Females
| Males: | 569 |
| Females: | 542 |
Median age
| Males: | 39.4 years |
| Females: | 40.5 years |
Housing prices:
Average estimated value of detached houses in 2021 (50.5% of all units):
| Castro: | $1,496,485 |
| San Jose: | $1,403,256 |
Average estimated value of townhouses or other attached units in 2021 (3.6% of all units):
| This neighborhood: | $1,290,833 |
| city: | $892,629 |
Average estimated value of housing units in 2-unit structures in 2021 (5.4% of all units):
| This neighborhood: | $2,469,023 |
| San Jose: | $753,788 |
Average estimated '21 value of housing units in 3-to-4-unit structures (9.4% of all units):
| Castro: | $1,027,429 |
| city: | $680,453 |
Most popular occupations of males: sales and office occupations (16.5%); management occupations (except farmers) (12.4%); computer and mathematical occupations (11.5%); service occupations (9.8%); construction, extraction, and maintenance occupations (9.1%); architecture and engineering occupations (8.2%); business and financial operations occupations (7.2%)
Most popular occupations of females: service occupations (17.4%); sales and office occupations (16.1%); education, training, and library occupations (14.4%); management occupations (except farmers) (11.2%); business and financial operations occupations (10.5%); computer and mathematical occupations (8.3%); production occupations (5.3%)
Roads and streets: Fallbrook Ave; Duvall Dr; Castro Dr; Latimer Ave; Mossbrook Cir; Student Ln; Mossbrook Ave; Parkwest Dr; W Campbell Ave; Sagemont Ave; Calado Ave; Rio Serena Ave.
Castro neighborhood detailed profile
Cataldi neighborhood in San Jose statistics: (Find on map)
Area: 0.361 square miles
Population: 3,052
Population density:
Median household income in 2021:
Median rent in in 2021:
Male vs Females
Median age
Housing prices:
Average estimated value of detached houses in 2021 (99.0% of all units):
Average estimated value of townhouses or other attached units in 2021 (2.0% of all units):
Average estimated '21 value of housing units in 5-or-more-unit structures (2.4% of all units):
Most popular occupations of males: computer and mathematical occupations (15.5%); sales and office occupations (13.8%); management occupations (except farmers) (13.7%); architecture and engineering occupations (10.6%); service occupations (10.4%); business and financial operations occupations (8.4%); production occupations (7.9%)
Most popular occupations of females: sales and office occupations (19.7%); service occupations (13.8%); computer and mathematical occupations (13.0%); management occupations (except farmers) (11.4%); business and financial operations occupations (8.4%); education, training, and library occupations (7.4%); healthcare practitioners and technical occupations (7.1%)
Roads and streets: Bethany Ave; Morrill Ave; Agua Vista Dr; Hostetter Rd; Camargo Dr; Middleborough Cir; Peachwood Dr; Babe Ruth Dr; Garvey Pl; Wexford Dr; Trudean Way; Mignon Dr; Cohansey Dr; Cataldi Dr; Swanston Way; Largo Dr; Daltrey Way; Tobin Dr; Valhalla Dr; Camacho Way; Kesey Ln; Gillian Way; Mc Cluhan Way; Anne Marie Ct; Camargo Ct; Bewcastle Ct; Mayall Ct; Blackmore Ct; Peachwood Ct; Widen Ct; Valhalla Ct; Minuteman Way; Babe Ruth Ct; Hadeock Ct; Baden Ct; Peachwood Pl; Bethany Ct.
Other features: Berryessa Crk.
Cataldi neighborhood detailed profile
Area: 0.361 square miles
Population: 3,052
Population density:
| Cataldi: | 8,455 people per square mile |
| San Jose: | 5,625 people per square mile |
Median household income in 2021:
| Cataldi: | $152,374 |
| San Jose: | $126,377 |
Median rent in in 2021:
| Cataldi: | $3,015 |
| San Jose: | $2,001 |
Male vs Females
| Males: | 1,712 |
| Females: | 1,339 |
Median age
| Males: | 41.6 years |
| Females: | 45.6 years |
Housing prices:
Average estimated value of detached houses in 2021 (99.0% of all units):
| Cataldi: | $1,076,182 |
| San Jose: | $1,403,256 |
Average estimated value of townhouses or other attached units in 2021 (2.0% of all units):
| This neighborhood: | $718,670 |
| city: | $892,629 |
Average estimated '21 value of housing units in 5-or-more-unit structures (2.4% of all units):
| Cataldi: | $672,000 |
| San Jose: | $688,625 |
Most popular occupations of males: computer and mathematical occupations (15.5%); sales and office occupations (13.8%); management occupations (except farmers) (13.7%); architecture and engineering occupations (10.6%); service occupations (10.4%); business and financial operations occupations (8.4%); production occupations (7.9%)
Most popular occupations of females: sales and office occupations (19.7%); service occupations (13.8%); computer and mathematical occupations (13.0%); management occupations (except farmers) (11.4%); business and financial operations occupations (8.4%); education, training, and library occupations (7.4%); healthcare practitioners and technical occupations (7.1%)
Roads and streets: Bethany Ave; Morrill Ave; Agua Vista Dr; Hostetter Rd; Camargo Dr; Middleborough Cir; Peachwood Dr; Babe Ruth Dr; Garvey Pl; Wexford Dr; Trudean Way; Mignon Dr; Cohansey Dr; Cataldi Dr; Swanston Way; Largo Dr; Daltrey Way; Tobin Dr; Valhalla Dr; Camacho Way; Kesey Ln; Gillian Way; Mc Cluhan Way; Anne Marie Ct; Camargo Ct; Bewcastle Ct; Mayall Ct; Blackmore Ct; Peachwood Ct; Widen Ct; Valhalla Ct; Minuteman Way; Babe Ruth Ct; Hadeock Ct; Baden Ct; Peachwood Pl; Bethany Ct.
Other features: Berryessa Crk.
Cataldi neighborhood detailed profile
Cedarville neighborhood in San Jose statistics: (Find on map)
Area: 0.119 square miles
Population: 649
Population density:
Median household income in 2021:
Median rent in in 2021:
Male vs Females
Median age
Housing prices:
Average estimated value of detached houses in 2021 (97.9% of all units):
Average estimated '21 value of housing units in 3-to-4-unit structures (9.4% of all units):
Average estimated '21 value of housing units in 5-or-more-unit structures (3.1% of all units):
Average estimated value of mobile home in 2021 (6.8% of all units):
Most popular occupations of males: service occupations (19.9%); architecture and engineering occupations (17.1%); construction, extraction, and maintenance occupations (15.3%); arts, design, entertainment, sports, and media occupations (8.0%); management occupations (except farmers) (6.4%); computer and mathematical occupations (5.2%); production occupations (5.2%)
Most popular occupations of females: service occupations (38.2%); sales and office occupations (13.3%); computer and mathematical occupations (13.0%); business and financial operations occupations (10.7%); management occupations (except farmers) (9.3%); community and social services occupations (5.9%); education, training, and library occupations (3.1%)
Roads and streets: Gianotta Way; N Capitol Ave; Easton Ln; Gimelli Way; Baton Rouge Dr; Easton Dr; Cedarville Ln; White Water Ct; Blue Rock Ct; Genoa Dr; Saint Florence Dr; Vennecia Dr; Devlin Ct; Gimelli Pl; Easton Pl; Galleon Ct; Kimpton Ct; Gimelli Ct; Easton Way; Clear Spring Ct; Easton Ter; Oropeza Ct; Power Ct.
Cedarville neighborhood detailed profile
Area: 0.119 square miles
Population: 649
Population density:
| Cedarville (Giannotta): | 5,432 people per square mile |
| San Jose: | 5,625 people per square mile |
Median household income in 2021:
| Cedarville (Giannotta): | $118,348 |
| San Jose: | $126,377 |
Median rent in in 2021:
| Cedarville (Giannotta): | $2,958 |
| San Jose: | $2,001 |
Male vs Females
| Males: | 331 |
| Females: | 317 |
Median age
| Males: | 42.7 years |
| Females: | 40.6 years |
Housing prices:
Average estimated value of detached houses in 2021 (97.9% of all units):
| Cedarville (Giannotta): | $429,947 |
| San Jose: | $1,403,256 |
Average estimated '21 value of housing units in 3-to-4-unit structures (9.4% of all units):
| Cedarville (Giannotta): | $499,643 |
| city: | $680,453 |
Average estimated '21 value of housing units in 5-or-more-unit structures (3.1% of all units):
| Cedarville (Giannotta): | $827,095 |
| San Jose: | $688,625 |
Average estimated value of mobile home in 2021 (6.8% of all units):
| Cedarville (Giannotta): | $253,459 |
| San Jose: | $240,963 |
Most popular occupations of males: service occupations (19.9%); architecture and engineering occupations (17.1%); construction, extraction, and maintenance occupations (15.3%); arts, design, entertainment, sports, and media occupations (8.0%); management occupations (except farmers) (6.4%); computer and mathematical occupations (5.2%); production occupations (5.2%)
Most popular occupations of females: service occupations (38.2%); sales and office occupations (13.3%); computer and mathematical occupations (13.0%); business and financial operations occupations (10.7%); management occupations (except farmers) (9.3%); community and social services occupations (5.9%); education, training, and library occupations (3.1%)
Roads and streets: Gianotta Way; N Capitol Ave; Easton Ln; Gimelli Way; Baton Rouge Dr; Easton Dr; Cedarville Ln; White Water Ct; Blue Rock Ct; Genoa Dr; Saint Florence Dr; Vennecia Dr; Devlin Ct; Gimelli Pl; Easton Pl; Galleon Ct; Kimpton Ct; Gimelli Ct; Easton Way; Clear Spring Ct; Easton Ter; Oropeza Ct; Power Ct.
Cedarville neighborhood detailed profile
Centerwood neighborhood in San Jose statistics: (Find on map)
Area: 0.175 square miles
Population: 1,745
Population density:
Median household income in 2021:
Median rent in in 2021:
Male vs Females
Median age
Average estimated value of detached houses in 2021 (99.8% of all units):
Most popular occupations of males: sales and office occupations (19.0%); computer and mathematical occupations (12.4%); production occupations (12.0%); service occupations (11.8%); management occupations (except farmers) (10.3%); architecture and engineering occupations (9.5%); transportation occupations (7.7%)
Most popular occupations of females: sales and office occupations (21.6%); service occupations (19.2%); production occupations (12.9%); management occupations (except farmers) (10.4%); healthcare practitioners and technical occupations (9.7%); business and financial operations occupations (7.9%); education, training, and library occupations (4.4%)
Roads and streets: Allenwood Dr; Norwood Ave; Woods Way; Remington Way; Archwood Cir; Centerwood Way; Masonwood St; Winwood Way; Dennywood Ct; Brightwood Ct; Brightwood Dr; Rainwood Ct; Alwood Ct; Deerwood Dr; Lovewood Way; Covewood Ct; Centerwood Ct; Churchwood Ct; Woods Ct; Gaywood Ct; Danwood Ct; Allenwood Ct; Fawnswood Ct; Masonwood Way.
Centerwood neighborhood detailed profile
Area: 0.175 square miles
Population: 1,745
Population density:
| Centerwood: | 9,958 people per square mile |
| San Jose: | 5,625 people per square mile |
Median household income in 2021:
| Centerwood: | $151,918 |
| San Jose: | $126,377 |
Median rent in in 2021:
| Centerwood: | $3,269 |
| San Jose: | $2,001 |
Male vs Females
| Males: | 833 |
| Females: | 912 |
Median age
| Males: | 35.6 years |
| Females: | 38.8 years |
Average estimated value of detached houses in 2021 (99.8% of all units):
| Centerwood: | $951,090 |
| San Jose: | $1,403,256 |
Most popular occupations of males: sales and office occupations (19.0%); computer and mathematical occupations (12.4%); production occupations (12.0%); service occupations (11.8%); management occupations (except farmers) (10.3%); architecture and engineering occupations (9.5%); transportation occupations (7.7%)
Most popular occupations of females: sales and office occupations (21.6%); service occupations (19.2%); production occupations (12.9%); management occupations (except farmers) (10.4%); healthcare practitioners and technical occupations (9.7%); business and financial operations occupations (7.9%); education, training, and library occupations (4.4%)
Roads and streets: Allenwood Dr; Norwood Ave; Woods Way; Remington Way; Archwood Cir; Centerwood Way; Masonwood St; Winwood Way; Dennywood Ct; Brightwood Ct; Brightwood Dr; Rainwood Ct; Alwood Ct; Deerwood Dr; Lovewood Way; Covewood Ct; Centerwood Ct; Churchwood Ct; Woods Ct; Gaywood Ct; Danwood Ct; Allenwood Ct; Fawnswood Ct; Masonwood Way.
Centerwood neighborhood detailed profile
Century neighborhood in San Jose statistics: (Find on map)
Area: 0.181 square miles
Population: 244
Population density:
Median household income in 2021:
Median rent in in 2021:
Male vs Females
Median age
Most popular occupations of males: architecture and engineering occupations (19.4%); production occupations (16.9%); arts, design, entertainment, sports, and media occupations (15.4%); sales and office occupations (15.2%); healthcare practitioners and technical occupations (15.1%); education, training, and library occupations (9.2%); management occupations (except farmers) (7.3%)
Most popular occupations of females: healthcare practitioners and technical occupations (44.0%); education, training, and library occupations (21.4%); sales and office occupations (15.0%); production occupations (9.5%); management occupations (except farmers) (8.5%); business and financial operations occupations (7.6%); arts, design, entertainment, sports, and media occupations (3.5%)
Limited-access highways (interstate or state) in this neighborhood: US Hwy 101 (S Valley Fwy); US Hwy 101.
Roads and streets: Coyote Rd; Pebble Tree Way; Century Park Way; Century Oaks Way; Crosslees Dr; Broderick Dr; Northgate Dr; Tigerwood Way; Hassinger Rd; Century Plaza Way; Silver Creek Valley Rd; Century Manor Ct; Century Meadow Ct; Calicowood Pl; Persianwood Pl; Manxwood Pl; Century Cross Ct; Pebble Tree Ct; Lionwood Pl; Olstad Ct; Lindstrom Ct; Sydenham Ct; Century Hill Ct; Century Oaks Ct.
Century neighborhood detailed profile
Area: 0.181 square miles
Population: 244
Population density:
| Century (Pebbletree): | 1,348 people per square mile |
| San Jose: | 5,625 people per square mile |
Median household income in 2021:
| Century (Pebbletree): | $157,076 |
| San Jose: | $126,377 |
Median rent in in 2021:
| Century (Pebbletree): | $3,235 |
| San Jose: | $2,001 |
Male vs Females
| Males: | 137 |
| Females: | 107 |
Median age
| Males: | 36.0 years |
| Females: | 43.2 years |
Most popular occupations of males: architecture and engineering occupations (19.4%); production occupations (16.9%); arts, design, entertainment, sports, and media occupations (15.4%); sales and office occupations (15.2%); healthcare practitioners and technical occupations (15.1%); education, training, and library occupations (9.2%); management occupations (except farmers) (7.3%)
Most popular occupations of females: healthcare practitioners and technical occupations (44.0%); education, training, and library occupations (21.4%); sales and office occupations (15.0%); production occupations (9.5%); management occupations (except farmers) (8.5%); business and financial operations occupations (7.6%); arts, design, entertainment, sports, and media occupations (3.5%)
Limited-access highways (interstate or state) in this neighborhood: US Hwy 101 (S Valley Fwy); US Hwy 101.
Roads and streets: Coyote Rd; Pebble Tree Way; Century Park Way; Century Oaks Way; Crosslees Dr; Broderick Dr; Northgate Dr; Tigerwood Way; Hassinger Rd; Century Plaza Way; Silver Creek Valley Rd; Century Manor Ct; Century Meadow Ct; Calicowood Pl; Persianwood Pl; Manxwood Pl; Century Cross Ct; Pebble Tree Ct; Lionwood Pl; Olstad Ct; Lindstrom Ct; Sydenham Ct; Century Hill Ct; Century Oaks Ct.
Century neighborhood detailed profile
Chaboya neighborhood in San Jose statistics: (Find on map)
Area: 0.304 square miles
Roads and streets: Mackin Woods Ln; Falls Creek Dr; Altia Ave; Jasmine Cir; Verona Rd; Pomerado Dr; Capriana Cir; Montecito Dr; Murillo Ave; Bel Mira Way; San Lucas Way; Montierra Pl; Fowler Rd; Fontenay Way; Falls Creek Ct; Palantino Way; Placido Ct; Monte Verde Ln; la Costa Way; Patina Ct; Camarillo Ct; Cantada Ct; Etoile Ct; Famille Ct; Marcel Ct; Henriette Ct; Aviara Ct; Trovare Ct; Esperanza Ct; Marbrisa Ct; Trabuco Ct; Mirage Way; Nipoma Ct; Cantamar Ct; Pomerado Way; San Tropico Ct; Palmo Ct; Lorenzo Ln; Lambare Way; Montecito Ct.
Chaboya neighborhood detailed profile
Chantilley neighborhood in San Jose statistics: (Find on map)
Area: 0.098 square miles
Population: 911
Population density:
Median household income in 2021:
Median rent in in 2021:
Male vs Females
Median age
Housing prices:
Average estimated value of detached houses in 2021 (53.6% of all units):
Average estimated value of townhouses or other attached units in 2021 (67.8% of all units):
Most popular occupations of males: transportation occupations (20.7%); sales and office occupations (19.8%); management occupations (except farmers) (12.0%); business and financial operations occupations (11.1%); construction, extraction, and maintenance occupations (8.4%); material moving occupations (7.3%); computer and mathematical occupations (5.6%)
Most popular occupations of females: management occupations (except farmers) (26.3%); service occupations (15.7%); education, training, and library occupations (15.4%); sales and office occupations (11.3%); healthcare practitioners and technical occupations (10.8%); business and financial operations occupations (7.4%); computer and mathematical occupations (6.5%)
Roads and streets: Golf Course Ln; Alder Spring Way; Rosencrans Way; Sprucemont Pl; Fairway Glen Ln; Indian Wells Ct; Chantilley Ln; Santa Teresa Blvd; Oak Brook Cir; Banff Springs Way; Stillwater Ln; Cypress Point Ct; Coral Gables Cir; Chantilley Ct; Calero Hills Ct; Point Dunes Ct; Aptos Beach Ct; Valley Park Cir; Indian Valley Ct; Incline Way; Banff Springs Ct; Pinedale Ct; Shea Ct; Kodiak Ct.
Chantilley neighborhood detailed profile
Area: 0.098 square miles
Population: 911
Population density:
| Chantilley: | 9,280 people per square mile |
| San Jose: | 5,625 people per square mile |
Median household income in 2021:
| Chantilley: | $136,541 |
| San Jose: | $126,377 |
Median rent in in 2021:
| Chantilley: | $2,742 |
| San Jose: | $2,001 |
Male vs Females
| Males: | 486 |
| Females: | 424 |
Median age
| Males: | 42.6 years |
| Females: | 37.7 years |
Housing prices:
Average estimated value of detached houses in 2021 (53.6% of all units):
| Chantilley: | $1,747,035 |
| San Jose: | $1,403,256 |
Average estimated value of townhouses or other attached units in 2021 (67.8% of all units):
| This neighborhood: | $2,483,618 |
| city: | $892,629 |
Most popular occupations of males: transportation occupations (20.7%); sales and office occupations (19.8%); management occupations (except farmers) (12.0%); business and financial operations occupations (11.1%); construction, extraction, and maintenance occupations (8.4%); material moving occupations (7.3%); computer and mathematical occupations (5.6%)
Most popular occupations of females: management occupations (except farmers) (26.3%); service occupations (15.7%); education, training, and library occupations (15.4%); sales and office occupations (11.3%); healthcare practitioners and technical occupations (10.8%); business and financial operations occupations (7.4%); computer and mathematical occupations (6.5%)
Roads and streets: Golf Course Ln; Alder Spring Way; Rosencrans Way; Sprucemont Pl; Fairway Glen Ln; Indian Wells Ct; Chantilley Ln; Santa Teresa Blvd; Oak Brook Cir; Banff Springs Way; Stillwater Ln; Cypress Point Ct; Coral Gables Cir; Chantilley Ct; Calero Hills Ct; Point Dunes Ct; Aptos Beach Ct; Valley Park Cir; Indian Valley Ct; Incline Way; Banff Springs Ct; Pinedale Ct; Shea Ct; Kodiak Ct.
Chantilley neighborhood detailed profile
Chapman neighborhood in San Jose statistics: (Find on map)
Area: 0.051 square miles
Population: 368
Population density:
Median household income in 2021:
Median rent in in 2021:
Male vs Females
Median age
Most popular occupations of males: management occupations (except farmers) (29.1%); sales and office occupations (16.4%); architecture and engineering occupations (11.4%); service occupations (9.8%); computer and mathematical occupations (6.2%); legal occupations (5.3%); construction, extraction, and maintenance occupations (5.1%)
Most popular occupations of females: service occupations (23.6%); sales and office occupations (18.2%); education, training, and library occupations (17.8%); management occupations (except farmers) (15.5%); healthcare practitioners and technical occupations (7.2%); computer and mathematical occupations (6.4%); arts, design, entertainment, sports, and media occupations (5.5%)
Roads and streets: Morse St; Newhall St; Chapman St; Greenwood Ave; Idaho St.
Chapman neighborhood detailed profile
Area: 0.051 square miles
Population: 368
Population density:
| Chapman (Morse): | 7,230 people per square mile |
| San Jose: | 5,625 people per square mile |
Median household income in 2021:
| Chapman (Morse): | $103,149 |
| San Jose: | $126,377 |
Median rent in in 2021:
| Chapman (Morse): | $2,072 |
| San Jose: | $2,001 |
Male vs Females
| Males: | 164 |
| Females: | 204 |
Median age
| Males: | 25.8 years |
| Females: | 25.4 years |
Most popular occupations of males: management occupations (except farmers) (29.1%); sales and office occupations (16.4%); architecture and engineering occupations (11.4%); service occupations (9.8%); computer and mathematical occupations (6.2%); legal occupations (5.3%); construction, extraction, and maintenance occupations (5.1%)
Most popular occupations of females: service occupations (23.6%); sales and office occupations (18.2%); education, training, and library occupations (17.8%); management occupations (except farmers) (15.5%); healthcare practitioners and technical occupations (7.2%); computer and mathematical occupations (6.4%); arts, design, entertainment, sports, and media occupations (5.5%)
Roads and streets: Morse St; Newhall St; Chapman St; Greenwood Ave; Idaho St.
Chapman neighborhood detailed profile
Checkers neighborhood in San Jose statistics: (Find on map)
Area: 0.082 square miles
Population: 1,086
Population density:
Median household income in 2021:
Median rent in in 2021:
Male vs Females
Median age
Housing prices:
Average estimated value of detached houses in 2021 (43.4% of all units):
Average estimated value of townhouses or other attached units in 2021 (32.1% of all units):
Average estimated '21 value of housing units in 5-or-more-unit structures (8.8% of all units):
Most popular occupations of males: service occupations (21.2%); production occupations (18.9%); management occupations (except farmers) (12.2%); sales and office occupations (7.6%); life, physical, and social science occupations (6.1%); education, training, and library occupations (5.8%); architecture and engineering occupations (4.9%)
Most popular occupations of females: service occupations (27.3%); sales and office occupations (17.4%); production occupations (14.6%); healthcare practitioners and technical occupations (11.5%); business and financial operations occupations (9.3%); life, physical, and social science occupations (7.0%); management occupations (except farmers) (4.0%)
Roads and streets: Checkers Dr; Perrone Cir; Ave de Cobre; Arroyo de Platina; Castlecrest Dr; Esmerelda Ct; Turquesa Ct; Platinum Ct; Castlebridge Dr; Castlebury Dr; Prince George Dr.
Other features: Silver Crk.
Checkers neighborhood detailed profile
Area: 0.082 square miles
Population: 1,086
Population density:
| Checkers: | 13,316 people per square mile |
| San Jose: | 5,625 people per square mile |
Median household income in 2021:
| Checkers: | $61,644 |
| San Jose: | $126,377 |
Median rent in in 2021:
| Checkers: | $2,153 |
| San Jose: | $2,001 |
Male vs Females
| Males: | 547 |
| Females: | 539 |
Median age
| Males: | 40.0 years |
| Females: | 44.4 years |
Housing prices:
Average estimated value of detached houses in 2021 (43.4% of all units):
| Checkers: | $574,550 |
| San Jose: | $1,403,256 |
Average estimated value of townhouses or other attached units in 2021 (32.1% of all units):
| This neighborhood: | $1,414,724 |
| city: | $892,629 |
Average estimated '21 value of housing units in 5-or-more-unit structures (8.8% of all units):
| Checkers: | $509,252 |
| San Jose: | $688,625 |
Most popular occupations of males: service occupations (21.2%); production occupations (18.9%); management occupations (except farmers) (12.2%); sales and office occupations (7.6%); life, physical, and social science occupations (6.1%); education, training, and library occupations (5.8%); architecture and engineering occupations (4.9%)
Most popular occupations of females: service occupations (27.3%); sales and office occupations (17.4%); production occupations (14.6%); healthcare practitioners and technical occupations (11.5%); business and financial operations occupations (9.3%); life, physical, and social science occupations (7.0%); management occupations (except farmers) (4.0%)
Roads and streets: Checkers Dr; Perrone Cir; Ave de Cobre; Arroyo de Platina; Castlecrest Dr; Esmerelda Ct; Turquesa Ct; Platinum Ct; Castlebridge Dr; Castlebury Dr; Prince George Dr.
Other features: Silver Crk.
Checkers neighborhood detailed profile
Cherrywood neighborhood in San Jose statistics: (Find on map)
Area: 0.224 square miles
Population: 2,702
Population density:
Median household income in 2021:
Median rent in in 2021:
Male vs Females
Median age
Average estimated value of detached houses in 2021 (80.1% of all units):
Most popular occupations of males: service occupations (17.6%); architecture and engineering occupations (12.2%); construction, extraction, and maintenance occupations (11.7%); computer and mathematical occupations (11.2%); life, physical, and social science occupations (7.9%); sales and office occupations (6.8%); material moving occupations (6.2%)
Most popular occupations of females: service occupations (34.1%); business and financial operations occupations (13.8%); production occupations (9.8%); computer and mathematical occupations (9.7%); sales and office occupations (8.8%); healthcare practitioners and technical occupations (7.8%); life, physical, and social science occupations (4.5%)
Roads and streets: Cam del Rey; Sierra Rd; Cabrillo Ave; Somerset Park Cir; Morrill Ave; San Marcos Dr; Mosswood Dr; Monte Cresta Way; Lucena Dr; Heritage Park Cir; Gomes Dr; Havenwood Dr; Greengate Dr; Caliente Way; Lodestone Dr; Bonnet Ct; San Marcos Ct; Lucena Ct.
Cherrywood neighborhood detailed profile
Area: 0.224 square miles
Population: 2,702
Population density:
| Cherrywood: | 12,065 people per square mile |
| San Jose: | 5,625 people per square mile |
Median household income in 2021:
| Cherrywood: | $148,403 |
| San Jose: | $126,377 |
Median rent in in 2021:
| Cherrywood: | $3,039 |
| San Jose: | $2,001 |
Male vs Females
| Males: | 1,419 |
| Females: | 1,282 |
Median age
| Males: | 43.2 years |
| Females: | 45.7 years |
Average estimated value of detached houses in 2021 (80.1% of all units):
| Cherrywood: | $1,332,003 |
| San Jose: | $1,403,256 |
Most popular occupations of males: service occupations (17.6%); architecture and engineering occupations (12.2%); construction, extraction, and maintenance occupations (11.7%); computer and mathematical occupations (11.2%); life, physical, and social science occupations (7.9%); sales and office occupations (6.8%); material moving occupations (6.2%)
Most popular occupations of females: service occupations (34.1%); business and financial operations occupations (13.8%); production occupations (9.8%); computer and mathematical occupations (9.7%); sales and office occupations (8.8%); healthcare practitioners and technical occupations (7.8%); life, physical, and social science occupations (4.5%)
Roads and streets: Cam del Rey; Sierra Rd; Cabrillo Ave; Somerset Park Cir; Morrill Ave; San Marcos Dr; Mosswood Dr; Monte Cresta Way; Lucena Dr; Heritage Park Cir; Gomes Dr; Havenwood Dr; Greengate Dr; Caliente Way; Lodestone Dr; Bonnet Ct; San Marcos Ct; Lucena Ct.
Cherrywood neighborhood detailed profile
Cimarron neighborhood in San Jose statistics: (Find on map)
Area: 0.104 square miles
Population: 569
Population density:
Median household income in 2021:
Median rent in in 2021:
Male vs Females
Median age
Housing prices:
Average estimated value of detached houses in 2021 (99.3% of all units):
Average estimated value of townhouses or other attached units in 2021 (68.3% of all units):
Average estimated '21 value of housing units in 3-to-4-unit structures (135.3% of all units):
Most popular occupations of males: architecture and engineering occupations (34.9%); service occupations (25.4%); sales and office occupations (15.7%); production occupations (9.5%); computer and mathematical occupations (7.5%); education, training, and library occupations (5.1%); construction, extraction, and maintenance occupations (3.1%)
Most popular occupations of females: service occupations (29.5%); management occupations (except farmers) (15.7%); healthcare practitioners and technical occupations (14.1%); business and financial operations occupations (12.2%); material moving occupations (8.9%); computer and mathematical occupations (7.0%); life, physical, and social science occupations (6.0%)
Roads and streets: Mabury Rd; Orange St; Pelleas Ln; Kawalker Ln; Fiji Dr; Salem Dr; Pride St; Kyle St; Almansa Ct; Segovia Ct; Timor Ct; Janku Ct; Franklin Ct; Pride Ct; Indus Ct; Hedda Ct.
Cimarron neighborhood detailed profile
Area: 0.104 square miles
Population: 569
Population density:
| Cimarron: | 5,462 people per square mile |
| San Jose: | 5,625 people per square mile |
Median household income in 2021:
| Cimarron: | $134,125 |
| San Jose: | $126,377 |
Median rent in in 2021:
| Cimarron: | $3,500 |
| San Jose: | $2,001 |
Male vs Females
| Males: | 271 |
| Females: | 297 |
Median age
| Males: | 41.9 years |
| Females: | 41.9 years |
Housing prices:
Average estimated value of detached houses in 2021 (99.3% of all units):
| Cimarron: | $1,848,359 |
| San Jose: | $1,403,256 |
Average estimated value of townhouses or other attached units in 2021 (68.3% of all units):
| This neighborhood: | $370,060 |
| city: | $892,629 |
Average estimated '21 value of housing units in 3-to-4-unit structures (135.3% of all units):
| Cimarron: | $480,622 |
| city: | $680,453 |
Most popular occupations of males: architecture and engineering occupations (34.9%); service occupations (25.4%); sales and office occupations (15.7%); production occupations (9.5%); computer and mathematical occupations (7.5%); education, training, and library occupations (5.1%); construction, extraction, and maintenance occupations (3.1%)
Most popular occupations of females: service occupations (29.5%); management occupations (except farmers) (15.7%); healthcare practitioners and technical occupations (14.1%); business and financial operations occupations (12.2%); material moving occupations (8.9%); computer and mathematical occupations (7.0%); life, physical, and social science occupations (6.0%)
Roads and streets: Mabury Rd; Orange St; Pelleas Ln; Kawalker Ln; Fiji Dr; Salem Dr; Pride St; Kyle St; Almansa Ct; Segovia Ct; Timor Ct; Janku Ct; Franklin Ct; Pride Ct; Indus Ct; Hedda Ct.
Cimarron neighborhood detailed profile
Cinco de Mayo neighborhood in San Jose statistics: (Find on map)
Area: 0.043 square miles
Population: 210
Population density:
Median household income in 2021:
Median rent in in 2021:
Male vs Females
Median age
Average estimated value of detached houses in 2021 (100.0% of all units):
Most popular occupations of males: computer and mathematical occupations (21.4%); sales and office occupations (19.7%); management occupations (except farmers) (12.8%); architecture and engineering occupations (9.2%); healthcare practitioners and technical occupations (8.6%); production occupations (8.2%); business and financial operations occupations (6.9%)
Most popular occupations of females: sales and office occupations (23.9%); business and financial operations occupations (13.6%); service occupations (12.5%); healthcare practitioners and technical occupations (9.7%); production occupations (9.1%); architecture and engineering occupations (6.8%); community and social services occupations (5.7%)
Limited-access highways (interstate or state) in this neighborhood: .
Roads and streets: Via Cinco de Mayo; Via Flores Ct (Via Flores); Plz Americas; Plz Banderas; Plz Claveles.
Cinco de Mayo neighborhood detailed profile
Area: 0.043 square miles
Population: 210
Population density:
| Cinco de Mayo: | 4,921 people per square mile |
| San Jose: | 5,625 people per square mile |
Median household income in 2021:
| Cinco de Mayo: | $141,750 |
| San Jose: | $126,377 |
Median rent in in 2021:
| Cinco de Mayo: | $3,188 |
| San Jose: | $2,001 |
Male vs Females
| Males: | 121 |
| Females: | 89 |
Median age
| Males: | 49.7 years |
| Females: | 55.2 years |
Average estimated value of detached houses in 2021 (100.0% of all units):
| Cinco de Mayo: | $1,076,182 |
| San Jose: | $1,403,256 |
Most popular occupations of males: computer and mathematical occupations (21.4%); sales and office occupations (19.7%); management occupations (except farmers) (12.8%); architecture and engineering occupations (9.2%); healthcare practitioners and technical occupations (8.6%); production occupations (8.2%); business and financial operations occupations (6.9%)
Most popular occupations of females: sales and office occupations (23.9%); business and financial operations occupations (13.6%); service occupations (12.5%); healthcare practitioners and technical occupations (9.7%); production occupations (9.1%); architecture and engineering occupations (6.8%); community and social services occupations (5.7%)
Limited-access highways (interstate or state) in this neighborhood: .
Roads and streets: Via Cinco de Mayo; Via Flores Ct (Via Flores); Plz Americas; Plz Banderas; Plz Claveles.
Cinco de Mayo neighborhood detailed profile
Cinderella neighborhood in San Jose statistics: (Find on map)
Area: 0.128 square miles
Population: 2,031
Population density:
Median household income in 2021:
Median rent in in 2021:
Male vs Females
Median age
Average estimated value of detached houses in 2021 (55.7% of all units):
Most popular occupations of males: service occupations (36.5%); construction, extraction, and maintenance occupations (21.9%); sales and office occupations (11.5%); production occupations (9.7%); material moving occupations (3.5%); transportation occupations (3.1%); architecture and engineering occupations (3.0%)
Most popular occupations of females: service occupations (53.3%); sales and office occupations (18.9%); community and social services occupations (5.3%); production occupations (5.3%); business and financial operations occupations (4.8%); healthcare practitioners and technical occupations (2.8%); material moving occupations (2.5%)
Roads and streets: Cinderella Ln; S Jackson Ave; Diadem Dr; Nottoway Ave; Diana Ave; Angie Ave; Tiara Dr; Lyons Dr; Pacina Dr; Diana Pl; Manassas Ct; Diana Ln; Steitz Ct; Lyons Ct.
Cinderella neighborhood detailed profile
Area: 0.128 square miles
Population: 2,031
Population density:
| Cinderella: | 15,833 people per square mile |
| San Jose: | 5,625 people per square mile |
Median household income in 2021:
| Cinderella: | $115,449 |
| San Jose: | $126,377 |
Median rent in in 2021:
| Cinderella: | $1,691 |
| San Jose: | $2,001 |
Male vs Females
| Males: | 1,079 |
| Females: | 952 |
Median age
| Males: | 32.3 years |
| Females: | 34.1 years |
Average estimated value of detached houses in 2021 (55.7% of all units):
| Cinderella: | $657,730 |
| San Jose: | $1,403,256 |
Most popular occupations of males: service occupations (36.5%); construction, extraction, and maintenance occupations (21.9%); sales and office occupations (11.5%); production occupations (9.7%); material moving occupations (3.5%); transportation occupations (3.1%); architecture and engineering occupations (3.0%)
Most popular occupations of females: service occupations (53.3%); sales and office occupations (18.9%); community and social services occupations (5.3%); production occupations (5.3%); business and financial operations occupations (4.8%); healthcare practitioners and technical occupations (2.8%); material moving occupations (2.5%)
Roads and streets: Cinderella Ln; S Jackson Ave; Diadem Dr; Nottoway Ave; Diana Ave; Angie Ave; Tiara Dr; Lyons Dr; Pacina Dr; Diana Pl; Manassas Ct; Diana Ln; Steitz Ct; Lyons Ct.
Cinderella neighborhood detailed profile
Cinnabar neighborhood in San Jose statistics: (Find on map)
Area: 0.053 square miles
Population: 480
Population density:
Median household income in 2021:
Median rent in in 2021:
Male vs Females
Median age
Most popular occupations of males: computer and mathematical occupations (23.1%); sales and office occupations (18.2%); architecture and engineering occupations (14.3%); service occupations (10.8%); management occupations (except farmers) (9.2%); education, training, and library occupations (5.6%); business and financial operations occupations (5.4%)
Most popular occupations of females: business and financial operations occupations (38.7%); education, training, and library occupations (18.1%); management occupations (except farmers) (14.1%); service occupations (13.5%); architecture and engineering occupations (4.8%); healthcare practitioners and technical occupations (4.0%); legal occupations (3.2%)
Roads and streets: Camden Village Cir; Camden Village Way; Camden Village Ct.
Cinnabar neighborhood detailed profile
Area: 0.053 square miles
Population: 480
Population density:
| Cinnabar: | 8,974 people per square mile |
| San Jose: | 5,625 people per square mile |
Median household income in 2021:
| Cinnabar: | $159,951 |
| San Jose: | $126,377 |
Median rent in in 2021:
| Cinnabar: | $2,603 |
| San Jose: | $2,001 |
Male vs Females
| Males: | 246 |
| Females: | 234 |
Median age
| Males: | 44.1 years |
| Females: | 37.7 years |
Most popular occupations of males: computer and mathematical occupations (23.1%); sales and office occupations (18.2%); architecture and engineering occupations (14.3%); service occupations (10.8%); management occupations (except farmers) (9.2%); education, training, and library occupations (5.6%); business and financial operations occupations (5.4%)
Most popular occupations of females: business and financial operations occupations (38.7%); education, training, and library occupations (18.1%); management occupations (except farmers) (14.1%); service occupations (13.5%); architecture and engineering occupations (4.8%); healthcare practitioners and technical occupations (4.0%); legal occupations (3.2%)
Roads and streets: Camden Village Cir; Camden Village Way; Camden Village Ct.
Cinnabar neighborhood detailed profile
Claitor neighborhood in San Jose statistics: (Find on map)
Area: 0.028 square miles
Population: 153
Population density:
Median household income in 2021:
Median rent in in 2021:
Male vs Females
Median age
Most popular occupations of males: service occupations (24.9%); production occupations (14.0%); sales and office occupations (8.3%); construction, extraction, and maintenance occupations (7.2%); business and financial operations occupations (6.4%); computer and mathematical occupations (6.2%); management occupations (except farmers) (5.8%)
Most popular occupations of females: sales and office occupations (34.4%); service occupations (25.0%); business and financial operations occupations (11.4%); management occupations (except farmers) (8.7%); material moving occupations (4.9%); production occupations (4.8%); healthcare practitioners and technical occupations (4.0%)
Roads and streets: Coyote Rd.
Claitor neighborhood detailed profile
Area: 0.028 square miles
Population: 153
Population density:
| Claitor: | 5,445 people per square mile |
| San Jose: | 5,625 people per square mile |
Median household income in 2021:
| Claitor: | $152,952 |
| San Jose: | $126,377 |
Median rent in in 2021:
| Claitor: | $3,235 |
| San Jose: | $2,001 |
Male vs Females
| Males: | 71 |
| Females: | 81 |
Median age
| Males: | 35.0 years |
| Females: | 42.4 years |
Most popular occupations of males: service occupations (24.9%); production occupations (14.0%); sales and office occupations (8.3%); construction, extraction, and maintenance occupations (7.2%); business and financial operations occupations (6.4%); computer and mathematical occupations (6.2%); management occupations (except farmers) (5.8%)
Most popular occupations of females: sales and office occupations (34.4%); service occupations (25.0%); business and financial operations occupations (11.4%); management occupations (except farmers) (8.7%); material moving occupations (4.9%); production occupations (4.8%); healthcare practitioners and technical occupations (4.0%)
Roads and streets: Coyote Rd.
Claitor neighborhood detailed profile
Clareview neighborhood in San Jose statistics: (Find on map)
Area: 0.017 square miles
Population: 176
Population density:
Median household income in 2021:
Median rent in in 2021:
Male vs Females
Median age
Most popular occupations of males: construction, extraction, and maintenance occupations (26.1%); sales and office occupations (10.2%); transportation occupations (10.0%); service occupations (8.3%); community and social services occupations (7.0%); healthcare practitioners and technical occupations (6.2%); computer and mathematical occupations (5.8%)
Most popular occupations of females: sales and office occupations (26.3%); service occupations (13.5%); community and social services occupations (13.0%); education, training, and library occupations (12.9%); healthcare practitioners and technical occupations (10.6%); production occupations (5.5%); business and financial operations occupations (3.9%)
Roads and streets: Neves Way; Fleming Ave; Clareview Ct.
Clareview neighborhood detailed profile
Area: 0.017 square miles
Population: 176
Population density:
| Clareview: | 10,487 people per square mile |
| San Jose: | 5,625 people per square mile |
Median household income in 2021:
| Clareview: | $161,150 |
| San Jose: | $126,377 |
Median rent in in 2021:
| Clareview: | $2,408 |
| San Jose: | $2,001 |
Male vs Females
| Males: | 91 |
| Females: | 85 |
Median age
| Males: | 46.4 years |
| Females: | 43.3 years |
Most popular occupations of males: construction, extraction, and maintenance occupations (26.1%); sales and office occupations (10.2%); transportation occupations (10.0%); service occupations (8.3%); community and social services occupations (7.0%); healthcare practitioners and technical occupations (6.2%); computer and mathematical occupations (5.8%)
Most popular occupations of females: sales and office occupations (26.3%); service occupations (13.5%); community and social services occupations (13.0%); education, training, and library occupations (12.9%); healthcare practitioners and technical occupations (10.6%); production occupations (5.5%); business and financial operations occupations (3.9%)
Roads and streets: Neves Way; Fleming Ave; Clareview Ct.
Clareview neighborhood detailed profile
Clayton North neighborhood in San Jose statistics: (Find on map)
Area: 0.760 square miles
Population: 1,363
Population density:
Median household income in 2021:
Median rent in in 2021:
Male vs Females
Median age
Housing prices:
Average estimated value of detached houses in 2021 (97.8% of all units):
Average estimated value of townhouses or other attached units in 2021 (2.0% of all units):
Most popular occupations of males: management occupations (except farmers) (21.7%); construction, extraction, and maintenance occupations (19.2%); architecture and engineering occupations (14.0%); business and financial operations occupations (12.9%); computer and mathematical occupations (9.1%); service occupations (8.5%); sales and office occupations (6.8%)
Most popular occupations of females: sales and office occupations (40.5%); service occupations (16.8%); business and financial operations occupations (9.6%); life, physical, and social science occupations (7.6%); management occupations (except farmers) (5.6%); production occupations (5.6%); arts, design, entertainment, sports, and media occupations (4.0%)
Roads and streets: Fleming Ave; Ramstad Dr; Warner Dr; Calco Creek Dr; Morrie Dr; Fourier Dr; Squeri Dr; Peak Dr; Machado Ln; Murietta Ln; Murrieta Ln; Utopia Pl; Hickerson Dr; Feller Ave; Story Ln; Mace Dr; Pine Ridge Way; Cedar Flat Ct; Kaylene Dr; Marchant Dr; Schramm Way; Juliet Ave; Renraw Dr; Rafter Ridge Dr; Ridgeline Ct; Mac Duff Ct; Marchant Ct; Story Ct; Wildman Dr; Kaylene Ct; Hickerson Ct; Macbeth Dr; Millet Ct; Mace Ct; Spurling Ln; Salmon Creek Ct; City View Pl; Glamorgan Ct; Barley Ct; Lee Terrace Ct; Wheat Ct; Harbor Ct.
Other features: Babb Crk.
Clayton North neighborhood detailed profile
Area: 0.760 square miles
Population: 1,363
Population density:
| Clayton North: | 1,793 people per square mile |
| San Jose: | 5,625 people per square mile |
Median household income in 2021:
| Clayton North: | $137,996 |
| San Jose: | $126,377 |
Median rent in in 2021:
| Clayton North: | $2,596 |
| San Jose: | $2,001 |
Male vs Females
| Males: | 760 |
| Females: | 602 |
Median age
| Males: | 41.0 years |
| Females: | 46.2 years |
Housing prices:
Average estimated value of detached houses in 2021 (97.8% of all units):
| Clayton North: | $1,187,418 |
| San Jose: | $1,403,256 |
Average estimated value of townhouses or other attached units in 2021 (2.0% of all units):
| This neighborhood: | $747,750 |
| city: | $892,629 |
Most popular occupations of males: management occupations (except farmers) (21.7%); construction, extraction, and maintenance occupations (19.2%); architecture and engineering occupations (14.0%); business and financial operations occupations (12.9%); computer and mathematical occupations (9.1%); service occupations (8.5%); sales and office occupations (6.8%)
Most popular occupations of females: sales and office occupations (40.5%); service occupations (16.8%); business and financial operations occupations (9.6%); life, physical, and social science occupations (7.6%); management occupations (except farmers) (5.6%); production occupations (5.6%); arts, design, entertainment, sports, and media occupations (4.0%)
Roads and streets: Fleming Ave; Ramstad Dr; Warner Dr; Calco Creek Dr; Morrie Dr; Fourier Dr; Squeri Dr; Peak Dr; Machado Ln; Murietta Ln; Murrieta Ln; Utopia Pl; Hickerson Dr; Feller Ave; Story Ln; Mace Dr; Pine Ridge Way; Cedar Flat Ct; Kaylene Dr; Marchant Dr; Schramm Way; Juliet Ave; Renraw Dr; Rafter Ridge Dr; Ridgeline Ct; Mac Duff Ct; Marchant Ct; Story Ct; Wildman Dr; Kaylene Ct; Hickerson Ct; Macbeth Dr; Millet Ct; Mace Ct; Spurling Ln; Salmon Creek Ct; City View Pl; Glamorgan Ct; Barley Ct; Lee Terrace Ct; Wheat Ct; Harbor Ct.
Other features: Babb Crk.
Clayton North neighborhood detailed profile
Clayton South neighborhood in San Jose statistics: (Find on map)
Area: 0.102 square miles
Population: 332
Population density:
Median household income in 2021:
Median rent in in 2021:
Male vs Females
Median age
Housing prices:
Average estimated value of detached houses in 2021 (18.6% of all units):
Average estimated value of townhouses or other attached units in 2021 (80.6% of all units):
Most popular occupations of males: computer and mathematical occupations (29.2%); architecture and engineering occupations (22.3%); construction, extraction, and maintenance occupations (8.9%); sales and office occupations (8.7%); service occupations (6.9%); management occupations (except farmers) (6.5%); arts, design, entertainment, sports, and media occupations (3.9%)
Most popular occupations of females: service occupations (28.8%); sales and office occupations (22.9%); business and financial operations occupations (21.5%); computer and mathematical occupations (12.5%); management occupations (except farmers) (7.7%); education, training, and library occupations (5.8%)
Roads and streets: Clayton Rd; Columbine Dr; Fall Ave; Oakleaf Dr; Mount Pleasant Rd; Marten Ave; Osprey Ct.
Clayton South neighborhood detailed profile
Area: 0.102 square miles
Population: 332
Population density:
| Clayton South: | 3,250 people per square mile |
| San Jose: | 5,625 people per square mile |
Median household income in 2021:
| Clayton South: | $147,540 |
| San Jose: | $126,377 |
Median rent in in 2021:
| Clayton South: | $2,646 |
| San Jose: | $2,001 |
Male vs Females
| Males: | 169 |
| Females: | 162 |
Median age
| Males: | 37.3 years |
| Females: | 40.8 years |
Housing prices:
Average estimated value of detached houses in 2021 (18.6% of all units):
| Clayton South: | $1,332,324 |
| San Jose: | $1,403,256 |
Average estimated value of townhouses or other attached units in 2021 (80.6% of all units):
| This neighborhood: | $666,087 |
| city: | $892,629 |
Most popular occupations of males: computer and mathematical occupations (29.2%); architecture and engineering occupations (22.3%); construction, extraction, and maintenance occupations (8.9%); sales and office occupations (8.7%); service occupations (6.9%); management occupations (except farmers) (6.5%); arts, design, entertainment, sports, and media occupations (3.9%)
Most popular occupations of females: service occupations (28.8%); sales and office occupations (22.9%); business and financial operations occupations (21.5%); computer and mathematical occupations (12.5%); management occupations (except farmers) (7.7%); education, training, and library occupations (5.8%)
Roads and streets: Clayton Rd; Columbine Dr; Fall Ave; Oakleaf Dr; Mount Pleasant Rd; Marten Ave; Osprey Ct.
Clayton South neighborhood detailed profile
Clinic neighborhood in San Jose statistics: (Find on map)
Area: 0.003 square miles
Roads and streets: S 5th St.
Clinic neighborhood detailed profile
Area: 0.003 square miles
Roads and streets: S 5th St.
Clinic neighborhood detailed profile
Clovercrest neighborhood in San Jose statistics: (Find on map)
Area: 0.051 square miles
Population: 343
Population density:
Median household income in 2021:
Median rent in in 2021:
Male vs Females
Median age
Average estimated value of townhouses or other attached units in 2021 (5.3% of all units):
Most popular occupations of males: transportation occupations (24.3%); service occupations (21.3%); sales and office occupations (14.0%); computer and mathematical occupations (13.3%); management occupations (except farmers) (12.4%); architecture and engineering occupations (4.7%); construction, extraction, and maintenance occupations (3.6%)
Most popular occupations of females: management occupations (except farmers) (25.3%); sales and office occupations (23.6%); service occupations (18.4%); education, training, and library occupations (9.1%); business and financial operations occupations (6.5%); community and social services occupations (5.7%); arts, design, entertainment, sports, and media occupations (4.4%)
Roads and streets: Russo Dr; Clovercrest Dr; Escover Ln; Dentwood Dr; Glenbrae Ln; Lavona Dr; Blair Dr.
Clovercrest neighborhood detailed profile
Area: 0.051 square miles
Population: 343
Population density:
| Clovercrest (Glen Brae): | 6,776 people per square mile |
| San Jose: | 5,625 people per square mile |
Median household income in 2021:
| Clovercrest (Glen Brae): | $121,179 |
| San Jose: | $126,377 |
Median rent in in 2021:
| Clovercrest (Glen Brae): | $1,871 |
| San Jose: | $2,001 |
Male vs Females
| Males: | 198 |
| Females: | 144 |
Median age
| Males: | 42.6 years |
| Females: | 45.1 years |
Average estimated value of townhouses or other attached units in 2021 (5.3% of all units):
| This neighborhood: | $778,138 |
| city: | $892,629 |
Most popular occupations of males: transportation occupations (24.3%); service occupations (21.3%); sales and office occupations (14.0%); computer and mathematical occupations (13.3%); management occupations (except farmers) (12.4%); architecture and engineering occupations (4.7%); construction, extraction, and maintenance occupations (3.6%)
Most popular occupations of females: management occupations (except farmers) (25.3%); sales and office occupations (23.6%); service occupations (18.4%); education, training, and library occupations (9.1%); business and financial operations occupations (6.5%); community and social services occupations (5.7%); arts, design, entertainment, sports, and media occupations (4.4%)
Roads and streets: Russo Dr; Clovercrest Dr; Escover Ln; Dentwood Dr; Glenbrae Ln; Lavona Dr; Blair Dr.
Clovercrest neighborhood detailed profile
Coldwater neighborhood in San Jose statistics: (Find on map)
Area: 0.149 square miles
Population: 2,198
Population density:
Median household income in 2021:
Median rent in in 2021:
Male vs Females
Median age
Average estimated value of detached houses in 2021 (96.6% of all units):
Most popular occupations of males: sales and office occupations (29.9%); management occupations (except farmers) (12.8%); production occupations (12.4%); service occupations (10.8%); transportation occupations (9.9%); architecture and engineering occupations (8.2%); farming, fishing, and forestry occupations (6.6%)
Most popular occupations of females: service occupations (32.6%); sales and office occupations (15.7%); management occupations (except farmers) (14.2%); material moving occupations (8.9%); production occupations (8.0%); education, training, and library occupations (6.1%); healthcare practitioners and technical occupations (4.9%)
Roads and streets: Andora Dr; Coldwater Dr; Flint Ave; Hayworth Dr; Flintmont Dr; Flintcrest Dr; Flintdale Dr; Sylvan Dr; Marten Ave; Flinthaven Dr; Flintcrest Ct; Flintbury Ct; Flintmont Ct.
Other features: Flint Crk.
Coldwater neighborhood detailed profile
Area: 0.149 square miles
Population: 2,198
Population density:
| Coldwater: | 14,751 people per square mile |
| San Jose: | 5,625 people per square mile |
Median household income in 2021:
| Coldwater: | $122,684 |
| San Jose: | $126,377 |
Median rent in in 2021:
| Coldwater: | $1,947 |
| San Jose: | $2,001 |
Male vs Females
| Males: | 1,247 |
| Females: | 951 |
Median age
| Males: | 36.6 years |
| Females: | 37.6 years |
Average estimated value of detached houses in 2021 (96.6% of all units):
| Coldwater: | $875,814 |
| San Jose: | $1,403,256 |
Most popular occupations of males: sales and office occupations (29.9%); management occupations (except farmers) (12.8%); production occupations (12.4%); service occupations (10.8%); transportation occupations (9.9%); architecture and engineering occupations (8.2%); farming, fishing, and forestry occupations (6.6%)
Most popular occupations of females: service occupations (32.6%); sales and office occupations (15.7%); management occupations (except farmers) (14.2%); material moving occupations (8.9%); production occupations (8.0%); education, training, and library occupations (6.1%); healthcare practitioners and technical occupations (4.9%)
Roads and streets: Andora Dr; Coldwater Dr; Flint Ave; Hayworth Dr; Flintmont Dr; Flintcrest Dr; Flintdale Dr; Sylvan Dr; Marten Ave; Flinthaven Dr; Flintcrest Ct; Flintbury Ct; Flintmont Ct.
Other features: Flint Crk.
Coldwater neighborhood detailed profile
College Park neighborhood in San Jose statistics: (Find on map)
Area: 0.136 square miles
Population: 1,063
Population density:
Median household income in 2021:
Median rent in in 2021:
Male vs Females
Median age
Average estimated value of detached houses in 2021 (42.4% of all units):
Most popular occupations of males: management occupations (except farmers) (13.6%); sales and office occupations (11.4%); service occupations (10.1%); material moving occupations (10.0%); education, training, and library occupations (9.3%); business and financial operations occupations (9.1%); construction, extraction, and maintenance occupations (8.4%)
Most popular occupations of females: sales and office occupations (28.7%); education, training, and library occupations (18.1%); service occupations (13.5%); healthcare practitioners and technical occupations (10.6%); management occupations (except farmers) (9.0%); business and financial operations occupations (4.9%); computer and mathematical occupations (3.9%)
Roads and streets: W Taylor St; Emory St; Asbury St; Myrtle St; Elm St; Stockton Ave; Laurel St; University Ave.
College Park neighborhood detailed profile
Area: 0.136 square miles
Population: 1,063
Population density:
| College Park: | 7,821 people per square mile |
| San Jose: | 5,625 people per square mile |
Median household income in 2021:
| College Park: | $178,827 |
| San Jose: | $126,377 |
Median rent in in 2021:
| College Park: | $1,959 |
| San Jose: | $2,001 |
Male vs Females
| Males: | 602 |
| Females: | 460 |
Median age
| Males: | 35.2 years |
| Females: | 39.6 years |
Average estimated value of detached houses in 2021 (42.4% of all units):
| College Park: | $1,158,959 |
| San Jose: | $1,403,256 |
Most popular occupations of males: management occupations (except farmers) (13.6%); sales and office occupations (11.4%); service occupations (10.1%); material moving occupations (10.0%); education, training, and library occupations (9.3%); business and financial operations occupations (9.1%); construction, extraction, and maintenance occupations (8.4%)
Most popular occupations of females: sales and office occupations (28.7%); education, training, and library occupations (18.1%); service occupations (13.5%); healthcare practitioners and technical occupations (10.6%); management occupations (except farmers) (9.0%); business and financial operations occupations (4.9%); computer and mathematical occupations (3.9%)
Roads and streets: W Taylor St; Emory St; Asbury St; Myrtle St; Elm St; Stockton Ave; Laurel St; University Ave.
College Park neighborhood detailed profile
Colonial neighborhood in San Jose statistics: (Find on map)
Area: 0.012 square miles
Population: 65
Population density:
Median household income in 2021:
Median rent in in 2021:
Male vs Females
Median age
Most popular occupations of males: computer and mathematical occupations (19.3%); healthcare practitioners and technical occupations (15.5%); management occupations (except farmers) (14.0%); production occupations (13.7%); business and financial operations occupations (12.3%); service occupations (9.0%); construction, extraction, and maintenance occupations (8.7%)
Most popular occupations of females: sales and office occupations (30.8%); service occupations (26.7%); management occupations (except farmers) (25.9%); healthcare practitioners and technical occupations (23.2%); architecture and engineering occupations (11.0%); computer and mathematical occupations (9.8%); business and financial operations occupations (8.0%)
Colonial neighborhood detailed profile
Area: 0.012 square miles
Population: 65
Population density:
| Colonial: | 5,457 people per square mile |
| San Jose: | 5,625 people per square mile |
Median household income in 2021:
| Colonial: | $121,875 |
| San Jose: | $126,377 |
Median rent in in 2021:
| Colonial: | $2,389 |
| San Jose: | $2,001 |
Male vs Females
| Males: | 29 |
| Females: | 36 |
Median age
| Males: | 37.4 years |
| Females: | 33.7 years |
Most popular occupations of males: computer and mathematical occupations (19.3%); healthcare practitioners and technical occupations (15.5%); management occupations (except farmers) (14.0%); production occupations (13.7%); business and financial operations occupations (12.3%); service occupations (9.0%); construction, extraction, and maintenance occupations (8.7%)
Most popular occupations of females: sales and office occupations (30.8%); service occupations (26.7%); management occupations (except farmers) (25.9%); healthcare practitioners and technical occupations (23.2%); architecture and engineering occupations (11.0%); computer and mathematical occupations (9.8%); business and financial operations occupations (8.0%)
Colonial neighborhood detailed profile
Colony Green neighborhood in San Jose statistics: (Find on map)
Area: 0.041 square miles
Population: 139
Population density:
Median household income in 2021:
Median rent in in 2021:
Male vs Females
Median age
Housing prices:
Average estimated value of detached houses in 2021 (5.9% of all units):
Average estimated value of townhouses or other attached units in 2021 (58.8% of all units):
Average estimated '21 value of housing units in 3-to-4-unit structures (19.6% of all units):
Average estimated '21 value of housing units in 5-or-more-unit structures (2.0% of all units):
Most popular occupations of males: service occupations (15.1%); education, training, and library occupations (12.0%); computer and mathematical occupations (9.8%); sales and office occupations (9.4%); production occupations (8.7%); management occupations (except farmers) (7.8%); construction, extraction, and maintenance occupations (6.2%)
Most popular occupations of females: sales and office occupations (26.6%); management occupations (except farmers) (17.0%); education, training, and library occupations (12.1%); life, physical, and social science occupations (10.5%); service occupations (8.4%); production occupations (5.9%); business and financial operations occupations (5.7%)
Roads and streets: Duesenberg Dr; Colony Field Dr; Colony Green Dr; Colony Crest Dr; Colony Knoll Dr; Colony Park Cir; Colony Cove Dr; Chynoweth Ave; Ave Arboles; Don Correlli Way.
Colony Green neighborhood detailed profile
Area: 0.041 square miles
Population: 139
Population density:
| Colony Green: | 3,374 people per square mile |
| San Jose: | 5,625 people per square mile |
Median household income in 2021:
| Colony Green: | $109,435 |
| San Jose: | $126,377 |
Median rent in in 2021:
| Colony Green: | $2,577 |
| San Jose: | $2,001 |
Male vs Females
| Males: | 73 |
| Females: | 66 |
Median age
| Males: | 41.2 years |
| Females: | 39.1 years |
Housing prices:
Average estimated value of detached houses in 2021 (5.9% of all units):
| Colony Green: | $7,025,938 |
| San Jose: | $1,403,256 |
Average estimated value of townhouses or other attached units in 2021 (58.8% of all units):
| This neighborhood: | $362,711 |
| city: | $892,629 |
Average estimated '21 value of housing units in 3-to-4-unit structures (19.6% of all units):
| Colony Green: | $322,683 |
| city: | $680,453 |
Average estimated '21 value of housing units in 5-or-more-unit structures (2.0% of all units):
| Colony Green: | $609,284 |
| San Jose: | $688,625 |
Most popular occupations of males: service occupations (15.1%); education, training, and library occupations (12.0%); computer and mathematical occupations (9.8%); sales and office occupations (9.4%); production occupations (8.7%); management occupations (except farmers) (7.8%); construction, extraction, and maintenance occupations (6.2%)
Most popular occupations of females: sales and office occupations (26.6%); management occupations (except farmers) (17.0%); education, training, and library occupations (12.1%); life, physical, and social science occupations (10.5%); service occupations (8.4%); production occupations (5.9%); business and financial operations occupations (5.7%)
Roads and streets: Duesenberg Dr; Colony Field Dr; Colony Green Dr; Colony Crest Dr; Colony Knoll Dr; Colony Park Cir; Colony Cove Dr; Chynoweth Ave; Ave Arboles; Don Correlli Way.
Colony Green neighborhood detailed profile
Comanche neighborhood in San Jose statistics: (Find on map)
Area: 0.243 square miles
Roads and streets: Comanche Dr; Arapaho Dr; Crow Ln; Pontiac Dr; Cheyenne Ln; Paiute Ln; Sioux Ln; Gettysburg Dr; Canton Dr; Pima Dr; Snell Ave; Briarcliff Dr; Comanche Ct; Crow Ct; Chinook Ln; Mohican Dr; Yurok Ct; New Ct; Taconic Ct; Blackhawk Ct; Wells Ct; Deer Ct.
Comanche neighborhood detailed profile
Commodore neighborhood in San Jose statistics: (Find on map)
Area: 0.381 square miles
Population: 3,391
Population density:
Median household income in 2021:
Median rent in in 2021:
Male vs Females
Median age
Housing prices:
Average estimated value of detached houses in 2021 (33.2% of all units):
Average estimated value of townhouses or other attached units in 2021 (67.8% of all units):
Average estimated '21 value of housing units in 5-or-more-unit structures (4.0% of all units):
Most popular occupations of males: architecture and engineering occupations (19.5%); computer and mathematical occupations (15.0%); sales and office occupations (14.6%); construction, extraction, and maintenance occupations (7.7%); management occupations (except farmers) (7.1%); arts, design, entertainment, sports, and media occupations (7.1%); service occupations (5.1%)
Most popular occupations of females: service occupations (19.5%); sales and office occupations (15.9%); business and financial operations occupations (13.5%); production occupations (12.6%); management occupations (except farmers) (11.0%); architecture and engineering occupations (10.0%); computer and mathematical occupations (6.3%)
Limited-access highways (interstate or state) in this neighborhood: I- 680 (Sinclair Fwy).
Roads and streets: Commodore Dr; Cape Horn Dr; Cape Hatteras Way; Ensign Way; Cape Jessup Dr; Junesong Way; Ivy Glen Dr; N Jackson Ave; Cape Buffalo Dr; Branbury Way; Cape Coral Dr; Bluejacket Way; Port Way; Dionne Way; Mossdale Way; Seaman Pl; Cape Misty Dr; Admiral Pl; Puget Sound Way; Cape Diamond Dr; Penwood St; Cape Kennedy Dr; Wave Pl; Seabee Pl; Cape Hilda Pl; Dahlia Ct; Cape Anita Pl; Estee Ct; (Calla Ct); Cadet Pl; Cape Verde Pl; Shellback Pl; Rose Arbor Ct; Cape Mary Pl; Cape Aston Ct; Cape York Pl; Cape George Pl; Ketch Pl; Rock Rose Ct; Fieldstone Ct; Cape Vincent Pl; Fanwood Ct; Cape Morris Pl; Cape Point Pl; Cape Trinity Pl; Celeste Ct; Navy Pl; Cape Breton Pl; Cape Flattery Pl; Cape Town Pl; Cape Jasmine Pl; Tiani Ct; Cape Canaveral Pl; Cape May Pl.
Other features: Upper Penitencia Crk.
Commodore neighborhood detailed profile
Area: 0.381 square miles
Population: 3,391
Population density:
| Commodore: | 8,898 people per square mile |
| San Jose: | 5,625 people per square mile |
Median household income in 2021:
| Commodore: | $143,538 |
| San Jose: | $126,377 |
Median rent in in 2021:
| Commodore: | $2,339 |
| San Jose: | $2,001 |
Male vs Females
| Males: | 1,638 |
| Females: | 1,752 |
Median age
| Males: | 37.3 years |
| Females: | 40.3 years |
Housing prices:
Average estimated value of detached houses in 2021 (33.2% of all units):
| Commodore: | $1,052,204 |
| San Jose: | $1,403,256 |
Average estimated value of townhouses or other attached units in 2021 (67.8% of all units):
| This neighborhood: | $742,677 |
| city: | $892,629 |
Average estimated '21 value of housing units in 5-or-more-unit structures (4.0% of all units):
| Commodore: | $545,034 |
| San Jose: | $688,625 |
Most popular occupations of males: architecture and engineering occupations (19.5%); computer and mathematical occupations (15.0%); sales and office occupations (14.6%); construction, extraction, and maintenance occupations (7.7%); management occupations (except farmers) (7.1%); arts, design, entertainment, sports, and media occupations (7.1%); service occupations (5.1%)
Most popular occupations of females: service occupations (19.5%); sales and office occupations (15.9%); business and financial operations occupations (13.5%); production occupations (12.6%); management occupations (except farmers) (11.0%); architecture and engineering occupations (10.0%); computer and mathematical occupations (6.3%)
Limited-access highways (interstate or state) in this neighborhood: I- 680 (Sinclair Fwy).
Roads and streets: Commodore Dr; Cape Horn Dr; Cape Hatteras Way; Ensign Way; Cape Jessup Dr; Junesong Way; Ivy Glen Dr; N Jackson Ave; Cape Buffalo Dr; Branbury Way; Cape Coral Dr; Bluejacket Way; Port Way; Dionne Way; Mossdale Way; Seaman Pl; Cape Misty Dr; Admiral Pl; Puget Sound Way; Cape Diamond Dr; Penwood St; Cape Kennedy Dr; Wave Pl; Seabee Pl; Cape Hilda Pl; Dahlia Ct; Cape Anita Pl; Estee Ct; (Calla Ct); Cadet Pl; Cape Verde Pl; Shellback Pl; Rose Arbor Ct; Cape Mary Pl; Cape Aston Ct; Cape York Pl; Cape George Pl; Ketch Pl; Rock Rose Ct; Fieldstone Ct; Cape Vincent Pl; Fanwood Ct; Cape Morris Pl; Cape Point Pl; Cape Trinity Pl; Celeste Ct; Navy Pl; Cape Breton Pl; Cape Flattery Pl; Cape Town Pl; Cape Jasmine Pl; Tiani Ct; Cape Canaveral Pl; Cape May Pl.
Other features: Upper Penitencia Crk.
Commodore neighborhood detailed profile
Cornwall neighborhood in San Jose statistics: (Find on map)
Area: 0.087 square miles
Population: 1,626
Population density:
Median household income in 2021:
Median rent in in 2021:
Male vs Females
Median age
Average estimated value of detached houses in 2021 (80.8% of all units):
Most popular occupations of males: service occupations (24.4%); sales and office occupations (19.0%); construction, extraction, and maintenance occupations (17.0%); production occupations (12.6%); transportation occupations (7.7%); management occupations (except farmers) (5.5%); community and social services occupations (5.2%)
Most popular occupations of females: service occupations (39.9%); sales and office occupations (28.9%); education, training, and library occupations (9.5%); management occupations (except farmers) (6.3%); community and social services occupations (3.6%); production occupations (2.8%); arts, design, entertainment, sports, and media occupations (2.1%)
Roads and streets: Murtha Dr; Cornwall Dr; S Capitol Ave; Sundown Ln; Mc Ginness Ave; Sunshadow Ln; Belfast Dr; Coventry Dr; Bristol Dr; Dublin Dr; Suffolk Dr.
Cornwall neighborhood detailed profile
Area: 0.087 square miles
Population: 1,626
Population density:
| Cornwall (Sunshadow): | 18,609 people per square mile |
| San Jose: | 5,625 people per square mile |
Median household income in 2021:
| Cornwall (Sunshadow): | $99,076 |
| San Jose: | $126,377 |
Median rent in in 2021:
| Cornwall (Sunshadow): | $1,902 |
| San Jose: | $2,001 |
Male vs Females
| Males: | 845 |
| Females: | 781 |
Median age
| Males: | 31.2 years |
| Females: | 37.8 years |
Average estimated value of detached houses in 2021 (80.8% of all units):
| Cornwall (Sunshadow): | $635,579 |
| San Jose: | $1,403,256 |
Most popular occupations of males: service occupations (24.4%); sales and office occupations (19.0%); construction, extraction, and maintenance occupations (17.0%); production occupations (12.6%); transportation occupations (7.7%); management occupations (except farmers) (5.5%); community and social services occupations (5.2%)
Most popular occupations of females: service occupations (39.9%); sales and office occupations (28.9%); education, training, and library occupations (9.5%); management occupations (except farmers) (6.3%); community and social services occupations (3.6%); production occupations (2.8%); arts, design, entertainment, sports, and media occupations (2.1%)
Roads and streets: Murtha Dr; Cornwall Dr; S Capitol Ave; Sundown Ln; Mc Ginness Ave; Sunshadow Ln; Belfast Dr; Coventry Dr; Bristol Dr; Dublin Dr; Suffolk Dr.
Cornwall neighborhood detailed profile
Cory neighborhood in San Jose statistics: (Find on map)
Area: 0.494 square miles
Population: 3,554
Population density:
Median household income in 2021:
Median rent in in 2021:
Male vs Females
Median age
Average estimated value of detached houses in 2021 (77.3% of all units):
Most popular occupations of males: management occupations (except farmers) (23.2%); computer and mathematical occupations (14.5%); sales and office occupations (13.8%); construction, extraction, and maintenance occupations (5.5%); service occupations (5.1%); farming, fishing, and forestry occupations (5.1%); architecture and engineering occupations (4.7%)
Most popular occupations of females: sales and office occupations (27.5%); service occupations (18.0%); management occupations (except farmers) (12.2%); business and financial operations occupations (10.2%); education, training, and library occupations (8.6%); healthcare practitioners and technical occupations (5.7%); community and social services occupations (2.9%)
Roads and streets: Walnut Grove Ave; Peachtree Ln; Tulip Rd; Cherrystone Dr; Sunny Vista Dr; Woodland Ave; N Redwood Ave; N Monroe St; Boxwood Dr; Newhall St; Homewood Dr; Tamarack Ave; Kenwood Ave; Heatherdale Ave; Cory Ave; W Hedding St; Broadleaf Ln; N Daniel Way; Redbush Ter; Bascom Ave (N Bascom Ave); N Genevieve Ln; Meadowlark Ave; Linden Dr; Dana Ave; Daniel Way.
Cory neighborhood detailed profile
Area: 0.494 square miles
Population: 3,554
Population density:
| Cory: | 7,197 people per square mile |
| San Jose: | 5,625 people per square mile |
Median household income in 2021:
| Cory: | $133,951 |
| San Jose: | $126,377 |
Median rent in in 2021:
| Cory: | $2,703 |
| San Jose: | $2,001 |
Male vs Females
| Males: | 1,671 |
| Females: | 1,882 |
Median age
| Males: | 33.7 years |
| Females: | 35.6 years |
Average estimated value of detached houses in 2021 (77.3% of all units):
| Cory: | $1,419,603 |
| San Jose: | $1,403,256 |
Most popular occupations of males: management occupations (except farmers) (23.2%); computer and mathematical occupations (14.5%); sales and office occupations (13.8%); construction, extraction, and maintenance occupations (5.5%); service occupations (5.1%); farming, fishing, and forestry occupations (5.1%); architecture and engineering occupations (4.7%)
Most popular occupations of females: sales and office occupations (27.5%); service occupations (18.0%); management occupations (except farmers) (12.2%); business and financial operations occupations (10.2%); education, training, and library occupations (8.6%); healthcare practitioners and technical occupations (5.7%); community and social services occupations (2.9%)
Roads and streets: Walnut Grove Ave; Peachtree Ln; Tulip Rd; Cherrystone Dr; Sunny Vista Dr; Woodland Ave; N Redwood Ave; N Monroe St; Boxwood Dr; Newhall St; Homewood Dr; Tamarack Ave; Kenwood Ave; Heatherdale Ave; Cory Ave; W Hedding St; Broadleaf Ln; N Daniel Way; Redbush Ter; Bascom Ave (N Bascom Ave); N Genevieve Ln; Meadowlark Ave; Linden Dr; Dana Ave; Daniel Way.
Cory neighborhood detailed profile
Country Club neighborhood in San Jose statistics: (Find on map)
Area: 1.264 square miles
Population: 4,391
Population density:
Median household income in 2021:
Median rent in in 2021:
Male vs Females
Median age
Housing prices:
Average estimated value of detached houses in 2021 (97.9% of all units):
Average estimated value of townhouses or other attached units in 2021 (10.1% of all units):
Most popular occupations of males: sales and office occupations (26.8%); management occupations (except farmers) (24.9%); business and financial operations occupations (11.4%); computer and mathematical occupations (9.1%); architecture and engineering occupations (8.8%); service occupations (6.3%); construction, extraction, and maintenance occupations (3.8%)
Most popular occupations of females: sales and office occupations (23.6%); management occupations (except farmers) (21.0%); education, training, and library occupations (11.7%); service occupations (11.6%); business and financial operations occupations (11.3%); healthcare practitioners and technical occupations (7.9%); legal occupations (5.1%)
Limited-access highways (interstate or state) in this neighborhood: Almaden Expy.
Roads and streets: Hampton Dr; Leyland Park Dr; Hillcrest Dr; Echo Valley Dr; Wooded Lake Dr; Chateau Dr; Crystal Springs Dr; Copperwood Cir; Trinidad Dr; Olive Branch Ln; Crown Blvd; Rimrock Dr; Washoe Dr; Camelia Dr; Castlerock Dr; Bose Ln; Little Falls Dr; Lazy River Way; Northridge Dr; Gillis Dr; Trevino Ter; Pajaro Way; Lone Pine Ln; Jeremie Dr; Landerwood Ln; Elwood Rd; Littman Dr; Tam O Shanter Dr; Fall River Dr; Silverado Dr; Wooded Hills Dr; Old Oak Dr; Rockhaven Dr; Golf Creek Dr; Cll Ventura; Lookout Bend; Parma Dr; Goldpine Way; Rockview Ct; Box Canyon Rd; Echo Loop; Royal Ridge Dr; Grapevine Way; Trinidad Ct; Echo Ridge Ct; Echo Ridge Dr; Diablo Way; Hillcrest Ct; Indian Springs Ct; Webb Canyon Dr (Wells Canyon Rd); Weeping Oaks Ct; Hidden Mine Rd; Tivoli Way; Pedrick Ct; Oakcrest Dr; Crystal Springs Ct; Hamida Ct; Swinging Gate Ct; Cranbrook Ct; Whitemarsh Ct; Melba Ct; Boston Post Ct; Serene Valley Ct; Pajaro Ct; Chateau Ct; Goldpine Ct; Cobblestone Ct; Royal Ridge Ct; Shadow Mountain Ct; Bunker Hill Ct; Olive Branch Ct; Wildwood Ct; Red Holly Ct; Chicory Ct; Kettle Ct; Cooperage Ct; Timber Ct; Old Mill Ct; Alleghany Ct; Folklore Ct; American Ct; Coach Ct; Shaker Ct; Buggywhip Ct; Bose Ct; Hearth Ct; Hampton Ct; Jeremie Ct; Freedom Ct; Tradition Ct; Copperwood.
Other features: Greystone Crk; Stream.
Country Club neighborhood detailed profile
Area: 1.264 square miles
Population: 4,391
Population density:
| Country Club: | 3,474 people per square mile |
| San Jose: | 5,625 people per square mile |
Median household income in 2021:
| Country Club: | $225,666 |
| San Jose: | $126,377 |
Median rent in in 2021:
| Country Club: | $3,500 |
| San Jose: | $2,001 |
Male vs Females
| Males: | 2,320 |
| Females: | 2,070 |
Median age
| Males: | 40.6 years |
| Females: | 46.6 years |
Housing prices:
Average estimated value of detached houses in 2021 (97.9% of all units):
| Country Club: | $1,566,369 |
| San Jose: | $1,403,256 |
Average estimated value of townhouses or other attached units in 2021 (10.1% of all units):
| This neighborhood: | $9,815,281 |
| city: | $892,629 |
Most popular occupations of males: sales and office occupations (26.8%); management occupations (except farmers) (24.9%); business and financial operations occupations (11.4%); computer and mathematical occupations (9.1%); architecture and engineering occupations (8.8%); service occupations (6.3%); construction, extraction, and maintenance occupations (3.8%)
Most popular occupations of females: sales and office occupations (23.6%); management occupations (except farmers) (21.0%); education, training, and library occupations (11.7%); service occupations (11.6%); business and financial operations occupations (11.3%); healthcare practitioners and technical occupations (7.9%); legal occupations (5.1%)
Limited-access highways (interstate or state) in this neighborhood: Almaden Expy.
Roads and streets: Hampton Dr; Leyland Park Dr; Hillcrest Dr; Echo Valley Dr; Wooded Lake Dr; Chateau Dr; Crystal Springs Dr; Copperwood Cir; Trinidad Dr; Olive Branch Ln; Crown Blvd; Rimrock Dr; Washoe Dr; Camelia Dr; Castlerock Dr; Bose Ln; Little Falls Dr; Lazy River Way; Northridge Dr; Gillis Dr; Trevino Ter; Pajaro Way; Lone Pine Ln; Jeremie Dr; Landerwood Ln; Elwood Rd; Littman Dr; Tam O Shanter Dr; Fall River Dr; Silverado Dr; Wooded Hills Dr; Old Oak Dr; Rockhaven Dr; Golf Creek Dr; Cll Ventura; Lookout Bend; Parma Dr; Goldpine Way; Rockview Ct; Box Canyon Rd; Echo Loop; Royal Ridge Dr; Grapevine Way; Trinidad Ct; Echo Ridge Ct; Echo Ridge Dr; Diablo Way; Hillcrest Ct; Indian Springs Ct; Webb Canyon Dr (Wells Canyon Rd); Weeping Oaks Ct; Hidden Mine Rd; Tivoli Way; Pedrick Ct; Oakcrest Dr; Crystal Springs Ct; Hamida Ct; Swinging Gate Ct; Cranbrook Ct; Whitemarsh Ct; Melba Ct; Boston Post Ct; Serene Valley Ct; Pajaro Ct; Chateau Ct; Goldpine Ct; Cobblestone Ct; Royal Ridge Ct; Shadow Mountain Ct; Bunker Hill Ct; Olive Branch Ct; Wildwood Ct; Red Holly Ct; Chicory Ct; Kettle Ct; Cooperage Ct; Timber Ct; Old Mill Ct; Alleghany Ct; Folklore Ct; American Ct; Coach Ct; Shaker Ct; Buggywhip Ct; Bose Ct; Hearth Ct; Hampton Ct; Jeremie Ct; Freedom Ct; Tradition Ct; Copperwood.
Other features: Greystone Crk; Stream.
Country Club neighborhood detailed profile
Country Lane neighborhood in San Jose statistics: (Find on map)
Area: 0.467 square miles
Population: 3,413
Population density:
Median household income in 2021:
Median rent in in 2021:
Male vs Females
Median age
Average estimated value of detached houses in 2021 (55.6% of all units):
Most popular occupations of males: management occupations (except farmers) (15.8%); sales and office occupations (14.4%); architecture and engineering occupations (13.6%); transportation occupations (13.6%); service occupations (12.9%); computer and mathematical occupations (11.3%); business and financial operations occupations (5.4%)
Most popular occupations of females: service occupations (43.6%); sales and office occupations (12.5%); business and financial operations occupations (10.3%); education, training, and library occupations (7.9%); architecture and engineering occupations (5.9%); computer and mathematical occupations (5.5%); management occupations (except farmers) (5.2%)
Roads and streets: Englewood Dr; Country Ln; Bela Dr; Rhoda Dr; Lassen Ave; Teresita Dr; Saratoga Ave; Cordelia Ave; Brenton Ave; Happy Valley Ave; Graves Ave; Clarendon Dr; Blueridge Dr; Doyle Rd; Eileen Dr; Shady Ave; Constanso Way; Fields Dr; Burkette Dr; Cameo Dr; Pebble Glen Dr; Ferguson Way; Forest Creek Dr; Greene Dr; el Oso Dr; Crespi Dr; Creekwood Dr; Augusta Way; Olympus Dr; Priscilla Dr; Hoyet Dr; Amondo Dr; Golden Dr; Savoy Dr; Frolic Way; Forest Creek Ct; Constanso Ct.
Country Lane neighborhood detailed profile
Area: 0.467 square miles
Population: 3,413
Population density:
| Country Lane: | 7,313 people per square mile |
| San Jose: | 5,625 people per square mile |
Median household income in 2021:
| Country Lane: | $105,030 |
| San Jose: | $126,377 |
Median rent in in 2021:
| Country Lane: | $2,428 |
| San Jose: | $2,001 |
Male vs Females
| Males: | 1,712 |
| Females: | 1,701 |
Median age
| Males: | 45.4 years |
| Females: | 42.5 years |
Average estimated value of detached houses in 2021 (55.6% of all units):
| Country Lane: | $1,603,571 |
| San Jose: | $1,403,256 |
Most popular occupations of males: management occupations (except farmers) (15.8%); sales and office occupations (14.4%); architecture and engineering occupations (13.6%); transportation occupations (13.6%); service occupations (12.9%); computer and mathematical occupations (11.3%); business and financial operations occupations (5.4%)
Most popular occupations of females: service occupations (43.6%); sales and office occupations (12.5%); business and financial operations occupations (10.3%); education, training, and library occupations (7.9%); architecture and engineering occupations (5.9%); computer and mathematical occupations (5.5%); management occupations (except farmers) (5.2%)
Roads and streets: Englewood Dr; Country Ln; Bela Dr; Rhoda Dr; Lassen Ave; Teresita Dr; Saratoga Ave; Cordelia Ave; Brenton Ave; Happy Valley Ave; Graves Ave; Clarendon Dr; Blueridge Dr; Doyle Rd; Eileen Dr; Shady Ave; Constanso Way; Fields Dr; Burkette Dr; Cameo Dr; Pebble Glen Dr; Ferguson Way; Forest Creek Dr; Greene Dr; el Oso Dr; Crespi Dr; Creekwood Dr; Augusta Way; Olympus Dr; Priscilla Dr; Hoyet Dr; Amondo Dr; Golden Dr; Savoy Dr; Frolic Way; Forest Creek Ct; Constanso Ct.
Country Lane neighborhood detailed profile
Country View Estates neighborhood in San Jose statistics: (Find on map)
Area: 0.368 square miles
Roads and streets: Glenview Dr; Hollow Lake Way; Starling View Dr; Pelican Ridge Dr; Pheasant Hill Way; Mallard Ridge Loop; Pheasant Hill Dr; Spring Hill Way; Starling Ridge Ct; Starling Valley Dr; Mallard Ridge Cir; Eagle Valley Ct; Mallard Ridge Ct; Eagle Cliff Ct; Falcon Ridge Ct; Falcon Knoll Way; Wilhelmina Way; Pheasant Hill Ct; Eagle Crest Ct; Starling View Ct; Falcon Knoll Ct; Mtn Swallow Ct; Mountain Hawk Ct.
Country View Estates neighborhood detailed profile
Countrybrook neighborhood in San Jose statistics: (Find on map)
Area: 0.079 square miles
Population: 826
Population density:
Median household income in 2021:
Median rent in in 2021:
Male vs Females
Median age
Most popular occupations of males: management occupations (except farmers) (15.4%); sales and office occupations (15.1%); computer and mathematical occupations (11.3%); service occupations (10.6%); transportation occupations (8.5%); architecture and engineering occupations (7.9%); construction, extraction, and maintenance occupations (7.7%)
Most popular occupations of females: sales and office occupations (25.2%); service occupations (25.1%); healthcare practitioners and technical occupations (10.8%); management occupations (except farmers) (10.0%); education, training, and library occupations (7.7%); business and financial operations occupations (5.0%); arts, design, entertainment, sports, and media occupations (3.7%)
Roads and streets: Lagoon Way; Countrybrook Way; Trade Zone Blvd; Alveswood Cir; Trade Zone Cir; Garden Bing Cir; N Capitol Ave; N Star Cir; Tradan Dr; Jubilee Ln; Canal Way; Victoria Lndg; Masuda Lndg; Allison Way; Bexley Lndg; Anchor Way; Pond Way; Trade Zone Pl; Trade Zone Ct; Star St.
Countrybrook neighborhood detailed profile
Area: 0.079 square miles
Population: 826
Population density:
| Countrybrook (Lagoon): | 10,450 people per square mile |
| San Jose: | 5,625 people per square mile |
Median household income in 2021:
| Countrybrook (Lagoon): | $128,523 |
| San Jose: | $126,377 |
Median rent in in 2021:
| Countrybrook (Lagoon): | $2,312 |
| San Jose: | $2,001 |
Male vs Females
| Males: | 446 |
| Females: | 379 |
Median age
| Males: | 40.8 years |
| Females: | 46.0 years |
Most popular occupations of males: management occupations (except farmers) (15.4%); sales and office occupations (15.1%); computer and mathematical occupations (11.3%); service occupations (10.6%); transportation occupations (8.5%); architecture and engineering occupations (7.9%); construction, extraction, and maintenance occupations (7.7%)
Most popular occupations of females: sales and office occupations (25.2%); service occupations (25.1%); healthcare practitioners and technical occupations (10.8%); management occupations (except farmers) (10.0%); education, training, and library occupations (7.7%); business and financial operations occupations (5.0%); arts, design, entertainment, sports, and media occupations (3.7%)
Roads and streets: Lagoon Way; Countrybrook Way; Trade Zone Blvd; Alveswood Cir; Trade Zone Cir; Garden Bing Cir; N Capitol Ave; N Star Cir; Tradan Dr; Jubilee Ln; Canal Way; Victoria Lndg; Masuda Lndg; Allison Way; Bexley Lndg; Anchor Way; Pond Way; Trade Zone Pl; Trade Zone Ct; Star St.
Countrybrook neighborhood detailed profile
Coyote neighborhood in San Jose statistics: (Find on map)
Area: 0.187 square miles
Population: 428
Population density:
Median household income in 2021:
Median rent in in 2021:
Male vs Females
Median age
Most popular occupations of males: production occupations (21.2%); architecture and engineering occupations (19.8%); arts, design, entertainment, sports, and media occupations (17.3%); healthcare practitioners and technical occupations (16.8%); sales and office occupations (15.0%); education, training, and library occupations (10.1%); management occupations (except farmers) (7.2%)
Most popular occupations of females: healthcare practitioners and technical occupations (46.1%); education, training, and library occupations (22.6%); sales and office occupations (15.1%); production occupations (11.1%); management occupations (except farmers) (8.4%); business and financial operations occupations (7.6%); arts, design, entertainment, sports, and media occupations (4.1%)
Roads and streets: Coyote Rd; Fontanelle Dr; Archglen Way; Delridge Dr; Fontanelle Ct; Fonick Dr; Eppling Ln; Nicole Ct; Heath Cliff Pl; Fullerton Dr; Latona Ct; Fullerton Ct; Berkeland Ct; Archcove Ct; Rumsey Ct; Ruttner Pl; Parrish Ct; Fontanelle Pl; Gwinn Ct; Scarlett Way; Ruttner Ct; Cornwin Ct.
Coyote neighborhood detailed profile
Area: 0.187 square miles
Population: 428
Population density:
| Coyote (Fontanelle): | 2,288 people per square mile |
| San Jose: | 5,625 people per square mile |
Median household income in 2021:
| Coyote (Fontanelle): | $157,076 |
| San Jose: | $126,377 |
Median rent in in 2021:
| Coyote (Fontanelle): | $3,235 |
| San Jose: | $2,001 |
Male vs Females
| Males: | 236 |
| Females: | 192 |
Median age
| Males: | 36.0 years |
| Females: | 43.2 years |
Most popular occupations of males: production occupations (21.2%); architecture and engineering occupations (19.8%); arts, design, entertainment, sports, and media occupations (17.3%); healthcare practitioners and technical occupations (16.8%); sales and office occupations (15.0%); education, training, and library occupations (10.1%); management occupations (except farmers) (7.2%)
Most popular occupations of females: healthcare practitioners and technical occupations (46.1%); education, training, and library occupations (22.6%); sales and office occupations (15.1%); production occupations (11.1%); management occupations (except farmers) (8.4%); business and financial operations occupations (7.6%); arts, design, entertainment, sports, and media occupations (4.1%)
Roads and streets: Coyote Rd; Fontanelle Dr; Archglen Way; Delridge Dr; Fontanelle Ct; Fonick Dr; Eppling Ln; Nicole Ct; Heath Cliff Pl; Fullerton Dr; Latona Ct; Fullerton Ct; Berkeland Ct; Archcove Ct; Rumsey Ct; Ruttner Pl; Parrish Ct; Fontanelle Pl; Gwinn Ct; Scarlett Way; Ruttner Ct; Cornwin Ct.
Coyote neighborhood detailed profile
Cramer neighborhood in San Jose statistics: (Find on map)
Area: 0.028 square miles
Roads and streets: Cramer Cir; Ingalls Ct; Habbitts Ct; Basin Ct.
Cramer neighborhood detailed profile
Area: 0.028 square miles
Roads and streets: Cramer Cir; Ingalls Ct; Habbitts Ct; Basin Ct.
Cramer neighborhood detailed profile
Creek neighborhood in San Jose statistics: (Find on map)
Area: 0.004 square miles
Population: 38
Population density:
Median household income in 2021:
Median rent in in 2021:
Male vs Females
Median age
Most popular occupations of males: production occupations (24.8%); service occupations (11.6%); architecture and engineering occupations (10.1%); construction, extraction, and maintenance occupations (10.0%); transportation occupations (6.6%); education, training, and library occupations (5.5%); healthcare practitioners and technical occupations (4.9%)
Most popular occupations of females: service occupations (32.7%); sales and office occupations (21.6%); production occupations (13.8%); healthcare practitioners and technical occupations (8.8%); management occupations (except farmers) (7.8%); education, training, and library occupations (5.0%); life, physical, and social science occupations (3.5%)
Roads and streets: Senter Creek Ct; Senter Ct.
Creek neighborhood detailed profile
Area: 0.004 square miles
Population: 38
Population density:
| Creek (Senter): | 9,700 people per square mile |
| San Jose: | 5,625 people per square mile |
Median household income in 2021:
| Creek (Senter): | $81,020 |
| San Jose: | $126,377 |
Median rent in in 2021:
| Creek (Senter): | $1,425 |
| San Jose: | $2,001 |
Male vs Females
| Males: | 19 |
| Females: | 18 |
Median age
| Males: | 36.6 years |
| Females: | 36.3 years |
Most popular occupations of males: production occupations (24.8%); service occupations (11.6%); architecture and engineering occupations (10.1%); construction, extraction, and maintenance occupations (10.0%); transportation occupations (6.6%); education, training, and library occupations (5.5%); healthcare practitioners and technical occupations (4.9%)
Most popular occupations of females: service occupations (32.7%); sales and office occupations (21.6%); production occupations (13.8%); healthcare practitioners and technical occupations (8.8%); management occupations (except farmers) (7.8%); education, training, and library occupations (5.0%); life, physical, and social science occupations (3.5%)
Roads and streets: Senter Creek Ct; Senter Ct.
Creek neighborhood detailed profile
Creekland neighborhood in San Jose statistics: (Find on map)
Area: 0.012 square miles
Population: 47
Population density:
Median household income in 2021:
Median rent in in 2021:
Male vs Females
Median age
Housing prices:
Average estimated value of detached houses in 2021 (100.0% of all units):
Average estimated value of townhouses or other attached units in 2021 (61.5% of all units):
Most popular occupations of males: computer and mathematical occupations (24.5%); construction, extraction, and maintenance occupations (13.6%); management occupations (except farmers) (12.8%); service occupations (12.1%); arts, design, entertainment, sports, and media occupations (10.2%); sales and office occupations (8.5%); material moving occupations (8.2%)
Most popular occupations of females: management occupations (except farmers) (22.7%); sales and office occupations (20.3%); business and financial operations occupations (16.0%); service occupations (14.2%); production occupations (14.0%); legal occupations (10.4%); education, training, and library occupations (8.6%)
Creekland neighborhood detailed profile
Area: 0.012 square miles
Population: 47
Population density:
| Creekland: | 4,057 people per square mile |
| San Jose: | 5,625 people per square mile |
Median household income in 2021:
| Creekland: | $121,683 |
| San Jose: | $126,377 |
Median rent in in 2021:
| Creekland: | $2,526 |
| San Jose: | $2,001 |
Male vs Females
| Males: | 21 |
| Females: | 26 |
Median age
| Males: | 43.5 years |
| Females: | 52.5 years |
Housing prices:
Average estimated value of detached houses in 2021 (100.0% of all units):
| Creekland: | $1,051,501 |
| San Jose: | $1,403,256 |
Average estimated value of townhouses or other attached units in 2021 (61.5% of all units):
| This neighborhood: | $820,443 |
| city: | $892,629 |
Most popular occupations of males: computer and mathematical occupations (24.5%); construction, extraction, and maintenance occupations (13.6%); management occupations (except farmers) (12.8%); service occupations (12.1%); arts, design, entertainment, sports, and media occupations (10.2%); sales and office occupations (8.5%); material moving occupations (8.2%)
Most popular occupations of females: management occupations (except farmers) (22.7%); sales and office occupations (20.3%); business and financial operations occupations (16.0%); service occupations (14.2%); production occupations (14.0%); legal occupations (10.4%); education, training, and library occupations (8.6%)
Creekland neighborhood detailed profile
Creekside neighborhood in San Jose statistics: (Find on map)
Area: 0.319 square miles
Population: 2,085
Population density:
Median household income in 2021:
Median rent in in 2021:
Male vs Females
Median age
Average estimated value of detached houses in 2021 (64.9% of all units):
Most popular occupations of males: sales and office occupations (18.6%); management occupations (except farmers) (15.9%); material moving occupations (13.9%); arts, design, entertainment, sports, and media occupations (12.3%); construction, extraction, and maintenance occupations (8.5%); service occupations (6.9%); education, training, and library occupations (6.3%)
Most popular occupations of females: education, training, and library occupations (24.2%); business and financial operations occupations (19.0%); management occupations (except farmers) (18.4%); sales and office occupations (14.1%); service occupations (12.0%); healthcare practitioners and technical occupations (7.5%); material moving occupations (4.0%)
Roads and streets: Yerba Buena Ave; Timberline Dr; San Felipe Rd; Forestwood Dr; Partridge Dr; Loganberry Dr; Peartree Ln; Deer Isle Dr; Thompson Creek Ct; Prunetree Ln; Evergreen Way; Green Hill Way; Ivywood Ct; Pinecrest Ct; Fourthplain Ct; Forester Ct; Apricot Ln; Greenleaf Ln; Lone Oak Dr; Timberline Ct; Burl Way; Bergman Ct; Partridge Ct; Escalonia Ct; Sugar Pine Ct; Burl Ct; Prunetree Ct; Yerba Buena Ct; Lanes End Pl; Ulman Ct; Millplain Ct; Azzarello Ct.
Other features: Thompson Crk.
Creekside neighborhood detailed profile
Area: 0.319 square miles
Population: 2,085
Population density:
| Creekside: | 6,530 people per square mile |
| San Jose: | 5,625 people per square mile |
Median household income in 2021:
| Creekside: | $163,110 |
| San Jose: | $126,377 |
Median rent in in 2021:
| Creekside: | $3,001 |
| San Jose: | $2,001 |
Male vs Females
| Males: | 1,055 |
| Females: | 1,030 |
Median age
| Males: | 35.9 years |
| Females: | 44.5 years |
Average estimated value of detached houses in 2021 (64.9% of all units):
| Creekside: | $1,038,438 |
| San Jose: | $1,403,256 |
Most popular occupations of males: sales and office occupations (18.6%); management occupations (except farmers) (15.9%); material moving occupations (13.9%); arts, design, entertainment, sports, and media occupations (12.3%); construction, extraction, and maintenance occupations (8.5%); service occupations (6.9%); education, training, and library occupations (6.3%)
Most popular occupations of females: education, training, and library occupations (24.2%); business and financial operations occupations (19.0%); management occupations (except farmers) (18.4%); sales and office occupations (14.1%); service occupations (12.0%); healthcare practitioners and technical occupations (7.5%); material moving occupations (4.0%)
Roads and streets: Yerba Buena Ave; Timberline Dr; San Felipe Rd; Forestwood Dr; Partridge Dr; Loganberry Dr; Peartree Ln; Deer Isle Dr; Thompson Creek Ct; Prunetree Ln; Evergreen Way; Green Hill Way; Ivywood Ct; Pinecrest Ct; Fourthplain Ct; Forester Ct; Apricot Ln; Greenleaf Ln; Lone Oak Dr; Timberline Ct; Burl Way; Bergman Ct; Partridge Ct; Escalonia Ct; Sugar Pine Ct; Burl Ct; Prunetree Ct; Yerba Buena Ct; Lanes End Pl; Ulman Ct; Millplain Ct; Azzarello Ct.
Other features: Thompson Crk.
Creekside neighborhood detailed profile
Crossgate neighborhood in San Jose statistics: (Find on map)
Area: 0.653 square miles
Population: 4,448
Population density:
Median household income in 2021:
Median rent in in 2021:
Male vs Females
Median age
Housing prices:
Average estimated value of detached houses in 2021 (91.9% of all units):
Average estimated value of townhouses or other attached units in 2021 (6.8% of all units):
Average estimated '21 value of housing units in 5-or-more-unit structures (0.4% of all units):
Most popular occupations of males: sales and office occupations (22.1%); management occupations (except farmers) (19.3%); business and financial operations occupations (12.1%); computer and mathematical occupations (11.0%); architecture and engineering occupations (7.8%); service occupations (7.1%); construction, extraction, and maintenance occupations (4.1%)
Most popular occupations of females: sales and office occupations (23.7%); service occupations (19.6%); education, training, and library occupations (16.8%); healthcare practitioners and technical occupations (16.2%); management occupations (except farmers) (6.6%); business and financial operations occupations (5.2%); architecture and engineering occupations (2.6%)
Limited-access highways (interstate or state) in this neighborhood: Almaden Expy.
Roads and streets: Camden Ave; Redmond Ave; Mojave Dr; Mc Abee Rd; el Paseo Dr; Almaden Rd; Firefly Dr; Desert Flame Dr; Culligan Blvd; Crossgates Ln; Nancarrow Way; Oak Forest Way; Dwyer Ave; Golden Oak Way; Peralta Dr; Via Mateo; Bose Ln; Silberman Dr; Pampas Dr; Berwickshire Way; Gondola Way; Addiewell Pl; Paso Los Cerritos; Ostenberg Dr; Castello Dr; Cecala Dr; Burnbank Pl; Kelez Dr; Paseo Pueblo Dr; Butterfly Dr; Via Jose; Carla Dr; Mancuso St; Salvatore Dr; Trinidad Dr; el Prado Dr; Juli Lynn Dr; Via Amigos; Sproul Ct; Mc Abee Estates Pl; Knoll Park Ct; Kelez Ct; Royal Acorn Pl; Big Talk Ct; Harvest Oak Way; Sage Oak Way; Peralta Ct; Deb Ct; Dwyer Ct; Mc Abee Ct; Calligan Blvd; Crestoak Ct; Strelow Ct; Chrismara Ct; McAbee Rd; Ridge Oak Ct; Moss Oak Way; el Prado Ct; Wellmeadow Ct; Meridian Ave; Pernich Ct; Lindahl Ct; Flax Moss Ct; Chrismora Ct; Salvatore Ct; Nancarrow Ct; Candy Lynn Ct; Corte de Belleza (Corte de Bellza); Corte Camula; Carla Ct; Paseo Pueblo Ct; Duet Ct; Abbeyfield Ct; Little Falls Dr.
Other features: Stream.
Crossgate neighborhood detailed profile
Area: 0.653 square miles
Population: 4,448
Population density:
| Crossgate: | 6,815 people per square mile |
| San Jose: | 5,625 people per square mile |
Median household income in 2021:
| Crossgate: | $195,475 |
| San Jose: | $126,377 |
Median rent in in 2021:
| Crossgate: | $2,997 |
| San Jose: | $2,001 |
Male vs Females
| Males: | 2,293 |
| Females: | 2,155 |
Median age
| Males: | 44.2 years |
| Females: | 46.9 years |
Housing prices:
Average estimated value of detached houses in 2021 (91.9% of all units):
| Crossgate: | $1,539,847 |
| San Jose: | $1,403,256 |
Average estimated value of townhouses or other attached units in 2021 (6.8% of all units):
| This neighborhood: | $1,225,869 |
| city: | $892,629 |
Average estimated '21 value of housing units in 5-or-more-unit structures (0.4% of all units):
| Crossgate: | $593,216 |
| San Jose: | $688,625 |
Most popular occupations of males: sales and office occupations (22.1%); management occupations (except farmers) (19.3%); business and financial operations occupations (12.1%); computer and mathematical occupations (11.0%); architecture and engineering occupations (7.8%); service occupations (7.1%); construction, extraction, and maintenance occupations (4.1%)
Most popular occupations of females: sales and office occupations (23.7%); service occupations (19.6%); education, training, and library occupations (16.8%); healthcare practitioners and technical occupations (16.2%); management occupations (except farmers) (6.6%); business and financial operations occupations (5.2%); architecture and engineering occupations (2.6%)
Limited-access highways (interstate or state) in this neighborhood: Almaden Expy.
Roads and streets: Camden Ave; Redmond Ave; Mojave Dr; Mc Abee Rd; el Paseo Dr; Almaden Rd; Firefly Dr; Desert Flame Dr; Culligan Blvd; Crossgates Ln; Nancarrow Way; Oak Forest Way; Dwyer Ave; Golden Oak Way; Peralta Dr; Via Mateo; Bose Ln; Silberman Dr; Pampas Dr; Berwickshire Way; Gondola Way; Addiewell Pl; Paso Los Cerritos; Ostenberg Dr; Castello Dr; Cecala Dr; Burnbank Pl; Kelez Dr; Paseo Pueblo Dr; Butterfly Dr; Via Jose; Carla Dr; Mancuso St; Salvatore Dr; Trinidad Dr; el Prado Dr; Juli Lynn Dr; Via Amigos; Sproul Ct; Mc Abee Estates Pl; Knoll Park Ct; Kelez Ct; Royal Acorn Pl; Big Talk Ct; Harvest Oak Way; Sage Oak Way; Peralta Ct; Deb Ct; Dwyer Ct; Mc Abee Ct; Calligan Blvd; Crestoak Ct; Strelow Ct; Chrismara Ct; McAbee Rd; Ridge Oak Ct; Moss Oak Way; el Prado Ct; Wellmeadow Ct; Meridian Ave; Pernich Ct; Lindahl Ct; Flax Moss Ct; Chrismora Ct; Salvatore Ct; Nancarrow Ct; Candy Lynn Ct; Corte de Belleza (Corte de Bellza); Corte Camula; Carla Ct; Paseo Pueblo Ct; Duet Ct; Abbeyfield Ct; Little Falls Dr.
Other features: Stream.
Crossgate neighborhood detailed profile
Croydon neighborhood in San Jose statistics: (Find on map)
Area: 0.072 square miles
Roads and streets: Weathersfield Way; Dorchester Ln; Croydon Ave; Ashcroft Ln; Seifert Ave; Tubac Ln.
Croydon neighborhood detailed profile
Area: 0.072 square miles
Roads and streets: Weathersfield Way; Dorchester Ln; Croydon Ave; Ashcroft Ln; Seifert Ave; Tubac Ln.
Croydon neighborhood detailed profile
Cypress neighborhood in San Jose statistics: (Find on map)
Area: 0.095 square miles
Population: 979
Population density:
Median household income in 2021:
Median rent in in 2021:
Male vs Females
Median age
Housing prices:
Average estimated value of detached houses in 2021 (7.8% of all units):
Average estimated value of townhouses or other attached units in 2021 (8.9% of all units):
Average estimated '21 value of housing units in 5-or-more-unit structures (4.4% of all units):
Most popular occupations of males: management occupations (except farmers) (22.5%); architecture and engineering occupations (12.2%); construction, extraction, and maintenance occupations (12.2%); community and social services occupations (9.6%); sales and office occupations (8.9%); transportation occupations (8.4%); computer and mathematical occupations (7.4%)
Most popular occupations of females: service occupations (37.3%); education, training, and library occupations (14.9%); sales and office occupations (13.1%); production occupations (9.4%); material moving occupations (9.3%); transportation occupations (5.9%); business and financial operations occupations (3.9%)
Roads and streets: Coakley Dr; Constance Dr; Judro Way; Bundy Ave; S Cypress Ave; Kirkwood Dr; Nolden Ave; Alden Way; Adra Ave; Holly Hock Ct; Box Leaf Ct; Arcadia Dr; Olsen Dr; Quail Bush Ct.
Cypress neighborhood detailed profile
Area: 0.095 square miles
Population: 979
Population density:
| Cypress (Judro): | 10,338 people per square mile |
| San Jose: | 5,625 people per square mile |
Median household income in 2021:
| Cypress (Judro): | $106,832 |
| San Jose: | $126,377 |
Median rent in in 2021:
| Cypress (Judro): | $2,102 |
| San Jose: | $2,001 |
Male vs Females
| Males: | 505 |
| Females: | 473 |
Median age
| Males: | 40.4 years |
| Females: | 43.5 years |
Housing prices:
Average estimated value of detached houses in 2021 (7.8% of all units):
| Cypress (Judro): | $1,258,281 |
| San Jose: | $1,403,256 |
Average estimated value of townhouses or other attached units in 2021 (8.9% of all units):
| This neighborhood: | $3,332,152 |
| city: | $892,629 |
Average estimated '21 value of housing units in 5-or-more-unit structures (4.4% of all units):
| Cypress (Judro): | $834,645 |
| San Jose: | $688,625 |
Most popular occupations of males: management occupations (except farmers) (22.5%); architecture and engineering occupations (12.2%); construction, extraction, and maintenance occupations (12.2%); community and social services occupations (9.6%); sales and office occupations (8.9%); transportation occupations (8.4%); computer and mathematical occupations (7.4%)
Most popular occupations of females: service occupations (37.3%); education, training, and library occupations (14.9%); sales and office occupations (13.1%); production occupations (9.4%); material moving occupations (9.3%); transportation occupations (5.9%); business and financial operations occupations (3.9%)
Roads and streets: Coakley Dr; Constance Dr; Judro Way; Bundy Ave; S Cypress Ave; Kirkwood Dr; Nolden Ave; Alden Way; Adra Ave; Holly Hock Ct; Box Leaf Ct; Arcadia Dr; Olsen Dr; Quail Bush Ct.
Cypress neighborhood detailed profile
Danna Rock neighborhood in San Jose statistics: (Find on map)
Area: 0.231 square miles
Roads and streets: Houndshaven Way; Rotherhaven Way; Branham Ln E; Thornhaven Way; Stoneyhaven Way; Lyric Ln; Eberly Dr; Knightshaven Way; Neilson Ct; Skyway Dr; Collomia Ct; Valleyhaven Way; Lammerhaven Ct; Hines Ct; New St; Aberhaven Ct; Squarehaven Ct; Springhaven Ct; Millhaven Ct; Moundhaven Ct; Eaglehaven Ct; Chapelhaven Ct; Lymehaven Ct; Kirkhaven Ct; Rotherhaven Ct.
Danna Rock neighborhood detailed profile
Dartmouth neighborhood in San Jose statistics: (Find on map)
Area: 0.248 square miles
Population: 2,044
Population density:
Median household income in 2021:
Median rent in in 2021:
Male vs Females
Median age
Housing prices:
Average estimated value of detached houses in 2021 (14.3% of all units):
Average estimated value of townhouses or other attached units in 2021 (19.2% of all units):
Average estimated '21 value of housing units in 5-or-more-unit structures (18.4% of all units):
Most popular occupations of males: service occupations (19.6%); computer and mathematical occupations (19.0%); sales and office occupations (15.9%); transportation occupations (11.0%); business and financial operations occupations (8.1%); architecture and engineering occupations (5.0%); construction, extraction, and maintenance occupations (5.0%)
Most popular occupations of females: service occupations (33.8%); sales and office occupations (23.6%); business and financial operations occupations (17.3%); healthcare practitioners and technical occupations (10.4%); education, training, and library occupations (8.4%); management occupations (except farmers) (4.5%); community and social services occupations (1.5%)
Roads and streets: Blossom Hill Rd; Princeton Dr; Dartmouth Dr; Harvard Dr; Vassar Dr; Dent Ave; Yale Dr; Cornell Dr; Helmond Ln; Meridian Ave; Marquette Dr; Dwight Ave; Purdue Pl; Kooser Rd.
Dartmouth neighborhood detailed profile
Area: 0.248 square miles
Population: 2,044
Population density:
| Dartmouth: | 8,246 people per square mile |
| San Jose: | 5,625 people per square mile |
Median household income in 2021:
| Dartmouth: | $90,319 |
| San Jose: | $126,377 |
Median rent in in 2021:
| Dartmouth: | $2,053 |
| San Jose: | $2,001 |
Male vs Females
| Males: | 1,094 |
| Females: | 950 |
Median age
| Males: | 38.1 years |
| Females: | 39.6 years |
Housing prices:
Average estimated value of detached houses in 2021 (14.3% of all units):
| Dartmouth: | $1,233,462 |
| San Jose: | $1,403,256 |
Average estimated value of townhouses or other attached units in 2021 (19.2% of all units):
| This neighborhood: | $778,138 |
| city: | $892,629 |
Average estimated '21 value of housing units in 5-or-more-unit structures (18.4% of all units):
| Dartmouth: | $705,714 |
| San Jose: | $688,625 |
Most popular occupations of males: service occupations (19.6%); computer and mathematical occupations (19.0%); sales and office occupations (15.9%); transportation occupations (11.0%); business and financial operations occupations (8.1%); architecture and engineering occupations (5.0%); construction, extraction, and maintenance occupations (5.0%)
Most popular occupations of females: service occupations (33.8%); sales and office occupations (23.6%); business and financial operations occupations (17.3%); healthcare practitioners and technical occupations (10.4%); education, training, and library occupations (8.4%); management occupations (except farmers) (4.5%); community and social services occupations (1.5%)
Roads and streets: Blossom Hill Rd; Princeton Dr; Dartmouth Dr; Harvard Dr; Vassar Dr; Dent Ave; Yale Dr; Cornell Dr; Helmond Ln; Meridian Ave; Marquette Dr; Dwight Ave; Purdue Pl; Kooser Rd.
Dartmouth neighborhood detailed profile
David neighborhood in San Jose statistics: (Find on map)
Area: 0.044 square miles
Population: 278
Population density:
Median household income in 2021:
Median rent in in 2021:
Male vs Females
Median age
Average estimated value of detached houses in 2021 (31.5% of all units):
Most popular occupations of males: management occupations (except farmers) (17.5%); computer and mathematical occupations (13.4%); business and financial operations occupations (12.3%); healthcare practitioners and technical occupations (10.8%); service occupations (10.7%); sales and office occupations (10.5%); construction, extraction, and maintenance occupations (9.5%)
Most popular occupations of females: sales and office occupations (33.7%); management occupations (except farmers) (24.5%); healthcare practitioners and technical occupations (17.2%); business and financial operations occupations (6.0%); service occupations (5.1%); legal occupations (5.0%); community and social services occupations (4.0%)
Roads and streets: Monica Ln; David Ave; de Tracey St; Pompey Dr; Merry Ln; Rosemary Ln.
David neighborhood detailed profile
Area: 0.044 square miles
Population: 278
Population density:
| David (Rosemary): | 6,375 people per square mile |
| San Jose: | 5,625 people per square mile |
Median household income in 2021:
| David (Rosemary): | $137,149 |
| San Jose: | $126,377 |
Median rent in in 2021:
| David (Rosemary): | $2,371 |
| San Jose: | $2,001 |
Male vs Females
| Males: | 137 |
| Females: | 141 |
Median age
| Males: | 38.8 years |
| Females: | 39.3 years |
Average estimated value of detached houses in 2021 (31.5% of all units):
| David (Rosemary): | $1,330,313 |
| San Jose: | $1,403,256 |
Most popular occupations of males: management occupations (except farmers) (17.5%); computer and mathematical occupations (13.4%); business and financial operations occupations (12.3%); healthcare practitioners and technical occupations (10.8%); service occupations (10.7%); sales and office occupations (10.5%); construction, extraction, and maintenance occupations (9.5%)
Most popular occupations of females: sales and office occupations (33.7%); management occupations (except farmers) (24.5%); healthcare practitioners and technical occupations (17.2%); business and financial operations occupations (6.0%); service occupations (5.1%); legal occupations (5.0%); community and social services occupations (4.0%)
Roads and streets: Monica Ln; David Ave; de Tracey St; Pompey Dr; Merry Ln; Rosemary Ln.
David neighborhood detailed profile
Davis neighborhood in San Jose statistics: (Find on map)
Area: 0.232 square miles
Population: 3,514
Population density:
Median household income in 2021:
Median rent in in 2021:
Male vs Females
Median age
Housing prices:
Average estimated value of detached houses in 2021 (45.1% of all units):
Average estimated value of mobile home in 2021 (46.5% of all units):
Most popular occupations of males: construction, extraction, and maintenance occupations (23.9%); architecture and engineering occupations (19.6%); production occupations (18.0%); sales and office occupations (14.9%); management occupations (except farmers) (12.0%); business and financial operations occupations (10.8%); education, training, and library occupations (5.8%)
Most popular occupations of females: service occupations (53.6%); sales and office occupations (23.8%); healthcare practitioners and technical occupations (7.0%); management occupations (except farmers) (4.0%); legal occupations (3.9%); computer and mathematical occupations (3.7%); construction, extraction, and maintenance occupations (3.7%)
Roads and streets: Gazania Dr; Page Mill Dr; Edenview Dr; Goldenrain Dr; Rice Dr; Vera Ln; Impatiens Dr; Bengal Dr; Bougainvillea Dr; Corte Verte Dr; Crocker Dr; Gentian Ct; Arnica Ct; Carling Ct; Zeppelin Ct; War Admiral Ave; Grey Ghost Ave; Brice Ct; Crocker Ct; Goldenrain Ct; Cappy Ct; Cineraria Ct; Cyclamen Ct; Calwa Ct; Bengal Ct; Rice Ct.
Davis neighborhood detailed profile
Area: 0.232 square miles
Population: 3,514
Population density:
| Davis: | 15,174 people per square mile |
| San Jose: | 5,625 people per square mile |
Median household income in 2021:
| Davis: | $102,269 |
| San Jose: | $126,377 |
Median rent in in 2021:
| Davis: | $3,298 |
| San Jose: | $2,001 |
Male vs Females
| Males: | 1,615 |
| Females: | 1,898 |
Median age
| Males: | 28.5 years |
| Females: | 34.3 years |
Housing prices:
Average estimated value of detached houses in 2021 (45.1% of all units):
| Davis: | $894,780 |
| San Jose: | $1,403,256 |
Average estimated value of mobile home in 2021 (46.5% of all units):
| Davis: | $153,720 |
| San Jose: | $240,963 |
Most popular occupations of males: construction, extraction, and maintenance occupations (23.9%); architecture and engineering occupations (19.6%); production occupations (18.0%); sales and office occupations (14.9%); management occupations (except farmers) (12.0%); business and financial operations occupations (10.8%); education, training, and library occupations (5.8%)
Most popular occupations of females: service occupations (53.6%); sales and office occupations (23.8%); healthcare practitioners and technical occupations (7.0%); management occupations (except farmers) (4.0%); legal occupations (3.9%); computer and mathematical occupations (3.7%); construction, extraction, and maintenance occupations (3.7%)
Roads and streets: Gazania Dr; Page Mill Dr; Edenview Dr; Goldenrain Dr; Rice Dr; Vera Ln; Impatiens Dr; Bengal Dr; Bougainvillea Dr; Corte Verte Dr; Crocker Dr; Gentian Ct; Arnica Ct; Carling Ct; Zeppelin Ct; War Admiral Ave; Grey Ghost Ave; Brice Ct; Crocker Ct; Goldenrain Ct; Cappy Ct; Cineraria Ct; Cyclamen Ct; Calwa Ct; Bengal Ct; Rice Ct.
Davis neighborhood detailed profile
De Marietta neighborhood in San Jose statistics: (Find on map)
Area: 0.113 square miles
Population: 795
Population density:
Median household income in 2021:
Median rent in in 2021:
Male vs Females
Median age
Most popular occupations of males: computer and mathematical occupations (27.2%); management occupations (except farmers) (16.8%); business and financial operations occupations (16.8%); service occupations (11.3%); education, training, and library occupations (7.6%); transportation occupations (7.3%); architecture and engineering occupations (5.6%)
Most popular occupations of females: sales and office occupations (18.7%); education, training, and library occupations (15.5%); arts, design, entertainment, sports, and media occupations (12.9%); healthcare practitioners and technical occupations (11.6%); computer and mathematical occupations (9.7%); architecture and engineering occupations (9.2%); management occupations (except farmers) (7.1%)
Roads and streets: Stokes St; de Marietta Ave; Leigh Ave; de Marietta Ct.
Other features: Los Gatos Crk.
De Marietta neighborhood detailed profile
Area: 0.113 square miles
Population: 795
Population density:
| De Marietta (Southwest): | 7,009 people per square mile |
| San Jose: | 5,625 people per square mile |
Median household income in 2021:
| De Marietta (Southwest): | $106,156 |
| San Jose: | $126,377 |
Median rent in in 2021:
| De Marietta (Southwest): | $2,509 |
| San Jose: | $2,001 |
Male vs Females
| Males: | 294 |
| Females: | 500 |
Median age
| Males: | 37.9 years |
| Females: | 48.1 years |
Most popular occupations of males: computer and mathematical occupations (27.2%); management occupations (except farmers) (16.8%); business and financial operations occupations (16.8%); service occupations (11.3%); education, training, and library occupations (7.6%); transportation occupations (7.3%); architecture and engineering occupations (5.6%)
Most popular occupations of females: sales and office occupations (18.7%); education, training, and library occupations (15.5%); arts, design, entertainment, sports, and media occupations (12.9%); healthcare practitioners and technical occupations (11.6%); computer and mathematical occupations (9.7%); architecture and engineering occupations (9.2%); management occupations (except farmers) (7.1%)
Roads and streets: Stokes St; de Marietta Ave; Leigh Ave; de Marietta Ct.
Other features: Los Gatos Crk.
De Marietta neighborhood detailed profile
De Voss neighborhood in San Jose statistics: (Find on map)
Area: 0.442 square miles
Population: 2,783
Population density:
Median household income in 2021:
Median rent in in 2021:
Male vs Females
Median age
Housing prices:
Average estimated value of detached houses in 2021 (65.8% of all units):
Average estimated value of townhouses or other attached units in 2021 (8.8% of all units):
Most popular occupations of males: sales and office occupations (15.9%); management occupations (except farmers) (14.6%); computer and mathematical occupations (14.5%); arts, design, entertainment, sports, and media occupations (11.6%); service occupations (8.6%); architecture and engineering occupations (7.9%); transportation occupations (4.9%)
Most popular occupations of females: education, training, and library occupations (23.4%); service occupations (14.2%); business and financial operations occupations (11.7%); sales and office occupations (10.0%); computer and mathematical occupations (9.8%); management occupations (except farmers) (8.0%); architecture and engineering occupations (4.0%)
Roads and streets: Los Gatos Almaden Rd; Laurinda Dr; Leigh Ave; Elrose Ave; Michon Dr; Chevalier Dr; Roxanne Dr; Willow Dr; Noella Way; Lone Hill Rd; Carm Ave; Emiline Dr; Rucker Dr; Harwood Rd; Cordoy Ln; Sandy Ln; Romford Dr; Adelaide Way; Clarinda Way; Cardel Way; Hershner Dr; Selinda Way; Maitland Dr; Selinda Ln; Heather Dr; Warwick Rd; Nerissa Way; Los Aluras Rd (Los Gatos Almaden Rd); Ishimatsu Pl; Kentfield Dr; Heather Ct; Kozo Pl; Michon Ct; Kozo Ct; Catrina Ct.
De Voss neighborhood detailed profile
Area: 0.442 square miles
Population: 2,783
Population density:
| De Voss (Leigh): | 6,290 people per square mile |
| San Jose: | 5,625 people per square mile |
Median household income in 2021:
| De Voss (Leigh): | $176,616 |
| San Jose: | $126,377 |
Median rent in in 2021:
| De Voss (Leigh): | $2,533 |
| San Jose: | $2,001 |
Male vs Females
| Males: | 1,497 |
| Females: | 1,286 |
Median age
| Males: | 39.1 years |
| Females: | 39.0 years |
Housing prices:
Average estimated value of detached houses in 2021 (65.8% of all units):
| De Voss (Leigh): | $1,231,635 |
| San Jose: | $1,403,256 |
Average estimated value of townhouses or other attached units in 2021 (8.8% of all units):
| This neighborhood: | $1,255,797 |
| city: | $892,629 |
Most popular occupations of males: sales and office occupations (15.9%); management occupations (except farmers) (14.6%); computer and mathematical occupations (14.5%); arts, design, entertainment, sports, and media occupations (11.6%); service occupations (8.6%); architecture and engineering occupations (7.9%); transportation occupations (4.9%)
Most popular occupations of females: education, training, and library occupations (23.4%); service occupations (14.2%); business and financial operations occupations (11.7%); sales and office occupations (10.0%); computer and mathematical occupations (9.8%); management occupations (except farmers) (8.0%); architecture and engineering occupations (4.0%)
Roads and streets: Los Gatos Almaden Rd; Laurinda Dr; Leigh Ave; Elrose Ave; Michon Dr; Chevalier Dr; Roxanne Dr; Willow Dr; Noella Way; Lone Hill Rd; Carm Ave; Emiline Dr; Rucker Dr; Harwood Rd; Cordoy Ln; Sandy Ln; Romford Dr; Adelaide Way; Clarinda Way; Cardel Way; Hershner Dr; Selinda Way; Maitland Dr; Selinda Ln; Heather Dr; Warwick Rd; Nerissa Way; Los Aluras Rd (Los Gatos Almaden Rd); Ishimatsu Pl; Kentfield Dr; Heather Ct; Kozo Pl; Michon Ct; Kozo Ct; Catrina Ct.
De Voss neighborhood detailed profile
Deer Run neighborhood in San Jose statistics: (Find on map)
Area: 0.190 square miles
Population: 2,503
Population density:
Median household income in 2021:
Median rent in in 2021:
Male vs Females
Median age
Housing prices:
Average estimated value of detached houses in 2021 (74.5% of all units):
Average estimated value of townhouses or other attached units in 2021 (4.8% of all units):
Average estimated '21 value of housing units in 3-to-4-unit structures (30.6% of all units):
Average estimated '21 value of housing units in 5-or-more-unit structures (2.2% of all units):
Average estimated value of mobile home in 2021 (47.2% of all units):
Most popular occupations of males: service occupations (20.3%); construction, extraction, and maintenance occupations (15.4%); production occupations (11.6%); architecture and engineering occupations (10.9%); business and financial operations occupations (10.2%); sales and office occupations (9.1%); material moving occupations (4.9%)
Most popular occupations of females: service occupations (37.5%); sales and office occupations (30.5%); business and financial operations occupations (10.7%); healthcare practitioners and technical occupations (6.0%); architecture and engineering occupations (5.5%); computer and mathematical occupations (3.1%); legal occupations (1.7%)
Roads and streets: Chynoweth Ave; Garrison Cir; Cherry Blossom Dr; Cashew Blossom Dr; Gerine Blossom Dr; Running Bear Dr; Pecan Blossom Dr; Tomahawk Dr; Apple Blossom Dr; Mill Stone Ln; Country Fields Ln; Lean Ave; Shenado Pl; Mill Creek Ln; Country Oak Ln; Countryside Ln; Broken Lance Ct; Armonk Ct; Cherry Crest Ln; Cherryton Ln; Lemon Blossom Ct; Federation Ct; Country Forge Ln; Mango Blossom Ct; Prune Blossom Dr; Cherry Ridge Ct; Cherry Ridge Ln; Cherry Brook Ln; Cherry Gate Ln; Chynoweth Park Ct; Landau Ct; Poppy Blossom Ct; Ash Grove Ct; Counrtyside Ln; Lime Blossom Ct; Guava Blossom Ct; Country Oak Ct; Jaybee Pl; Wigwam Ct; Waterfall Ct; Pear Blossom Ct.
Deer Run neighborhood detailed profile
Area: 0.190 square miles
Population: 2,503
Population density:
| Deer Run: | 13,167 people per square mile |
| San Jose: | 5,625 people per square mile |
Median household income in 2021:
| Deer Run: | $117,177 |
| San Jose: | $126,377 |
Median rent in in 2021:
| Deer Run: | $2,970 |
| San Jose: | $2,001 |
Male vs Females
| Males: | 1,289 |
| Females: | 1,214 |
Median age
| Males: | 37.7 years |
| Females: | 38.4 years |
Housing prices:
Average estimated value of detached houses in 2021 (74.5% of all units):
| Deer Run: | $892,121 |
| San Jose: | $1,403,256 |
Average estimated value of townhouses or other attached units in 2021 (4.8% of all units):
| This neighborhood: | $534,710 |
| city: | $892,629 |
Average estimated '21 value of housing units in 3-to-4-unit structures (30.6% of all units):
| Deer Run: | $373,134 |
| city: | $680,453 |
Average estimated '21 value of housing units in 5-or-more-unit structures (2.2% of all units):
| Deer Run: | $527,987 |
| San Jose: | $688,625 |
Average estimated value of mobile home in 2021 (47.2% of all units):
| Deer Run: | $153,720 |
| San Jose: | $240,963 |
Most popular occupations of males: service occupations (20.3%); construction, extraction, and maintenance occupations (15.4%); production occupations (11.6%); architecture and engineering occupations (10.9%); business and financial operations occupations (10.2%); sales and office occupations (9.1%); material moving occupations (4.9%)
Most popular occupations of females: service occupations (37.5%); sales and office occupations (30.5%); business and financial operations occupations (10.7%); healthcare practitioners and technical occupations (6.0%); architecture and engineering occupations (5.5%); computer and mathematical occupations (3.1%); legal occupations (1.7%)
Roads and streets: Chynoweth Ave; Garrison Cir; Cherry Blossom Dr; Cashew Blossom Dr; Gerine Blossom Dr; Running Bear Dr; Pecan Blossom Dr; Tomahawk Dr; Apple Blossom Dr; Mill Stone Ln; Country Fields Ln; Lean Ave; Shenado Pl; Mill Creek Ln; Country Oak Ln; Countryside Ln; Broken Lance Ct; Armonk Ct; Cherry Crest Ln; Cherryton Ln; Lemon Blossom Ct; Federation Ct; Country Forge Ln; Mango Blossom Ct; Prune Blossom Dr; Cherry Ridge Ct; Cherry Ridge Ln; Cherry Brook Ln; Cherry Gate Ln; Chynoweth Park Ct; Landau Ct; Poppy Blossom Ct; Ash Grove Ct; Counrtyside Ln; Lime Blossom Ct; Guava Blossom Ct; Country Oak Ct; Jaybee Pl; Wigwam Ct; Waterfall Ct; Pear Blossom Ct.
Deer Run neighborhood detailed profile
Deer Run #2 neighborhood in San Jose statistics: (Find on map)
Area: 0.031 square miles
Population: 248
Population density:
Median household income in 2021:
Median rent in in 2021:
Male vs Females
Median age
Housing prices:
Average estimated value of detached houses in 2021 (60.0% of all units):
Average estimated value of townhouses or other attached units in 2021 (35.8% of all units):
Most popular occupations of males: management occupations (except farmers) (20.7%); sales and office occupations (13.6%); education, training, and library occupations (11.8%); production occupations (11.1%); computer and mathematical occupations (7.4%); business and financial operations occupations (6.3%); service occupations (6.1%)
Most popular occupations of females: sales and office occupations (28.5%); service occupations (15.3%); computer and mathematical occupations (12.8%); business and financial operations occupations (10.7%); healthcare practitioners and technical occupations (7.3%); education, training, and library occupations (6.6%); management occupations (except farmers) (6.2%)
Highways in this neighborhood: Monterey Hwy (State Hwy 82).
Roads and streets: Frontier Trail Dr; Deer Run Cir; Branham Ln E; Canyon Trail Way; Trail Run Ct; Archbow Ct; River Trail Ct (); Raindance Ct; Saddle Brook Rd.
Deer Run #2 neighborhood detailed profile
Area: 0.031 square miles
Population: 248
Population density:
| Deer Run #2 (Deer Run Number 2): | 8,090 people per square mile |
| San Jose: | 5,625 people per square mile |
Median household income in 2021:
| Deer Run #2 (Deer Run Number 2): | $137,851 |
| San Jose: | $126,377 |
Median rent in in 2021:
| Deer Run #2 (Deer Run Number 2): | $3,196 |
| San Jose: | $2,001 |
Male vs Females
| Males: | 135 |
| Females: | 113 |
Median age
| Males: | 44.5 years |
| Females: | 38.0 years |
Housing prices:
Average estimated value of detached houses in 2021 (60.0% of all units):
| Deer Run #2 (Deer Run Number 2): | $833,645 |
| San Jose: | $1,403,256 |
Average estimated value of townhouses or other attached units in 2021 (35.8% of all units):
| This neighborhood: | $938,774 |
| city: | $892,629 |
Most popular occupations of males: management occupations (except farmers) (20.7%); sales and office occupations (13.6%); education, training, and library occupations (11.8%); production occupations (11.1%); computer and mathematical occupations (7.4%); business and financial operations occupations (6.3%); service occupations (6.1%)
Most popular occupations of females: sales and office occupations (28.5%); service occupations (15.3%); computer and mathematical occupations (12.8%); business and financial operations occupations (10.7%); healthcare practitioners and technical occupations (7.3%); education, training, and library occupations (6.6%); management occupations (except farmers) (6.2%)
Highways in this neighborhood: Monterey Hwy (State Hwy 82).
Roads and streets: Frontier Trail Dr; Deer Run Cir; Branham Ln E; Canyon Trail Way; Trail Run Ct; Archbow Ct; River Trail Ct (); Raindance Ct; Saddle Brook Rd.
Deer Run #2 neighborhood detailed profile
Del Mar neighborhood in San Jose statistics: (Find on map)
Area: 0.061 square miles
Roads and streets: Princess Anne Dr; Beatrice Ct; Fruitdale Ave.
Del Mar neighborhood detailed profile
Area: 0.061 square miles
Roads and streets: Princess Anne Dr; Beatrice Ct; Fruitdale Ave.
Del Mar neighborhood detailed profile
Del Robles neighborhood in San Jose statistics: (Find on map)
Area: 0.228 square miles
Population: 1,897
Population density:
Median household income in 2021:
Median rent in in 2021:
Male vs Females
Median age
Housing prices:
Average estimated value of detached houses in 2021 (77.1% of all units):
Average estimated value of townhouses or other attached units in 2021 (9.0% of all units):
Average estimated '21 value of housing units in 3-to-4-unit structures (2.9% of all units):
Average estimated '21 value of housing units in 5-or-more-unit structures (1.0% of all units):
Most popular occupations of males: management occupations (except farmers) (22.6%); service occupations (12.7%); computer and mathematical occupations (12.1%); construction, extraction, and maintenance occupations (9.4%); business and financial operations occupations (6.8%); sales and office occupations (6.6%); healthcare practitioners and technical occupations (4.8%)
Most popular occupations of females: sales and office occupations (28.9%); service occupations (16.3%); business and financial operations occupations (14.8%); management occupations (except farmers) (12.6%); education, training, and library occupations (10.8%); production occupations (5.4%); healthcare practitioners and technical occupations (5.3%)
Roads and streets: Ave Arboles; Ave Almendros; Ave del Roble; Snell Ave; Ave Palmas; Ave Manzanos; Ave Nogales; Ave Pinos; Ave Abetos; Chynoweth Ave; Ent Olmos; Ent Cedros; Giuffrida Ave; Studebaker Cir; Vauxhall Cir; Giuffrida Ct; Ent Oleandros; Daimler Ct.
Del Robles neighborhood detailed profile
Area: 0.228 square miles
Population: 1,897
Population density:
| Del Robles: | 8,307 people per square mile |
| San Jose: | 5,625 people per square mile |
Median household income in 2021:
| Del Robles: | $109,299 |
| San Jose: | $126,377 |
Median rent in in 2021:
| Del Robles: | $2,471 |
| San Jose: | $2,001 |
Male vs Females
| Males: | 1,019 |
| Females: | 877 |
Median age
| Males: | 37.1 years |
| Females: | 37.8 years |
Housing prices:
Average estimated value of detached houses in 2021 (77.1% of all units):
| Del Robles: | $1,171,607 |
| San Jose: | $1,403,256 |
Average estimated value of townhouses or other attached units in 2021 (9.0% of all units):
| This neighborhood: | $607,672 |
| city: | $892,629 |
Average estimated '21 value of housing units in 3-to-4-unit structures (2.9% of all units):
| Del Robles: | $584,615 |
| city: | $680,453 |
Average estimated '21 value of housing units in 5-or-more-unit structures (1.0% of all units):
| Del Robles: | $535,124 |
| San Jose: | $688,625 |
Most popular occupations of males: management occupations (except farmers) (22.6%); service occupations (12.7%); computer and mathematical occupations (12.1%); construction, extraction, and maintenance occupations (9.4%); business and financial operations occupations (6.8%); sales and office occupations (6.6%); healthcare practitioners and technical occupations (4.8%)
Most popular occupations of females: sales and office occupations (28.9%); service occupations (16.3%); business and financial operations occupations (14.8%); management occupations (except farmers) (12.6%); education, training, and library occupations (10.8%); production occupations (5.4%); healthcare practitioners and technical occupations (5.3%)
Roads and streets: Ave Arboles; Ave Almendros; Ave del Roble; Snell Ave; Ave Palmas; Ave Manzanos; Ave Nogales; Ave Pinos; Ave Abetos; Chynoweth Ave; Ent Olmos; Ent Cedros; Giuffrida Ave; Studebaker Cir; Vauxhall Cir; Giuffrida Ct; Ent Oleandros; Daimler Ct.
Del Robles neighborhood detailed profile
Dentwood neighborhood in San Jose statistics: (Find on map)
Area: 0.113 square miles
Population: 1,228
Population density:
Median household income in 2021:
Median rent in in 2021:
Male vs Females
Median age
Average estimated value of townhouses or other attached units in 2021 (17.0% of all units):
Most popular occupations of males: service occupations (25.0%); sales and office occupations (15.3%); computer and mathematical occupations (12.0%); transportation occupations (8.8%); business and financial operations occupations (8.2%); construction, extraction, and maintenance occupations (7.4%); management occupations (except farmers) (3.7%)
Most popular occupations of females: service occupations (43.5%); sales and office occupations (24.1%); healthcare practitioners and technical occupations (10.1%); education, training, and library occupations (9.8%); business and financial operations occupations (8.7%); management occupations (except farmers) (3.6%)
Roads and streets: Dentwood Dr; Blossom Hill Rd; Southbridge Pl; Larchwood Dr; Rimwood Dr; Garwood Dr; Ayrshire Dr; Ridgewood Dr; Ironbridge Way; Coniston Way; Coniston Ct; Foxwood Dr; Greenbank Ct; Foxwood Way; Southbridge Ct; Hennessy Pl.
Dentwood neighborhood detailed profile
Area: 0.113 square miles
Population: 1,228
Population density:
| Dentwood (Southbridge): | 10,820 people per square mile |
| San Jose: | 5,625 people per square mile |
Median household income in 2021:
| Dentwood (Southbridge): | $114,270 |
| San Jose: | $126,377 |
Median rent in in 2021:
| Dentwood (Southbridge): | $1,924 |
| San Jose: | $2,001 |
Male vs Females
| Males: | 686 |
| Females: | 542 |
Median age
| Males: | 40.7 years |
| Females: | 40.7 years |
Average estimated value of townhouses or other attached units in 2021 (17.0% of all units):
| This neighborhood: | $778,138 |
| city: | $892,629 |
Most popular occupations of males: service occupations (25.0%); sales and office occupations (15.3%); computer and mathematical occupations (12.0%); transportation occupations (8.8%); business and financial operations occupations (8.2%); construction, extraction, and maintenance occupations (7.4%); management occupations (except farmers) (3.7%)
Most popular occupations of females: service occupations (43.5%); sales and office occupations (24.1%); healthcare practitioners and technical occupations (10.1%); education, training, and library occupations (9.8%); business and financial operations occupations (8.7%); management occupations (except farmers) (3.6%)
Roads and streets: Dentwood Dr; Blossom Hill Rd; Southbridge Pl; Larchwood Dr; Rimwood Dr; Garwood Dr; Ayrshire Dr; Ridgewood Dr; Ironbridge Way; Coniston Way; Coniston Ct; Foxwood Dr; Greenbank Ct; Foxwood Way; Southbridge Ct; Hennessy Pl.
Dentwood neighborhood detailed profile
Dobern neighborhood in San Jose statistics: (Find on map)
Area: 0.035 square miles
Roads and streets: Kammerer Ave; Dobern Ave; Berkeley Way; S Jackson Ave.
Dobern neighborhood detailed profile
Area: 0.035 square miles
Roads and streets: Kammerer Ave; Dobern Ave; Berkeley Way; S Jackson Ave.
Dobern neighborhood detailed profile
Doerr neighborhood in San Jose statistics: (Find on map)
Area: 0.739 square miles
Population: 7,074
Population density:
Median household income in 2021:
Median rent in in 2021:
Male vs Females
Median age
Housing prices:
Average estimated value of detached houses in 2021 (83.8% of all units):
Average estimated value of townhouses or other attached units in 2021 (8.6% of all units):
Most popular occupations of males: management occupations (except farmers) (36.7%); sales and office occupations (13.8%); service occupations (12.7%); computer and mathematical occupations (6.5%); business and financial operations occupations (5.2%); architecture and engineering occupations (4.6%); legal occupations (4.6%)
Most popular occupations of females: sales and office occupations (39.8%); business and financial operations occupations (13.8%); management occupations (except farmers) (11.8%); education, training, and library occupations (9.4%); service occupations (8.9%); community and social services occupations (5.7%); arts, design, entertainment, sports, and media occupations (3.2%)
Roads and streets: Foxworthy Ave; Meridian Ave; Custer Dr; Hillsdale Ave; Frobisher Way; Dumbarton Ave; Quinto Way; Comstock Ln; Potrero Dr; Curtner Ave; Ross Ave; Paseo Ln; Grizilo Dr; Hill Park Dr; Balsa Ave; Park Wilshire Dr; Willow Creek Dr; Lexford Ave; Harte Dr; Husted Ave; Fabian Dr; Hudson Dr; Julio Ave; Valpico Dr; la Jolla Ave; el Codo Way; Kimber Ct; Don Ave; Kirk Rd; Franela Dr; Yucca Ave; Lorenzen Dr; Wema Way; Hogar Dr; Brighten Ave; Manda Dr; Cyrus Ave; Matzley Dr; Rama Dr; Tioga Way; Valla Dr; Kilo Ave; Raleigh Dr; la Rhee Dr; Lena Dr; Willowcreek Ct; Urna Ave; Lodi Ln; Stacia Dr; Longdale Dr; Comstock Way; Via el Capitan; Nestorita Way; Alta Mira Pl; Matzley Ct; Clare Ct; Cheryl Ann Ct; Karen Ct.
Doerr neighborhood detailed profile
Area: 0.739 square miles
Population: 7,074
Population density:
| Doerr (Steindorf): | 9,567 people per square mile |
| San Jose: | 5,625 people per square mile |
Median household income in 2021:
| Doerr (Steindorf): | $159,849 |
| San Jose: | $126,377 |
Median rent in in 2021:
| Doerr (Steindorf): | $3,496 |
| San Jose: | $2,001 |
Male vs Females
| Males: | 3,504 |
| Females: | 3,570 |
Median age
| Males: | 39.9 years |
| Females: | 41.2 years |
Housing prices:
Average estimated value of detached houses in 2021 (83.8% of all units):
| Doerr (Steindorf): | $1,318,739 |
| San Jose: | $1,403,256 |
Average estimated value of townhouses or other attached units in 2021 (8.6% of all units):
| This neighborhood: | $934,783 |
| city: | $892,629 |
Most popular occupations of males: management occupations (except farmers) (36.7%); sales and office occupations (13.8%); service occupations (12.7%); computer and mathematical occupations (6.5%); business and financial operations occupations (5.2%); architecture and engineering occupations (4.6%); legal occupations (4.6%)
Most popular occupations of females: sales and office occupations (39.8%); business and financial operations occupations (13.8%); management occupations (except farmers) (11.8%); education, training, and library occupations (9.4%); service occupations (8.9%); community and social services occupations (5.7%); arts, design, entertainment, sports, and media occupations (3.2%)
Roads and streets: Foxworthy Ave; Meridian Ave; Custer Dr; Hillsdale Ave; Frobisher Way; Dumbarton Ave; Quinto Way; Comstock Ln; Potrero Dr; Curtner Ave; Ross Ave; Paseo Ln; Grizilo Dr; Hill Park Dr; Balsa Ave; Park Wilshire Dr; Willow Creek Dr; Lexford Ave; Harte Dr; Husted Ave; Fabian Dr; Hudson Dr; Julio Ave; Valpico Dr; la Jolla Ave; el Codo Way; Kimber Ct; Don Ave; Kirk Rd; Franela Dr; Yucca Ave; Lorenzen Dr; Wema Way; Hogar Dr; Brighten Ave; Manda Dr; Cyrus Ave; Matzley Dr; Rama Dr; Tioga Way; Valla Dr; Kilo Ave; Raleigh Dr; la Rhee Dr; Lena Dr; Willowcreek Ct; Urna Ave; Lodi Ln; Stacia Dr; Longdale Dr; Comstock Way; Via el Capitan; Nestorita Way; Alta Mira Pl; Matzley Ct; Clare Ct; Cheryl Ann Ct; Karen Ct.
Doerr neighborhood detailed profile
Doncaster neighborhood in San Jose statistics: (Find on map)
Area: 0.046 square miles
Population: 455
Population density:
Median household income in 2021:
Median rent in in 2021:
Male vs Females
Median age
Most popular occupations of males: service occupations (38.0%); construction, extraction, and maintenance occupations (20.8%); architecture and engineering occupations (11.3%); sales and office occupations (11.1%); production occupations (7.5%); life, physical, and social science occupations (3.9%); community and social services occupations (3.1%)
Most popular occupations of females: sales and office occupations (48.5%); service occupations (16.2%); healthcare practitioners and technical occupations (11.7%); transportation occupations (7.0%); production occupations (6.1%); arts, design, entertainment, sports, and media occupations (5.1%); management occupations (except farmers) (3.8%)
Roads and streets: Farringdon Dr; Warrington Ave; S White Rd; Paddington Way; Sherbrooke Way; Doncaster Way; Chiltern Way.
Doncaster neighborhood detailed profile
Area: 0.046 square miles
Population: 455
Population density:
| Doncaster (Warrington): | 9,970 people per square mile |
| San Jose: | 5,625 people per square mile |
Median household income in 2021:
| Doncaster (Warrington): | $89,726 |
| San Jose: | $126,377 |
Median rent in in 2021:
| Doncaster (Warrington): | $1,716 |
| San Jose: | $2,001 |
Male vs Females
| Males: | 281 |
| Females: | 173 |
Median age
| Males: | 35.2 years |
| Females: | 40.1 years |
Most popular occupations of males: service occupations (38.0%); construction, extraction, and maintenance occupations (20.8%); architecture and engineering occupations (11.3%); sales and office occupations (11.1%); production occupations (7.5%); life, physical, and social science occupations (3.9%); community and social services occupations (3.1%)
Most popular occupations of females: sales and office occupations (48.5%); service occupations (16.2%); healthcare practitioners and technical occupations (11.7%); transportation occupations (7.0%); production occupations (6.1%); arts, design, entertainment, sports, and media occupations (5.1%); management occupations (except farmers) (3.8%)
Roads and streets: Farringdon Dr; Warrington Ave; S White Rd; Paddington Way; Sherbrooke Way; Doncaster Way; Chiltern Way.
Doncaster neighborhood detailed profile
Dorsa neighborhood in San Jose statistics: (Find on map)
Area: 0.285 square miles
Population: 4,325
Population density:
Median household income in 2021:
Median rent in in 2021:
Male vs Females
Median age
Housing prices:
Average estimated value of detached houses in 2021 (80.0% of all units):
Average estimated value of townhouses or other attached units in 2021 (25.6% of all units):
Most popular occupations of males: service occupations (29.3%); construction, extraction, and maintenance occupations (24.0%); sales and office occupations (16.2%); production occupations (10.1%); management occupations (except farmers) (4.8%); transportation occupations (2.9%); education, training, and library occupations (2.8%)
Most popular occupations of females: service occupations (54.1%); sales and office occupations (18.5%); community and social services occupations (6.3%); management occupations (except farmers) (5.7%); production occupations (5.7%); business and financial operations occupations (4.6%); material moving occupations (2.1%)
Roads and streets: Cathay Dr; Bal Harbor Way; Everglade Ave; Biscayne Way; Orlando Dr; Loyola Dr; Seaview Dr; la Porte Ave; Cliffwood Dr; Chiplay Dr; Bermuda Way; Palmview Way; Palmwood Dr; Story Rd; Decatur Dr; Mandarin Way; Naples Dr; Cortez Ave.
Dorsa neighborhood detailed profile
Area: 0.285 square miles
Population: 4,325
Population density:
| Dorsa (Miller): | 15,186 people per square mile |
| San Jose: | 5,625 people per square mile |
Median household income in 2021:
| Dorsa (Miller): | $108,729 |
| San Jose: | $126,377 |
Median rent in in 2021:
| Dorsa (Miller): | $1,780 |
| San Jose: | $2,001 |
Male vs Females
| Males: | 2,151 |
| Females: | 2,174 |
Median age
| Males: | 34.1 years |
| Females: | 36.3 years |
Housing prices:
Average estimated value of detached houses in 2021 (80.0% of all units):
| Dorsa (Miller): | $702,362 |
| San Jose: | $1,403,256 |
Average estimated value of townhouses or other attached units in 2021 (25.6% of all units):
| This neighborhood: | $170,407 |
| city: | $892,629 |
Most popular occupations of males: service occupations (29.3%); construction, extraction, and maintenance occupations (24.0%); sales and office occupations (16.2%); production occupations (10.1%); management occupations (except farmers) (4.8%); transportation occupations (2.9%); education, training, and library occupations (2.8%)
Most popular occupations of females: service occupations (54.1%); sales and office occupations (18.5%); community and social services occupations (6.3%); management occupations (except farmers) (5.7%); production occupations (5.7%); business and financial operations occupations (4.6%); material moving occupations (2.1%)
Roads and streets: Cathay Dr; Bal Harbor Way; Everglade Ave; Biscayne Way; Orlando Dr; Loyola Dr; Seaview Dr; la Porte Ave; Cliffwood Dr; Chiplay Dr; Bermuda Way; Palmview Way; Palmwood Dr; Story Rd; Decatur Dr; Mandarin Way; Naples Dr; Cortez Ave.
Dorsa neighborhood detailed profile
Dove Hill neighborhood in San Jose statistics: (Find on map)
Area: 0.297 square miles
Population: 1,828
Population density:
Median household income in 2021:
Median rent in in 2021:
Male vs Females
Median age
Housing prices:
Average estimated value of detached houses in 2021 (44.1% of all units):
Average estimated value of townhouses or other attached units in 2021 (10.1% of all units):
Most popular occupations of males: service occupations (14.5%); production occupations (11.6%); transportation occupations (11.2%); computer and mathematical occupations (11.0%); management occupations (except farmers) (10.7%); sales and office occupations (9.9%); education, training, and library occupations (3.4%)
Most popular occupations of females: service occupations (30.6%); sales and office occupations (19.7%); production occupations (12.1%); education, training, and library occupations (10.2%); management occupations (except farmers) (9.6%); business and financial operations occupations (4.9%); legal occupations (4.7%)
Limited-access highways (interstate or state) in this neighborhood: US Hwy 101; Capitol Expy (E Capitol Expy).
Roads and streets: Silver Creek Rd; Colt Way; Yerba Buena Rd; Ravens Place Way; Meadow Glen Way; Deans Place Way; Rio de Plata; Carick Place Way; Polton Place Way; Weeping Creek Way; Rio de Perla; Squirecreek Cir; Rio de Esmeralda; Ivycreek Cir; Rio de Lata; Wiven Place Way; Rio de Plomo; Wally Place Way; Rio de Oro; Whinney Place Way; Marsh Manor Way; Gardie Place Way; Rio de Joyas; Ruther Place Way; Seacreek Way; Dove Hill Rd; Mocking Place Way; Muir Place Ct; Cedarcreek Dr; Rio de Plz; Swancreek Way; Brushcreek Way; Via Alegria Ct; Gypsy Place Ct; Sugarcreek Dr; Meadow Glen Ct; Brushcreek Ct; Silver Meadow Ct; Silver Glen Ct; Ruther Place Ct; Cedar Creek Ct; Hollowcreek Pl; Squirecreek Ln; Sugarcreek Ct; Swancreek Ct; Bridal Place Ct; Rox Place Ct; Placercreek Ct; Hollowcreek Ct; Silver Creek Ct; Mosscreek Ln; Seacreek Ct; Cedar Knoll Ct; Lostcreek Ct.
Other features: Silver Crk.
Dove Hill neighborhood detailed profile
Area: 0.297 square miles
Population: 1,828
Population density:
| Dove Hill: | 6,157 people per square mile |
| San Jose: | 5,625 people per square mile |
Median household income in 2021:
| Dove Hill: | $102,053 |
| San Jose: | $126,377 |
Median rent in in 2021:
| Dove Hill: | $1,872 |
| San Jose: | $2,001 |
Male vs Females
| Males: | 944 |
| Females: | 883 |
Median age
| Males: | 44.0 years |
| Females: | 47.3 years |
Housing prices:
Average estimated value of detached houses in 2021 (44.1% of all units):
| Dove Hill: | $1,149,530 |
| San Jose: | $1,403,256 |
Average estimated value of townhouses or other attached units in 2021 (10.1% of all units):
| This neighborhood: | $400,000 |
| city: | $892,629 |
Most popular occupations of males: service occupations (14.5%); production occupations (11.6%); transportation occupations (11.2%); computer and mathematical occupations (11.0%); management occupations (except farmers) (10.7%); sales and office occupations (9.9%); education, training, and library occupations (3.4%)
Most popular occupations of females: service occupations (30.6%); sales and office occupations (19.7%); production occupations (12.1%); education, training, and library occupations (10.2%); management occupations (except farmers) (9.6%); business and financial operations occupations (4.9%); legal occupations (4.7%)
Limited-access highways (interstate or state) in this neighborhood: US Hwy 101; Capitol Expy (E Capitol Expy).
Roads and streets: Silver Creek Rd; Colt Way; Yerba Buena Rd; Ravens Place Way; Meadow Glen Way; Deans Place Way; Rio de Plata; Carick Place Way; Polton Place Way; Weeping Creek Way; Rio de Perla; Squirecreek Cir; Rio de Esmeralda; Ivycreek Cir; Rio de Lata; Wiven Place Way; Rio de Plomo; Wally Place Way; Rio de Oro; Whinney Place Way; Marsh Manor Way; Gardie Place Way; Rio de Joyas; Ruther Place Way; Seacreek Way; Dove Hill Rd; Mocking Place Way; Muir Place Ct; Cedarcreek Dr; Rio de Plz; Swancreek Way; Brushcreek Way; Via Alegria Ct; Gypsy Place Ct; Sugarcreek Dr; Meadow Glen Ct; Brushcreek Ct; Silver Meadow Ct; Silver Glen Ct; Ruther Place Ct; Cedar Creek Ct; Hollowcreek Pl; Squirecreek Ln; Sugarcreek Ct; Swancreek Ct; Bridal Place Ct; Rox Place Ct; Placercreek Ct; Hollowcreek Ct; Silver Creek Ct; Mosscreek Ln; Seacreek Ct; Cedar Knoll Ct; Lostcreek Ct.
Other features: Silver Crk.
Dove Hill neighborhood detailed profile
Downing neighborhood in San Jose statistics: (Find on map)
Area: 0.204 square miles
Population: 1,653
Population density:
Median household income in 2021:
Median rent in in 2021:
Male vs Females
Median age
Most popular occupations of males: computer and mathematical occupations (18.0%); architecture and engineering occupations (14.4%); business and financial operations occupations (13.2%); sales and office occupations (10.5%); management occupations (except farmers) (10.1%); construction, extraction, and maintenance occupations (9.5%); education, training, and library occupations (6.8%)
Most popular occupations of females: sales and office occupations (36.1%); service occupations (13.7%); management occupations (except farmers) (12.6%); education, training, and library occupations (10.1%); business and financial operations occupations (8.3%); healthcare practitioners and technical occupations (6.4%); computer and mathematical occupations (3.9%)
Roads and streets: Downing Ave; S Bascom Ave; Whitethorne Dr; Stokes St; Spruance St; Eisenhower Dr; Aram Ave; Arnold Way; Wainwright Dr; Lindbergh Ave; Ginger Ln; Norstad St; Rickenbacker St; Tolworth Dr; Delna Manor Ln; Quantico Ct; Nautilus Ct; Redbud Ct; Wooding Ct; Bayleaf Ct; Dogwood Ct; Greenbay Ct; Romero St; Bess Ct; Porgy Pl; Dillard Ct.
Downing neighborhood detailed profile
Area: 0.204 square miles
Population: 1,653
Population density:
| Downing (Whitethorne): | 8,115 people per square mile |
| San Jose: | 5,625 people per square mile |
Median household income in 2021:
| Downing (Whitethorne): | $124,695 |
| San Jose: | $126,377 |
Median rent in in 2021:
| Downing (Whitethorne): | $2,132 |
| San Jose: | $2,001 |
Male vs Females
| Males: | 894 |
| Females: | 759 |
Median age
| Males: | 34.7 years |
| Females: | 42.6 years |
Most popular occupations of males: computer and mathematical occupations (18.0%); architecture and engineering occupations (14.4%); business and financial operations occupations (13.2%); sales and office occupations (10.5%); management occupations (except farmers) (10.1%); construction, extraction, and maintenance occupations (9.5%); education, training, and library occupations (6.8%)
Most popular occupations of females: sales and office occupations (36.1%); service occupations (13.7%); management occupations (except farmers) (12.6%); education, training, and library occupations (10.1%); business and financial operations occupations (8.3%); healthcare practitioners and technical occupations (6.4%); computer and mathematical occupations (3.9%)
Roads and streets: Downing Ave; S Bascom Ave; Whitethorne Dr; Stokes St; Spruance St; Eisenhower Dr; Aram Ave; Arnold Way; Wainwright Dr; Lindbergh Ave; Ginger Ln; Norstad St; Rickenbacker St; Tolworth Dr; Delna Manor Ln; Quantico Ct; Nautilus Ct; Redbud Ct; Wooding Ct; Bayleaf Ct; Dogwood Ct; Greenbay Ct; Romero St; Bess Ct; Porgy Pl; Dillard Ct.
Downing neighborhood detailed profile
Downtown neighborhood in San Jose statistics: (Find on map)
Area: 5.038 square miles
Population: 45,054
Population density:
Median household income in 2021:
Median rent in in 2021:
Male vs Females
Median age
Housing prices:
Average estimated value of detached houses in 2021 (28.6% of all units):
Average estimated value of townhouses or other attached units in 2021 (11.9% of all units):
Average estimated '21 value of housing units in 5-or-more-unit structures (51.9% of all units):
Most popular occupations of males: management occupations (except farmers) (14.7%); service occupations (14.7%); computer and mathematical occupations (13.9%); sales and office occupations (10.0%); architecture and engineering occupations (8.3%); construction, extraction, and maintenance occupations (7.4%); business and financial operations occupations (7.2%)
Most popular occupations of females: sales and office occupations (25.1%); service occupations (19.1%); management occupations (except farmers) (12.0%); business and financial operations occupations (9.2%); computer and mathematical occupations (7.3%); healthcare practitioners and technical occupations (6.5%); education, training, and library occupations (6.4%)
Limited-access highways (interstate or state) in this neighborhood: State Hwy 87 (Guadalupe Pkwy); Nimitz Fwy (I- 880); State Hwy 87; I- 280 (Sinclair Fwy); Guadalupe Fwy (State Hwy 87).
Highways in this neighborhood: State Hwy 82 (W San Carlos St).
Roads and streets: N 1st St (N 1st Street); N 4th St; N 5th St; N San Pedro St; N 7th St; N 2nd St; N 10th St; N 11th St; E Taylor St; Jackson St; N 3rd St; N 6th St; E Empire St; N 13th St; N 12th St; N 17th St; N 9th St; E Mission St; E Julian St; N 15th St; N 8th St; N 16th St; E Saint James St; Washington St; N 18th St; E Hedding St; N 14th St; E St John St; E William St; N 19th St; E Santa Clara St; E San Carlos St; E San Fernando St; E San Salvador St; S Market St; E Reed St; S 12th St; S 11th St; S 10th St; N 20th St; S 9th St; Margaret St; Technology Dr; N 21st St; S 15th St; S 13th St; S 14th St; S 16th St; S 1st Street (S 1st St); S 3rd St; S 2nd St; N Market St; S 4th St; S 7th St; S 8th St; E San Antonio St; S 6th St; Old Bayshore Hwy; W San Fernando St; S 17th St; Metro Dr; Vestal St; Park Ave; Woz Way; E Younger Ave; Commercial St; Forrestal Ave; Almaden Blvd; Santa Paula Ave; San Juan Ave; Keoncrest Ave; W Hedding St; Kerley Dr; Bassett St; S Almaden Ave; S 5th St; W Julian St; Almaden Blvd (Vine St); Skyport Dr; E Gish Rd; W Rosemary St; W Gish Rd; Airport Pkwy; W Mission St; Paseo de San Antonio Walk; Sonora Ave; Arnold Ave; W Santa Clara St; Post St; W Younger Ave; W Reed St; Horning St; W St James St; Ferrari Ave; W Taylor St; Gateway Pl; Koll Cir; Asbury St; Hawthorne Way; Hobson St; Miller St; George St; Devine St; Clayton Ave; Berryessa Rd; Madera Ave; Burton Ave; E Rosemary St; Hensley St; New St; Pierce Ave; Archer St; Arroyo Way; San Pedro Cir; Old Oakland Rd (Oakland Rd); Old W Julian St; Balbach St; Coleman Ave; Monferino Dr; E Virginia St; W St John St; N 22nd St; N Bayshore Rd W; W William St; Ayer Ave; Viola Ave; Santa Ana St; W Saint John St; Fox Ave; Rankin Ave; N Almaden Blvd; N Almaden Ave; Pso de San Antonio; Notre Dame Ave; S San Pedro St; Ryland St; Terrane St (Terraine St); Orvis Ave; Carlysle St; Prevost St; Kinney Dr; Terrace Dr; Century Center Ct; Juvenile Hall Acc; de Mattei Ct; Acacia St; Filomena Ave; Terraine St; Auzerais Ave; Marianelli Ct; Elizabeth St; Fountain Aly; Warren St; Lightson St; Locust St; Roosevelt St; W Empire St; W San Salvador St; Carrie St; Quailbrook Ct; Losse Ct; Colton Pl; Glithero Ct; Houghton Ct; Calumet Ct.
Railroad features: Union Pacific RR.
Other features: Guadalupe Riv; Coyote Crk.
Downtown neighborhood detailed profile
Area: 5.038 square miles
Population: 45,054
Population density:
| Downtown: | 8,942 people per square mile |
| San Jose: | 5,625 people per square mile |
Median household income in 2021:
| Downtown: | $116,385 |
| San Jose: | $126,377 |
Median rent in in 2021:
| Downtown: | $2,024 |
| San Jose: | $2,001 |
Male vs Females
| Males: | 24,273 |
| Females: | 21,033 |
Median age
| Males: | 35.8 years |
| Females: | 35.5 years |
Housing prices:
Average estimated value of detached houses in 2021 (28.6% of all units):
| Downtown: | $1,034,811 |
| San Jose: | $1,403,256 |
Average estimated value of townhouses or other attached units in 2021 (11.9% of all units):
| This neighborhood: | $912,195 |
| city: | $892,629 |
Average estimated '21 value of housing units in 5-or-more-unit structures (51.9% of all units):
| Downtown: | $667,381 |
| San Jose: | $688,625 |
Most popular occupations of males: management occupations (except farmers) (14.7%); service occupations (14.7%); computer and mathematical occupations (13.9%); sales and office occupations (10.0%); architecture and engineering occupations (8.3%); construction, extraction, and maintenance occupations (7.4%); business and financial operations occupations (7.2%)
Most popular occupations of females: sales and office occupations (25.1%); service occupations (19.1%); management occupations (except farmers) (12.0%); business and financial operations occupations (9.2%); computer and mathematical occupations (7.3%); healthcare practitioners and technical occupations (6.5%); education, training, and library occupations (6.4%)
Limited-access highways (interstate or state) in this neighborhood: State Hwy 87 (Guadalupe Pkwy); Nimitz Fwy (I- 880); State Hwy 87; I- 280 (Sinclair Fwy); Guadalupe Fwy (State Hwy 87).
Highways in this neighborhood: State Hwy 82 (W San Carlos St).
Roads and streets: N 1st St (N 1st Street); N 4th St; N 5th St; N San Pedro St; N 7th St; N 2nd St; N 10th St; N 11th St; E Taylor St; Jackson St; N 3rd St; N 6th St; E Empire St; N 13th St; N 12th St; N 17th St; N 9th St; E Mission St; E Julian St; N 15th St; N 8th St; N 16th St; E Saint James St; Washington St; N 18th St; E Hedding St; N 14th St; E St John St; E William St; N 19th St; E Santa Clara St; E San Carlos St; E San Fernando St; E San Salvador St; S Market St; E Reed St; S 12th St; S 11th St; S 10th St; N 20th St; S 9th St; Margaret St; Technology Dr; N 21st St; S 15th St; S 13th St; S 14th St; S 16th St; S 1st Street (S 1st St); S 3rd St; S 2nd St; N Market St; S 4th St; S 7th St; S 8th St; E San Antonio St; S 6th St; Old Bayshore Hwy; W San Fernando St; S 17th St; Metro Dr; Vestal St; Park Ave; Woz Way; E Younger Ave; Commercial St; Forrestal Ave; Almaden Blvd; Santa Paula Ave; San Juan Ave; Keoncrest Ave; W Hedding St; Kerley Dr; Bassett St; S Almaden Ave; S 5th St; W Julian St; Almaden Blvd (Vine St); Skyport Dr; E Gish Rd; W Rosemary St; W Gish Rd; Airport Pkwy; W Mission St; Paseo de San Antonio Walk; Sonora Ave; Arnold Ave; W Santa Clara St; Post St; W Younger Ave; W Reed St; Horning St; W St James St; Ferrari Ave; W Taylor St; Gateway Pl; Koll Cir; Asbury St; Hawthorne Way; Hobson St; Miller St; George St; Devine St; Clayton Ave; Berryessa Rd; Madera Ave; Burton Ave; E Rosemary St; Hensley St; New St; Pierce Ave; Archer St; Arroyo Way; San Pedro Cir; Old Oakland Rd (Oakland Rd); Old W Julian St; Balbach St; Coleman Ave; Monferino Dr; E Virginia St; W St John St; N 22nd St; N Bayshore Rd W; W William St; Ayer Ave; Viola Ave; Santa Ana St; W Saint John St; Fox Ave; Rankin Ave; N Almaden Blvd; N Almaden Ave; Pso de San Antonio; Notre Dame Ave; S San Pedro St; Ryland St; Terrane St (Terraine St); Orvis Ave; Carlysle St; Prevost St; Kinney Dr; Terrace Dr; Century Center Ct; Juvenile Hall Acc; de Mattei Ct; Acacia St; Filomena Ave; Terraine St; Auzerais Ave; Marianelli Ct; Elizabeth St; Fountain Aly; Warren St; Lightson St; Locust St; Roosevelt St; W Empire St; W San Salvador St; Carrie St; Quailbrook Ct; Losse Ct; Colton Pl; Glithero Ct; Houghton Ct; Calumet Ct.
Railroad features: Union Pacific RR.
Other features: Guadalupe Riv; Coyote Crk.
Downtown neighborhood detailed profile
Drake neighborhood in San Jose statistics: (Find on map)
Area: 0.051 square miles
Population: 569
Population density:
Median household income in 2021:
Median rent in in 2021:
Male vs Females
Median age
Housing prices:
Average estimated value of detached houses in 2021 (69.2% of all units):
Most popular occupations of males: architecture and engineering occupations (18.9%); sales and office occupations (18.6%); management occupations (except farmers) (15.0%); arts, design, entertainment, sports, and media occupations (10.6%); computer and mathematical occupations (9.3%); service occupations (4.4%); legal occupations (4.1%)
Most popular occupations of females: arts, design, entertainment, sports, and media occupations (235.6%); life, physical, and social science occupations (134.6%); sales and office occupations (30.0%); management occupations (except farmers) (24.9%); healthcare practitioners and technical occupations (17.5%); material moving occupations (9.0%); computer and mathematical occupations (8.2%)
Roads and streets: Fuller Ave; Bird Ave; West Virginia St; Harrison St; Drake St; Gregory St; Hulet St; Helen St.
Railroad features: Union Pacific RR.
Drake neighborhood detailed profile
Area: 0.051 square miles
Population: 569
Population density:
| Drake (Fuller): | 11,114 people per square mile |
| San Jose: | 5,625 people per square mile |
Median household income in 2021:
| Drake (Fuller): | $157,862 |
| San Jose: | $126,377 |
Median rent in in 2021:
| Drake (Fuller): | $1,977 |
| San Jose: | $2,001 |
Male vs Females
| Males: | 266 |
| Females: | 302 |
Median age
| Males: | 37.4 years |
| Females: | 33.6 years |
Housing prices:
Average estimated value of detached houses in 2021 (69.2% of all units):
| Drake (Fuller): | $1,081,706 |
| San Jose: | $1,403,256 |
Most popular occupations of males: architecture and engineering occupations (18.9%); sales and office occupations (18.6%); management occupations (except farmers) (15.0%); arts, design, entertainment, sports, and media occupations (10.6%); computer and mathematical occupations (9.3%); service occupations (4.4%); legal occupations (4.1%)
Most popular occupations of females: arts, design, entertainment, sports, and media occupations (235.6%); life, physical, and social science occupations (134.6%); sales and office occupations (30.0%); management occupations (except farmers) (24.9%); healthcare practitioners and technical occupations (17.5%); material moving occupations (9.0%); computer and mathematical occupations (8.2%)
Roads and streets: Fuller Ave; Bird Ave; West Virginia St; Harrison St; Drake St; Gregory St; Hulet St; Helen St.
Railroad features: Union Pacific RR.
Drake neighborhood detailed profile
Dry Creek neighborhood in San Jose statistics: (Find on map)
Area: 0.260 square miles
Population: 2,524
Population density:
Median household income in 2021:
Median rent in in 2021:
Male vs Females
Median age
Average estimated value of detached houses in 2021 (59.1% of all units):
Most popular occupations of males: management occupations (except farmers) (36.3%); construction, extraction, and maintenance occupations (13.3%); service occupations (13.1%); sales and office occupations (9.7%); computer and mathematical occupations (9.4%); architecture and engineering occupations (8.1%); business and financial operations occupations (4.6%)
Most popular occupations of females: sales and office occupations (27.7%); healthcare practitioners and technical occupations (14.2%); education, training, and library occupations (13.1%); business and financial operations occupations (8.5%); service occupations (7.8%); management occupations (except farmers) (6.9%); production occupations (6.3%)
Roads and streets: Dry Creek Rd; Harris Ave; Gunar Dr; New Jersey Ave; Shulman Ave; Leigh Ave; Schrader Dr; Kirby Way; Pauline Dr; Curtner Ave; St Lawrence Dr; Elden Dr; Somersworth Dr; Price Way; Schubert Ave; Hocking Way; Quebec Way; Ontario Dr; Ben Hur Ct; Gladys Way; Horace Ave; Kayla Ct; Dry Creek Ct; Cavalier Ct; Dry Creek.
Dry Creek neighborhood detailed profile
Area: 0.260 square miles
Population: 2,524
Population density:
| Dry Creek: | 9,715 people per square mile |
| San Jose: | 5,625 people per square mile |
Median household income in 2021:
| Dry Creek: | $170,379 |
| San Jose: | $126,377 |
Median rent in in 2021:
| Dry Creek: | $2,395 |
| San Jose: | $2,001 |
Male vs Females
| Males: | 1,176 |
| Females: | 1,347 |
Median age
| Males: | 44.1 years |
| Females: | 42.0 years |
Average estimated value of detached houses in 2021 (59.1% of all units):
| Dry Creek: | $1,221,262 |
| San Jose: | $1,403,256 |
Most popular occupations of males: management occupations (except farmers) (36.3%); construction, extraction, and maintenance occupations (13.3%); service occupations (13.1%); sales and office occupations (9.7%); computer and mathematical occupations (9.4%); architecture and engineering occupations (8.1%); business and financial operations occupations (4.6%)
Most popular occupations of females: sales and office occupations (27.7%); healthcare practitioners and technical occupations (14.2%); education, training, and library occupations (13.1%); business and financial operations occupations (8.5%); service occupations (7.8%); management occupations (except farmers) (6.9%); production occupations (6.3%)
Roads and streets: Dry Creek Rd; Harris Ave; Gunar Dr; New Jersey Ave; Shulman Ave; Leigh Ave; Schrader Dr; Kirby Way; Pauline Dr; Curtner Ave; St Lawrence Dr; Elden Dr; Somersworth Dr; Price Way; Schubert Ave; Hocking Way; Quebec Way; Ontario Dr; Ben Hur Ct; Gladys Way; Horace Ave; Kayla Ct; Dry Creek Ct; Cavalier Ct; Dry Creek.
Dry Creek neighborhood detailed profile
East Campus neighborhood in San Jose statistics: (Find on map)
Area: 0.103 square miles
Population: 1,098
Population density:
Median household income in 2021:
Median rent in in 2021:
Male vs Females
Median age
Most popular occupations of males: computer and mathematical occupations (24.9%); service occupations (21.0%); management occupations (except farmers) (13.4%); business and financial operations occupations (12.8%); sales and office occupations (7.4%); transportation occupations (6.4%); education, training, and library occupations (5.4%)
Most popular occupations of females: management occupations (except farmers) (19.1%); education, training, and library occupations (17.0%); computer and mathematical occupations (11.8%); business and financial operations occupations (10.8%); sales and office occupations (10.4%); legal occupations (9.7%); architecture and engineering occupations (5.7%)
Limited-access highways (interstate or state) in this neighborhood: Sinclair Fwy (I- 280).
Roads and streets: S 11th St; S 10th St; E Virginia St; Margaret St; E William St; E Reed St.
East Campus neighborhood detailed profile
Area: 0.103 square miles
Population: 1,098
Population density:
| East Campus: | 10,653 people per square mile |
| San Jose: | 5,625 people per square mile |
Median household income in 2021:
| East Campus: | $184,878 |
| San Jose: | $126,377 |
Median rent in in 2021:
| East Campus: | $1,531 |
| San Jose: | $2,001 |
Male vs Females
| Males: | 608 |
| Females: | 490 |
Median age
| Males: | 41.6 years |
| Females: | 45.2 years |
Most popular occupations of males: computer and mathematical occupations (24.9%); service occupations (21.0%); management occupations (except farmers) (13.4%); business and financial operations occupations (12.8%); sales and office occupations (7.4%); transportation occupations (6.4%); education, training, and library occupations (5.4%)
Most popular occupations of females: management occupations (except farmers) (19.1%); education, training, and library occupations (17.0%); computer and mathematical occupations (11.8%); business and financial operations occupations (10.8%); sales and office occupations (10.4%); legal occupations (9.7%); architecture and engineering occupations (5.7%)
Limited-access highways (interstate or state) in this neighborhood: Sinclair Fwy (I- 280).
Roads and streets: S 11th St; S 10th St; E Virginia St; Margaret St; E William St; E Reed St.
East Campus neighborhood detailed profile
East Dobern neighborhood in San Jose statistics: (Find on map)
Area: 0.078 square miles
Population: 498
Population density:
Median household income in 2021:
Median rent in in 2021:
Male vs Females
Median age
Average estimated value of detached houses in 2021 (44.8% of all units):
Most popular occupations of males: construction, extraction, and maintenance occupations (32.9%); service occupations (21.8%); sales and office occupations (13.1%); management occupations (except farmers) (10.2%); material moving occupations (8.8%); arts, design, entertainment, sports, and media occupations (2.0%); farming, fishing, and forestry occupations (1.5%)
Most popular occupations of females: sales and office occupations (21.8%); production occupations (18.4%); service occupations (17.2%); management occupations (except farmers) (15.0%); education, training, and library occupations (14.5%); healthcare practitioners and technical occupations (5.5%); construction, extraction, and maintenance occupations (4.3%)
Limited-access highways (interstate or state) in this neighborhood: Capitol Expy (E Capitol Expy).
Roads and streets: Dobern Ave; Summer St; Pendragon Ln; Highwood Dr; Massar Ave; Clyda Dr; Abed Ct; S Capitol Ave; Summer Ct; Excalibur Dr; Rivermont Ct; Penrod Pl; Georginia Ave; Gittle Ct; Soni Ct; Lombard Ave.
Other features: Silver Crk.
East Dobern neighborhood detailed profile
Area: 0.078 square miles
Population: 498
Population density:
| East Dobern: | 6,380 people per square mile |
| San Jose: | 5,625 people per square mile |
Median household income in 2021:
| East Dobern: | $110,850 |
| San Jose: | $126,377 |
Median rent in in 2021:
| East Dobern: | $2,189 |
| San Jose: | $2,001 |
Male vs Females
| Males: | 280 |
| Females: | 218 |
Median age
| Males: | 34.2 years |
| Females: | 39.5 years |
Average estimated value of detached houses in 2021 (44.8% of all units):
| East Dobern: | $713,850 |
| San Jose: | $1,403,256 |
Most popular occupations of males: construction, extraction, and maintenance occupations (32.9%); service occupations (21.8%); sales and office occupations (13.1%); management occupations (except farmers) (10.2%); material moving occupations (8.8%); arts, design, entertainment, sports, and media occupations (2.0%); farming, fishing, and forestry occupations (1.5%)
Most popular occupations of females: sales and office occupations (21.8%); production occupations (18.4%); service occupations (17.2%); management occupations (except farmers) (15.0%); education, training, and library occupations (14.5%); healthcare practitioners and technical occupations (5.5%); construction, extraction, and maintenance occupations (4.3%)
Limited-access highways (interstate or state) in this neighborhood: Capitol Expy (E Capitol Expy).
Roads and streets: Dobern Ave; Summer St; Pendragon Ln; Highwood Dr; Massar Ave; Clyda Dr; Abed Ct; S Capitol Ave; Summer Ct; Excalibur Dr; Rivermont Ct; Penrod Pl; Georginia Ave; Gittle Ct; Soni Ct; Lombard Ave.
Other features: Silver Crk.
East Dobern neighborhood detailed profile
East Northside neighborhood in San Jose statistics: (Find on map)
Area: 0.662 square miles
Population: 8,612
Population density:
Median household income in 2021:
Median rent in in 2021:
Male vs Females
Median age
Average estimated value of detached houses in 2021 (56.7% of all units):
Most popular occupations of males: construction, extraction, and maintenance occupations (16.5%); service occupations (15.0%); management occupations (except farmers) (14.6%); computer and mathematical occupations (7.9%); sales and office occupations (6.7%); material moving occupations (6.6%); business and financial operations occupations (6.3%)
Most popular occupations of females: service occupations (25.8%); management occupations (except farmers) (22.9%); sales and office occupations (21.3%); business and financial operations occupations (5.4%); community and social services occupations (4.5%); production occupations (4.2%); computer and mathematical occupations (3.9%)
Roads and streets: N 16th St; N 17th St; N 15th St; N 18th St; N 19th St; N 14th St; E Taylor St; N 20th St; N 21st St; Jackson St; E Mission St; E Empire St; Washington St; E Hedding St; Vestal St; E Julian St; Monferino Dr; N 22nd St; N 23rd St; Terrace Dr; de Mattei Ct; Marianelli Ct; N Bayshore Rd W; Glithero Ct; Houghton Ct; Calumet Ct.
Other features: Coyote Crk.
East Northside neighborhood detailed profile
Area: 0.662 square miles
Population: 8,612
Population density:
| East Northside: | 13,010 people per square mile |
| San Jose: | 5,625 people per square mile |
Median household income in 2021:
| East Northside: | $100,384 |
| San Jose: | $126,377 |
Median rent in in 2021:
| East Northside: | $2,135 |
| San Jose: | $2,001 |
Male vs Females
| Males: | 4,314 |
| Females: | 4,298 |
Median age
| Males: | 36.1 years |
| Females: | 34.9 years |
Average estimated value of detached houses in 2021 (56.7% of all units):
| East Northside: | $864,361 |
| San Jose: | $1,403,256 |
Most popular occupations of males: construction, extraction, and maintenance occupations (16.5%); service occupations (15.0%); management occupations (except farmers) (14.6%); computer and mathematical occupations (7.9%); sales and office occupations (6.7%); material moving occupations (6.6%); business and financial operations occupations (6.3%)
Most popular occupations of females: service occupations (25.8%); management occupations (except farmers) (22.9%); sales and office occupations (21.3%); business and financial operations occupations (5.4%); community and social services occupations (4.5%); production occupations (4.2%); computer and mathematical occupations (3.9%)
Roads and streets: N 16th St; N 17th St; N 15th St; N 18th St; N 19th St; N 14th St; E Taylor St; N 20th St; N 21st St; Jackson St; E Mission St; E Empire St; Washington St; E Hedding St; Vestal St; E Julian St; Monferino Dr; N 22nd St; N 23rd St; Terrace Dr; de Mattei Ct; Marianelli Ct; N Bayshore Rd W; Glithero Ct; Houghton Ct; Calumet Ct.
Other features: Coyote Crk.
East Northside neighborhood detailed profile
East Santa Clara Street neighborhood in San Jose statistics: (Find on map)
Area: 0.202 square miles
Population: 2,365
Population density:
Median household income in 2021:
Median rent in in 2021:
Male vs Females
Median age
Average estimated value of detached houses in 2021 (34.2% of all units):
Most popular occupations of males: service occupations (15.7%); management occupations (except farmers) (14.8%); computer and mathematical occupations (12.2%); sales and office occupations (8.2%); arts, design, entertainment, sports, and media occupations (6.8%); material moving occupations (6.6%); construction, extraction, and maintenance occupations (5.3%)
Most popular occupations of females: sales and office occupations (36.4%); service occupations (25.5%); education, training, and library occupations (7.3%); arts, design, entertainment, sports, and media occupations (4.9%); community and social services occupations (4.6%); production occupations (4.5%); material moving occupations (3.3%)
Roads and streets: E Santa Clara St; E St John St; N 13th St; N 14th St; N 17th St; N 12th St; Elizabeth St; N 20th St; S 10th St; S 9th St; N 15th St.
East Santa Clara Street neighborhood detailed profile
Area: 0.202 square miles
Population: 2,365
Population density:
| East Santa Clara Street: | 11,696 people per square mile |
| San Jose: | 5,625 people per square mile |
Median household income in 2021:
| East Santa Clara Street: | $62,542 |
| San Jose: | $126,377 |
Median rent in in 2021:
| East Santa Clara Street: | $1,605 |
| San Jose: | $2,001 |
Male vs Females
| Males: | 1,277 |
| Females: | 1,088 |
Median age
| Males: | 33.0 years |
| Females: | 37.5 years |
Average estimated value of detached houses in 2021 (34.2% of all units):
| East Santa Clara Street: | $1,073,857 |
| San Jose: | $1,403,256 |
Most popular occupations of males: service occupations (15.7%); management occupations (except farmers) (14.8%); computer and mathematical occupations (12.2%); sales and office occupations (8.2%); arts, design, entertainment, sports, and media occupations (6.8%); material moving occupations (6.6%); construction, extraction, and maintenance occupations (5.3%)
Most popular occupations of females: sales and office occupations (36.4%); service occupations (25.5%); education, training, and library occupations (7.3%); arts, design, entertainment, sports, and media occupations (4.9%); community and social services occupations (4.6%); production occupations (4.5%); material moving occupations (3.3%)
Roads and streets: E Santa Clara St; E St John St; N 13th St; N 14th St; N 17th St; N 12th St; Elizabeth St; N 20th St; S 10th St; S 9th St; N 15th St.
East Santa Clara Street neighborhood detailed profile
East West Courts neighborhood in San Jose statistics: (Find on map)
Area: 0.023 square miles
Roads and streets: E Julian St.
East West Courts neighborhood detailed profile
Area: 0.023 square miles
Roads and streets: E Julian St.
East West Courts neighborhood detailed profile
Eastside neighborhood in San Jose statistics: (Find on map)
Area: 0.021 square miles
Roads and streets: Eastside Dr.
Eastside neighborhood detailed profile
Area: 0.021 square miles
Roads and streets: Eastside Dr.
Eastside neighborhood detailed profile
Eden neighborhood in San Jose statistics: (Find on map)
Area: 0.343 square miles
Population: 2,559
Population density:
Median household income in 2021:
Median rent in in 2021:
Male vs Females
Median age
Housing prices:
Average estimated value of detached houses in 2021 (59.1% of all units):
Average estimated value of townhouses or other attached units in 2021 (16.7% of all units):
Average estimated '21 value of housing units in 5-or-more-unit structures (15.8% of all units):
Most popular occupations of males: architecture and engineering occupations (20.8%); computer and mathematical occupations (17.3%); construction, extraction, and maintenance occupations (11.9%); sales and office occupations (8.3%); service occupations (7.5%); management occupations (except farmers) (6.6%); business and financial operations occupations (4.9%)
Most popular occupations of females: management occupations (except farmers) (24.4%); service occupations (23.5%); sales and office occupations (15.1%); education, training, and library occupations (14.9%); architecture and engineering occupations (7.6%); business and financial operations occupations (7.5%); computer and mathematical occupations (4.4%)
Limited-access highways (interstate or state) in this neighborhood: San Tomas Expy.
Roads and streets: Payne Ave; Walton Way; Eden Ave; Yuba Ave; Phelps Ave; Amber Dr; New St; Parkland Ave; Runnymede Dr; Acorn Way; Calboro Dr; Savannah Dr; Spaich Dr; Pearltone Dr; Woodbine Way; Valley Square Ln; Oxford Ln; Amherst Ln; Sunnyhaven Dr; Speno Dr; Polk Ln; Oriole Dr; Greentree Way; Gleneeden Way; Finch Dr; Bluebird Dr; Andrea Dr; Verdant Way; Jericho Ln; Macon Ave; Sunny Lake Ct; Sunny Gate Ct; Sunnymead Ct; Sunny Dale Ct; Chivas Pl; Acorn Ct; Canary Ln; Bon Air Ct; Andrea Ct; Ban Ct; Chivas Ct; Cardiff Ct.
Eden neighborhood detailed profile
Area: 0.343 square miles
Population: 2,559
Population density:
| Eden: | 7,455 people per square mile |
| San Jose: | 5,625 people per square mile |
Median household income in 2021:
| Eden: | $111,046 |
| San Jose: | $126,377 |
Median rent in in 2021:
| Eden: | $2,648 |
| San Jose: | $2,001 |
Male vs Females
| Males: | 1,355 |
| Females: | 1,203 |
Median age
| Males: | 39.2 years |
| Females: | 38.9 years |
Housing prices:
Average estimated value of detached houses in 2021 (59.1% of all units):
| Eden: | $2,725,187 |
| San Jose: | $1,403,256 |
Average estimated value of townhouses or other attached units in 2021 (16.7% of all units):
| This neighborhood: | $360,133 |
| city: | $892,629 |
Average estimated '21 value of housing units in 5-or-more-unit structures (15.8% of all units):
| Eden: | $370,596 |
| San Jose: | $688,625 |
Most popular occupations of males: architecture and engineering occupations (20.8%); computer and mathematical occupations (17.3%); construction, extraction, and maintenance occupations (11.9%); sales and office occupations (8.3%); service occupations (7.5%); management occupations (except farmers) (6.6%); business and financial operations occupations (4.9%)
Most popular occupations of females: management occupations (except farmers) (24.4%); service occupations (23.5%); sales and office occupations (15.1%); education, training, and library occupations (14.9%); architecture and engineering occupations (7.6%); business and financial operations occupations (7.5%); computer and mathematical occupations (4.4%)
Limited-access highways (interstate or state) in this neighborhood: San Tomas Expy.
Roads and streets: Payne Ave; Walton Way; Eden Ave; Yuba Ave; Phelps Ave; Amber Dr; New St; Parkland Ave; Runnymede Dr; Acorn Way; Calboro Dr; Savannah Dr; Spaich Dr; Pearltone Dr; Woodbine Way; Valley Square Ln; Oxford Ln; Amherst Ln; Sunnyhaven Dr; Speno Dr; Polk Ln; Oriole Dr; Greentree Way; Gleneeden Way; Finch Dr; Bluebird Dr; Andrea Dr; Verdant Way; Jericho Ln; Macon Ave; Sunny Lake Ct; Sunny Gate Ct; Sunnymead Ct; Sunny Dale Ct; Chivas Pl; Acorn Ct; Canary Ln; Bon Air Ct; Andrea Ct; Ban Ct; Chivas Ct; Cardiff Ct.
Eden neighborhood detailed profile
Edenvale neighborhood in San Jose statistics: (Find on map)
Area: 0.337 square miles
Population: 942
Population density:
Median household income in 2021:
Median rent in in 2021:
Male vs Females
Median age
Housing prices:
Average estimated value of detached houses in 2021 (43.9% of all units):
Average estimated value of mobile home in 2021 (158.7% of all units):
Most popular occupations of males: architecture and engineering occupations (17.8%); arts, design, entertainment, sports, and media occupations (14.6%); sales and office occupations (13.6%); healthcare practitioners and technical occupations (13.4%); education, training, and library occupations (8.9%); management occupations (except farmers) (6.5%); business and financial operations occupations (5.9%)
Most popular occupations of females: healthcare practitioners and technical occupations (40.7%); education, training, and library occupations (19.8%); sales and office occupations (17.5%); business and financial operations occupations (8.3%); management occupations (except farmers) (7.3%); service occupations (4.6%); computer and mathematical occupations (3.6%)
Limited-access highways (interstate or state) in this neighborhood: US Hwy 101.
Roads and streets: Azucar Ave; Whirlaway Dr; Grey Ghost Ave; Carryback Ave; Roeder Rd; Bendorf Dr; Cll Aloudra; Cll Cuervo; Roundtable Dr; Great Oaks Dr; Discovery Ave; Driveway; Cll Pintada; Pharlap Ave; Indian Broom Dr; Gallant Fox Ave; Swaps Dr; Kayak Dr; Seabiscuit Dr; Stagehand Dr; Dogaway Dr; Cll Gaviota; War Admiral Ave; Alysheba Ave; Danze Dr; New St; Cll Buho; Mitchell Ln; Roeder Ct; Armed Ct; Branham Ln E; Cll Galondrina.
Edenvale neighborhood detailed profile
Area: 0.337 square miles
Population: 942
Population density:
| Edenvale: | 2,791 people per square mile |
| San Jose: | 5,625 people per square mile |
Median household income in 2021:
| Edenvale: | $147,084 |
| San Jose: | $126,377 |
Median rent in in 2021:
| Edenvale: | $2,936 |
| San Jose: | $2,001 |
Male vs Females
| Males: | 514 |
| Females: | 427 |
Median age
| Males: | 38.3 years |
| Females: | 42.4 years |
Housing prices:
Average estimated value of detached houses in 2021 (43.9% of all units):
| Edenvale: | $894,780 |
| San Jose: | $1,403,256 |
Average estimated value of mobile home in 2021 (158.7% of all units):
| Edenvale: | $153,720 |
| San Jose: | $240,963 |
Most popular occupations of males: architecture and engineering occupations (17.8%); arts, design, entertainment, sports, and media occupations (14.6%); sales and office occupations (13.6%); healthcare practitioners and technical occupations (13.4%); education, training, and library occupations (8.9%); management occupations (except farmers) (6.5%); business and financial operations occupations (5.9%)
Most popular occupations of females: healthcare practitioners and technical occupations (40.7%); education, training, and library occupations (19.8%); sales and office occupations (17.5%); business and financial operations occupations (8.3%); management occupations (except farmers) (7.3%); service occupations (4.6%); computer and mathematical occupations (3.6%)
Limited-access highways (interstate or state) in this neighborhood: US Hwy 101.
Roads and streets: Azucar Ave; Whirlaway Dr; Grey Ghost Ave; Carryback Ave; Roeder Rd; Bendorf Dr; Cll Aloudra; Cll Cuervo; Roundtable Dr; Great Oaks Dr; Discovery Ave; Driveway; Cll Pintada; Pharlap Ave; Indian Broom Dr; Gallant Fox Ave; Swaps Dr; Kayak Dr; Seabiscuit Dr; Stagehand Dr; Dogaway Dr; Cll Gaviota; War Admiral Ave; Alysheba Ave; Danze Dr; New St; Cll Buho; Mitchell Ln; Roeder Ct; Armed Ct; Branham Ln E; Cll Galondrina.
Edenvale neighborhood detailed profile
Edge neighborhood in San Jose statistics: (Find on map)
Area: 0.125 square miles
Population: 536
Population density:
Median household income in 2021:
Median rent in in 2021:
Male vs Females
Median age
Housing prices:
Average estimated value of detached houses in 2021 (62.5% of all units):
Average estimated value of mobile home in 2021 (23.8% of all units):
Most popular occupations of males: architecture and engineering occupations (21.9%); production occupations (17.9%); sales and office occupations (11.0%); construction, extraction, and maintenance occupations (10.5%); transportation occupations (8.5%); service occupations (7.1%); farming, fishing, and forestry occupations (5.6%)
Most popular occupations of females: service occupations (35.2%); sales and office occupations (25.9%); education, training, and library occupations (11.5%); material moving occupations (7.8%); production occupations (7.2%); healthcare practitioners and technical occupations (5.8%); management occupations (except farmers) (5.6%)
Roads and streets: Quimby Rd; Brahms Ave; Tully Rd; Edgegate Dr; Edgestone Cir; Edgeview Dr; Edgebank Dr; Huran Dr; Edgecrest Dr; Edgefort Ct; Huran Ct; Edgedale Ct; Edgefield Ct; Edgeview Ct; Brahms Ct.
Edge neighborhood detailed profile
Area: 0.125 square miles
Population: 536
Population density:
| Edge: | 4,301 people per square mile |
| San Jose: | 5,625 people per square mile |
Median household income in 2021:
| Edge: | $100,862 |
| San Jose: | $126,377 |
Median rent in in 2021:
| Edge: | $2,191 |
| San Jose: | $2,001 |
Male vs Females
| Males: | 277 |
| Females: | 258 |
Median age
| Males: | 36.3 years |
| Females: | 48.5 years |
Housing prices:
Average estimated value of detached houses in 2021 (62.5% of all units):
| Edge: | $736,653 |
| San Jose: | $1,403,256 |
Average estimated value of mobile home in 2021 (23.8% of all units):
| Edge: | $223,137 |
| San Jose: | $240,963 |
Most popular occupations of males: architecture and engineering occupations (21.9%); production occupations (17.9%); sales and office occupations (11.0%); construction, extraction, and maintenance occupations (10.5%); transportation occupations (8.5%); service occupations (7.1%); farming, fishing, and forestry occupations (5.6%)
Most popular occupations of females: service occupations (35.2%); sales and office occupations (25.9%); education, training, and library occupations (11.5%); material moving occupations (7.8%); production occupations (7.2%); healthcare practitioners and technical occupations (5.8%); management occupations (except farmers) (5.6%)
Roads and streets: Quimby Rd; Brahms Ave; Tully Rd; Edgegate Dr; Edgestone Cir; Edgeview Dr; Edgebank Dr; Huran Dr; Edgecrest Dr; Edgefort Ct; Huran Ct; Edgedale Ct; Edgefield Ct; Edgeview Ct; Brahms Ct.
Edge neighborhood detailed profile
El Rancho Verde neighborhood in San Jose statistics: (Find on map)
Area: 0.080 square miles
Population: 812
Population density:
Median household income in 2021:
Median rent in in 2021:
Male vs Females
Median age
Housing prices:
Average estimated value of detached houses in 2021 (22.0% of all units):
Average estimated value of townhouses or other attached units in 2021 (16.6% of all units):
Average estimated '21 value of housing units in 5-or-more-unit structures (15.4% of all units):
Most popular occupations of males: service occupations (36.2%); transportation occupations (20.2%); construction, extraction, and maintenance occupations (14.1%); material moving occupations (10.3%); sales and office occupations (9.5%); production occupations (8.0%)
Most popular occupations of females: service occupations (56.0%); healthcare practitioners and technical occupations (19.1%); material moving occupations (7.0%); business and financial operations occupations (6.1%); sales and office occupations (6.1%); management occupations (except farmers) (3.9%)
Roads and streets: Checkers Dr; Educational Park Dr; Schulte Dr; McKee Rd; Ryegate Ct; Linkhorne Ct.
El Rancho Verde neighborhood detailed profile
Area: 0.080 square miles
Population: 812
Population density:
| El Rancho Verde: | 10,143 people per square mile |
| San Jose: | 5,625 people per square mile |
Median household income in 2021:
| El Rancho Verde: | $72,605 |
| San Jose: | $126,377 |
Median rent in in 2021:
| El Rancho Verde: | $685 |
| San Jose: | $2,001 |
Male vs Females
| Males: | 332 |
| Females: | 479 |
Median age
| Males: | 36.8 years |
| Females: | 39.7 years |
Housing prices:
Average estimated value of detached houses in 2021 (22.0% of all units):
| El Rancho Verde: | $1,030,058 |
| San Jose: | $1,403,256 |
Average estimated value of townhouses or other attached units in 2021 (16.6% of all units):
| This neighborhood: | $632,355 |
| city: | $892,629 |
Average estimated '21 value of housing units in 5-or-more-unit structures (15.4% of all units):
| El Rancho Verde: | $581,252 |
| San Jose: | $688,625 |
Most popular occupations of males: service occupations (36.2%); transportation occupations (20.2%); construction, extraction, and maintenance occupations (14.1%); material moving occupations (10.3%); sales and office occupations (9.5%); production occupations (8.0%)
Most popular occupations of females: service occupations (56.0%); healthcare practitioners and technical occupations (19.1%); material moving occupations (7.0%); business and financial operations occupations (6.1%); sales and office occupations (6.1%); management occupations (except farmers) (3.9%)
Roads and streets: Checkers Dr; Educational Park Dr; Schulte Dr; McKee Rd; Ryegate Ct; Linkhorne Ct.
El Rancho Verde neighborhood detailed profile
Erikson neighborhood in San Jose statistics: (Find on map)
Area: 0.292 square miles
Population: 1,375
Population density:
Median household income in 2021:
Median rent in in 2021:
Male vs Females
Median age
Housing prices:
Average estimated value of detached houses in 2021 (47.5% of all units):
Average estimated value of townhouses or other attached units in 2021 (41.3% of all units):
Most popular occupations of males: management occupations (except farmers) (25.9%); service occupations (16.1%); computer and mathematical occupations (13.5%); architecture and engineering occupations (11.9%); construction, extraction, and maintenance occupations (7.7%); arts, design, entertainment, sports, and media occupations (3.8%); healthcare practitioners and technical occupations (3.8%)
Most popular occupations of females: sales and office occupations (30.4%); service occupations (12.4%); education, training, and library occupations (11.0%); business and financial operations occupations (10.9%); management occupations (except farmers) (8.9%); life, physical, and social science occupations (8.1%); arts, design, entertainment, sports, and media occupations (5.4%)
Limited-access highways (interstate or state) in this neighborhood: Guadalupe Fwy (State Hwy 87).
Roads and streets: Pearl Ave; Minas Dr; Tonino Dr; Fell Ave; Corrales Dr; Chynoweth Ave; Oyster Bay Dr; Rawlings Dr; Terner Way; Cll de Verde; Sapphire Ct; Quicksilver Dr; Corte de Avellano; Moonstone Ct; Dawnview Ct; Eagle Lake Dr; Corte de Cervato; Larissa Ct; Zircon Ct; Corte de Blanco; Fell Ct; Corte de Plata; Bickley Ct; Amethyst Ct; W Fork Ct; Winfield Blvd.
Erikson neighborhood detailed profile
Area: 0.292 square miles
Population: 1,375
Population density:
| Erikson: | 4,709 people per square mile |
| San Jose: | 5,625 people per square mile |
Median household income in 2021:
| Erikson: | $153,556 |
| San Jose: | $126,377 |
Median rent in in 2021:
| Erikson: | $2,618 |
| San Jose: | $2,001 |
Male vs Females
| Males: | 649 |
| Females: | 726 |
Median age
| Males: | 42.4 years |
| Females: | 46.2 years |
Housing prices:
Average estimated value of detached houses in 2021 (47.5% of all units):
| Erikson: | $1,174,403 |
| San Jose: | $1,403,256 |
Average estimated value of townhouses or other attached units in 2021 (41.3% of all units):
| This neighborhood: | $993,590 |
| city: | $892,629 |
Most popular occupations of males: management occupations (except farmers) (25.9%); service occupations (16.1%); computer and mathematical occupations (13.5%); architecture and engineering occupations (11.9%); construction, extraction, and maintenance occupations (7.7%); arts, design, entertainment, sports, and media occupations (3.8%); healthcare practitioners and technical occupations (3.8%)
Most popular occupations of females: sales and office occupations (30.4%); service occupations (12.4%); education, training, and library occupations (11.0%); business and financial operations occupations (10.9%); management occupations (except farmers) (8.9%); life, physical, and social science occupations (8.1%); arts, design, entertainment, sports, and media occupations (5.4%)
Limited-access highways (interstate or state) in this neighborhood: Guadalupe Fwy (State Hwy 87).
Roads and streets: Pearl Ave; Minas Dr; Tonino Dr; Fell Ave; Corrales Dr; Chynoweth Ave; Oyster Bay Dr; Rawlings Dr; Terner Way; Cll de Verde; Sapphire Ct; Quicksilver Dr; Corte de Avellano; Moonstone Ct; Dawnview Ct; Eagle Lake Dr; Corte de Cervato; Larissa Ct; Zircon Ct; Corte de Blanco; Fell Ct; Corte de Plata; Bickley Ct; Amethyst Ct; W Fork Ct; Winfield Blvd.
Erikson neighborhood detailed profile
Estates neighborhood in San Jose statistics: (Find on map)
Area: 0.410 square miles
Population: 2,659
Population density:
Median household income in 2021:
Median rent in in 2021:
Male vs Females
Median age
Average estimated value of detached houses in 2021 (63.5% of all units):
Most popular occupations of males: sales and office occupations (18.3%); management occupations (except farmers) (16.4%); material moving occupations (14.2%); arts, design, entertainment, sports, and media occupations (12.9%); architecture and engineering occupations (12.6%); healthcare practitioners and technical occupations (12.3%); construction, extraction, and maintenance occupations (8.6%)
Most popular occupations of females: education, training, and library occupations (24.8%); production occupations (22.1%); management occupations (except farmers) (19.2%); business and financial operations occupations (18.4%); architecture and engineering occupations (17.4%); material moving occupations (14.8%); sales and office occupations (14.5%)
Roads and streets: Silver Ests; Park Estates Way; San Felipe Rd; Harvest Ests; Knights Ests; Sunny Creek Dr; King Ests; Shadow Ests; Willow Ests; Sunny Orchard Ln; Sunny Meadow Ln; Creek Ests; Hounds Ests; Autumn Ests; Ashley Way; Queens Estates Ct; Lyon Estates Ct; Hounds Estates Ct; Creek Estates Ct; Thorncreek Ct; King Estates Ct; Old Estates Ct; Royal Estates Ct; Brook Estates Ct; Lake Estates Ct; The Villages Pkwy; Andare Ct; Prince Estates Ct; Ashley Ct; Oak Estates Ct; Trovata Ct; Ivy Estates Ct; Jasper Hill Way; Silverwood Creek Ct; Silvercrest Ridge Ct.
Other features: Yerba Buena Crk.
Estates neighborhood detailed profile
Area: 0.410 square miles
Population: 2,659
Population density:
| Estates: | 6,479 people per square mile |
| San Jose: | 5,625 people per square mile |
Median household income in 2021:
| Estates: | $101,635 |
| San Jose: | $126,377 |
Median rent in in 2021:
| Estates: | $3,038 |
| San Jose: | $2,001 |
Male vs Females
| Males: | 1,333 |
| Females: | 1,326 |
Median age
| Males: | 34.5 years |
| Females: | 52.0 years |
Average estimated value of detached houses in 2021 (63.5% of all units):
| Estates: | $1,038,438 |
| San Jose: | $1,403,256 |
Most popular occupations of males: sales and office occupations (18.3%); management occupations (except farmers) (16.4%); material moving occupations (14.2%); arts, design, entertainment, sports, and media occupations (12.9%); architecture and engineering occupations (12.6%); healthcare practitioners and technical occupations (12.3%); construction, extraction, and maintenance occupations (8.6%)
Most popular occupations of females: education, training, and library occupations (24.8%); production occupations (22.1%); management occupations (except farmers) (19.2%); business and financial operations occupations (18.4%); architecture and engineering occupations (17.4%); material moving occupations (14.8%); sales and office occupations (14.5%)
Roads and streets: Silver Ests; Park Estates Way; San Felipe Rd; Harvest Ests; Knights Ests; Sunny Creek Dr; King Ests; Shadow Ests; Willow Ests; Sunny Orchard Ln; Sunny Meadow Ln; Creek Ests; Hounds Ests; Autumn Ests; Ashley Way; Queens Estates Ct; Lyon Estates Ct; Hounds Estates Ct; Creek Estates Ct; Thorncreek Ct; King Estates Ct; Old Estates Ct; Royal Estates Ct; Brook Estates Ct; Lake Estates Ct; The Villages Pkwy; Andare Ct; Prince Estates Ct; Ashley Ct; Oak Estates Ct; Trovata Ct; Ivy Estates Ct; Jasper Hill Way; Silverwood Creek Ct; Silvercrest Ridge Ct.
Other features: Yerba Buena Crk.
Estates neighborhood detailed profile
Evans neighborhood in San Jose statistics: (Find on map)
Area: 0.076 square miles
Evans neighborhood detailed profile
Area: 0.076 square miles
Evans neighborhood detailed profile
Everdale neighborhood in San Jose statistics: (Find on map)
Area: 0.287 square miles
Population: 3,607
Population density:
Median household income in 2021:
Median rent in in 2021:
Male vs Females
Median age
Housing prices:
Average estimated value of detached houses in 2021 (22.6% of all units):
Average estimated value of townhouses or other attached units in 2021 (8.6% of all units):
Average estimated value of mobile home in 2021 (19.2% of all units):
Most popular occupations of males: service occupations (23.7%); management occupations (except farmers) (14.1%); sales and office occupations (13.7%); computer and mathematical occupations (8.2%); production occupations (6.8%); material moving occupations (6.2%); architecture and engineering occupations (5.1%)
Most popular occupations of females: sales and office occupations (33.9%); service occupations (21.7%); management occupations (except farmers) (12.6%); community and social services occupations (5.3%); business and financial operations occupations (4.9%); healthcare practitioners and technical occupations (4.9%); transportation occupations (4.5%)
Roads and streets: Whispering Hills Cir; Pettigrew Dr; Everdale Dr; Nieman Blvd; Pentland Way; Meyer Cir; Renfield Way; Fenwick Way; Plumstead Way; Whispering Hills Loop; Whispering Hills Ln; Cll de Las Estrella; Whispering Hills Dr; Cll de Las Flores; Pumpherston Way; Whispering Hills Rd; Seafield Ct; Balgray Ct; Ludlow Ct; Whispering Hills Way; Monkton Ct; Ralston Dr; Bagworth Ct; Pumpherston Ct; Pentland Ct; Serpa Dr; Armdale Ct; Plumstead Ct; Pettigrew Ct; Linburn Ct; Ralston Ct; Medwin Ct; Ancrum Ct.
Other features: Thompson Crk.
Everdale neighborhood detailed profile
Area: 0.287 square miles
Population: 3,607
Population density:
| Everdale (Neimen): | 12,565 people per square mile |
| San Jose: | 5,625 people per square mile |
Median household income in 2021:
| Everdale (Neimen): | $139,309 |
| San Jose: | $126,377 |
Median rent in in 2021:
| Everdale (Neimen): | $2,692 |
| San Jose: | $2,001 |
Male vs Females
| Males: | 1,754 |
| Females: | 1,853 |
Median age
| Males: | 35.0 years |
| Females: | 38.5 years |
Housing prices:
Average estimated value of detached houses in 2021 (22.6% of all units):
| Everdale (Neimen): | $1,543,499 |
| San Jose: | $1,403,256 |
Average estimated value of townhouses or other attached units in 2021 (8.6% of all units):
| This neighborhood: | $668,367 |
| city: | $892,629 |
Average estimated value of mobile home in 2021 (19.2% of all units):
| Everdale (Neimen): | $198,700 |
| San Jose: | $240,963 |
Most popular occupations of males: service occupations (23.7%); management occupations (except farmers) (14.1%); sales and office occupations (13.7%); computer and mathematical occupations (8.2%); production occupations (6.8%); material moving occupations (6.2%); architecture and engineering occupations (5.1%)
Most popular occupations of females: sales and office occupations (33.9%); service occupations (21.7%); management occupations (except farmers) (12.6%); community and social services occupations (5.3%); business and financial operations occupations (4.9%); healthcare practitioners and technical occupations (4.9%); transportation occupations (4.5%)
Roads and streets: Whispering Hills Cir; Pettigrew Dr; Everdale Dr; Nieman Blvd; Pentland Way; Meyer Cir; Renfield Way; Fenwick Way; Plumstead Way; Whispering Hills Loop; Whispering Hills Ln; Cll de Las Estrella; Whispering Hills Dr; Cll de Las Flores; Pumpherston Way; Whispering Hills Rd; Seafield Ct; Balgray Ct; Ludlow Ct; Whispering Hills Way; Monkton Ct; Ralston Dr; Bagworth Ct; Pumpherston Ct; Pentland Ct; Serpa Dr; Armdale Ct; Plumstead Ct; Pettigrew Ct; Linburn Ct; Ralston Ct; Medwin Ct; Ancrum Ct.
Other features: Thompson Crk.
Everdale neighborhood detailed profile
Evergreen Hidden Glen neighborhood in San Jose statistics: (Find on map)
Area: 0.399 square miles
Population: 2,868
Population density:
Median household income in 2021:
Median rent in in 2021:
Male vs Females
Median age
Housing prices:
Average estimated value of detached houses in 2021 (97.2% of all units):
Average estimated value of mobile home in 2021 (6.6% of all units):
Most popular occupations of males: sales and office occupations (28.1%); service occupations (13.2%); production occupations (8.7%); management occupations (except farmers) (8.3%); computer and mathematical occupations (8.3%); architecture and engineering occupations (5.9%); education, training, and library occupations (5.2%)
Most popular occupations of females: sales and office occupations (30.7%); service occupations (18.9%); production occupations (10.6%); education, training, and library occupations (8.4%); healthcare practitioners and technical occupations (8.1%); business and financial operations occupations (7.1%); management occupations (except farmers) (6.0%)
Roads and streets: S White Rd; Britt Way; Glen Donegal Dr; Glen Dundee Way; Glen Hanleigh Dr; Glen Ferguson Cir; Scottsdale Dr; Glen Haig Way; Glen Duff Way; Glen Alma Way; Glen Loman Way; Glen Alden Ct; Glen Sharon Way; Tagart Dr; Caraston Way; Glen Fenton Way; Glen Exeter Way; Glen Como Way; Glen Hardy Ct; Glen Ascot Way; Mission Greens Dr; Ramsdell Pl; Hesselbein Way; Glen Hawkins Ct; Glen Doon Ct; Vineyard Park Dr; Glen Frost Ct; Glen Angus Way; Keppler Dr; Glen Craig Ct; Glen Evans Ct; Glen Amador Ct; Glen Decker Ct; Glen Darby Ct; Glen Crow Ct; Glen Hastings Ct; Glen Fox Ct; Britt Ct; Glen Hancock Ct; Glen Cotswold Ct; Glen Elm Way; Glen Dixon Ct; Glen Keats Ct; Hummel Ct; Glen Harwick Ct; Sand Point Dr; Glen Farm Ct; Quest Ln; Gilham Way; Glen Kew Ct; Glen Elk Ct; Glen Keller Ct; Vineyard Park Ct; Mission Hill Pl; Glen Dundee Ct; Glen Ian Ct; Sedlak Ct.
Other features: Silver Crk.
Evergreen Hidden Glen neighborhood detailed profile
Area: 0.399 square miles
Population: 2,868
Population density:
| Evergreen Hidden Glen (Evergreen-Hidden Glen): | 7,188 people per square mile |
| San Jose: | 5,625 people per square mile |
Median household income in 2021:
| Evergreen Hidden Glen (Evergreen-Hidden Glen): | $145,139 |
| San Jose: | $126,377 |
Median rent in in 2021:
| Evergreen Hidden Glen (Evergreen-Hidden Glen): | $3,449 |
| San Jose: | $2,001 |
Male vs Females
| Males: | 1,498 |
| Females: | 1,369 |
Median age
| Males: | 37.7 years |
| Females: | 43.0 years |
Housing prices:
Average estimated value of detached houses in 2021 (97.2% of all units):
| Evergreen Hidden Glen (Evergreen-Hidden Glen): | $1,140,057 |
| San Jose: | $1,403,256 |
Average estimated value of mobile home in 2021 (6.6% of all units):
| Evergreen Hidden Glen (Evergreen-Hidden Glen): | $198,700 |
| San Jose: | $240,963 |
Most popular occupations of males: sales and office occupations (28.1%); service occupations (13.2%); production occupations (8.7%); management occupations (except farmers) (8.3%); computer and mathematical occupations (8.3%); architecture and engineering occupations (5.9%); education, training, and library occupations (5.2%)
Most popular occupations of females: sales and office occupations (30.7%); service occupations (18.9%); production occupations (10.6%); education, training, and library occupations (8.4%); healthcare practitioners and technical occupations (8.1%); business and financial operations occupations (7.1%); management occupations (except farmers) (6.0%)
Roads and streets: S White Rd; Britt Way; Glen Donegal Dr; Glen Dundee Way; Glen Hanleigh Dr; Glen Ferguson Cir; Scottsdale Dr; Glen Haig Way; Glen Duff Way; Glen Alma Way; Glen Loman Way; Glen Alden Ct; Glen Sharon Way; Tagart Dr; Caraston Way; Glen Fenton Way; Glen Exeter Way; Glen Como Way; Glen Hardy Ct; Glen Ascot Way; Mission Greens Dr; Ramsdell Pl; Hesselbein Way; Glen Hawkins Ct; Glen Doon Ct; Vineyard Park Dr; Glen Frost Ct; Glen Angus Way; Keppler Dr; Glen Craig Ct; Glen Evans Ct; Glen Amador Ct; Glen Decker Ct; Glen Darby Ct; Glen Crow Ct; Glen Hastings Ct; Glen Fox Ct; Britt Ct; Glen Hancock Ct; Glen Cotswold Ct; Glen Elm Way; Glen Dixon Ct; Glen Keats Ct; Hummel Ct; Glen Harwick Ct; Sand Point Dr; Glen Farm Ct; Quest Ln; Gilham Way; Glen Kew Ct; Glen Elk Ct; Glen Keller Ct; Vineyard Park Ct; Mission Hill Pl; Glen Dundee Ct; Glen Ian Ct; Sedlak Ct.
Other features: Silver Crk.
Evergreen Hidden Glen neighborhood detailed profile
Farm Drive neighborhood in San Jose statistics: (Find on map)
Area: 0.025 square miles
Roads and streets: Farm Dr; Dakan Ct; Pearl Ave.
Farm Drive neighborhood detailed profile
Area: 0.025 square miles
Roads and streets: Farm Dr; Dakan Ct; Pearl Ave.
Farm Drive neighborhood detailed profile
Farnam neighborhood in San Jose statistics: (Find on map)
Area: 0.165 square miles
Population: 1,464
Population density:
Median household income in 2021:
Median rent in in 2021:
Male vs Females
Median age
Most popular occupations of males: sales and office occupations (34.0%); computer and mathematical occupations (12.7%); management occupations (except farmers) (9.1%); service occupations (8.8%); construction, extraction, and maintenance occupations (6.3%); architecture and engineering occupations (4.1%); material moving occupations (4.1%)
Most popular occupations of females: healthcare practitioners and technical occupations (31.1%); management occupations (except farmers) (17.0%); service occupations (14.8%); sales and office occupations (9.6%); production occupations (9.2%); business and financial operations occupations (7.2%); computer and mathematical occupations (5.9%)
Roads and streets: Sunrise Dr; Stratford Dr; Starbright Dr; May Ln; Woodard Rd; Calico Ave; Camden Ave; Mount Davidson Dr; Nova Scotia Ave; Starview Dr; Shelley Ave; Twilight Dr; Wine Grower Way; Wine Cask Way; Calvin Ave; McCoppin Park Ct; Lapridge Ln; Wine Cork Way; Wine Barrel Way; Wine Maker Way; Ida Way; Mount Davidson Ct; Calvelli Ct.
Farnam neighborhood detailed profile
Area: 0.165 square miles
Population: 1,464
Population density:
| Farnam: | 8,871 people per square mile |
| San Jose: | 5,625 people per square mile |
Median household income in 2021:
| Farnam: | $130,625 |
| San Jose: | $126,377 |
Median rent in in 2021:
| Farnam: | $2,332 |
| San Jose: | $2,001 |
Male vs Females
| Males: | 797 |
| Females: | 666 |
Median age
| Males: | 36.7 years |
| Females: | 35.6 years |
Most popular occupations of males: sales and office occupations (34.0%); computer and mathematical occupations (12.7%); management occupations (except farmers) (9.1%); service occupations (8.8%); construction, extraction, and maintenance occupations (6.3%); architecture and engineering occupations (4.1%); material moving occupations (4.1%)
Most popular occupations of females: healthcare practitioners and technical occupations (31.1%); management occupations (except farmers) (17.0%); service occupations (14.8%); sales and office occupations (9.6%); production occupations (9.2%); business and financial operations occupations (7.2%); computer and mathematical occupations (5.9%)
Roads and streets: Sunrise Dr; Stratford Dr; Starbright Dr; May Ln; Woodard Rd; Calico Ave; Camden Ave; Mount Davidson Dr; Nova Scotia Ave; Starview Dr; Shelley Ave; Twilight Dr; Wine Grower Way; Wine Cask Way; Calvin Ave; McCoppin Park Ct; Lapridge Ln; Wine Cork Way; Wine Barrel Way; Wine Maker Way; Ida Way; Mount Davidson Ct; Calvelli Ct.
Farnam neighborhood detailed profile
Fenton neighborhood in San Jose statistics: (Find on map)
Area: 0.137 square miles
Population: 1,054
Population density:
Median household income in 2021:
Median rent in in 2021:
Male vs Females
Median age
Housing prices:
Average estimated value of detached houses in 2021 (53.8% of all units):
Average estimated value of townhouses or other attached units in 2021 (8.4% of all units):
Most popular occupations of males: construction, extraction, and maintenance occupations (28.1%); management occupations (except farmers) (12.7%); material moving occupations (11.9%); sales and office occupations (7.9%); production occupations (7.0%); transportation occupations (5.9%); computer and mathematical occupations (5.7%)
Most popular occupations of females: service occupations (54.1%); healthcare practitioners and technical occupations (12.9%); sales and office occupations (11.1%); management occupations (except farmers) (8.8%); arts, design, entertainment, sports, and media occupations (8.2%); life, physical, and social science occupations (4.6%)
Roads and streets: Fenton St; Novak Dr; Youngs Cir; Richardson Dr; la Pala Dr; Mc Collam Dr; Gawain Dr; Gridley Ct; Mc Kee Rd; Genine Dr; Waterman Ct; Lucian Ave; Toyon Ave; Evco Ct; Gridley St; Youngs Ct; Stonemag Way; Faith Ct; la Pala Ct; Perkins Ct; Genine Ct; la Palla Pl.
Fenton neighborhood detailed profile
Area: 0.137 square miles
Population: 1,054
Population density:
| Fenton (McCollam): | 7,701 people per square mile |
| San Jose: | 5,625 people per square mile |
Median household income in 2021:
| Fenton (McCollam): | $119,605 |
| San Jose: | $126,377 |
Median rent in in 2021:
| Fenton (McCollam): | $2,072 |
| San Jose: | $2,001 |
Male vs Females
| Males: | 528 |
| Females: | 526 |
Median age
| Males: | 35.2 years |
| Females: | 41.0 years |
Housing prices:
Average estimated value of detached houses in 2021 (53.8% of all units):
| Fenton (McCollam): | $751,662 |
| San Jose: | $1,403,256 |
Average estimated value of townhouses or other attached units in 2021 (8.4% of all units):
| This neighborhood: | $434,160 |
| city: | $892,629 |
Most popular occupations of males: construction, extraction, and maintenance occupations (28.1%); management occupations (except farmers) (12.7%); material moving occupations (11.9%); sales and office occupations (7.9%); production occupations (7.0%); transportation occupations (5.9%); computer and mathematical occupations (5.7%)
Most popular occupations of females: service occupations (54.1%); healthcare practitioners and technical occupations (12.9%); sales and office occupations (11.1%); management occupations (except farmers) (8.8%); arts, design, entertainment, sports, and media occupations (8.2%); life, physical, and social science occupations (4.6%)
Roads and streets: Fenton St; Novak Dr; Youngs Cir; Richardson Dr; la Pala Dr; Mc Collam Dr; Gawain Dr; Gridley Ct; Mc Kee Rd; Genine Dr; Waterman Ct; Lucian Ave; Toyon Ave; Evco Ct; Gridley St; Youngs Ct; Stonemag Way; Faith Ct; la Pala Ct; Perkins Ct; Genine Ct; la Palla Pl.
Fenton neighborhood detailed profile
Ferrari neighborhood in San Jose statistics: (Find on map)
Area: 0.071 square miles
Population: 807
Population density:
Median household income in 2021:
Median rent in in 2021:
Male vs Females
Median age
Most popular occupations of males: service occupations (28.1%); construction, extraction, and maintenance occupations (23.4%); sales and office occupations (12.7%); production occupations (8.3%); management occupations (except farmers) (5.0%); business and financial operations occupations (5.0%); material moving occupations (3.2%)
Most popular occupations of females: service occupations (32.3%); sales and office occupations (30.2%); production occupations (12.6%); material moving occupations (5.4%); healthcare practitioners and technical occupations (4.5%); arts, design, entertainment, sports, and media occupations (4.3%); business and financial operations occupations (3.7%)
Roads and streets: Sunbeam Cir; Story Rd; Via Ferrari; Sunshade Ln; Sunshine Ct; Panoche Ave; Panoche Ct.
Ferrari neighborhood detailed profile
Area: 0.071 square miles
Population: 807
Population density:
| Ferrari (Pinoche): | 11,357 people per square mile |
| San Jose: | 5,625 people per square mile |
Median household income in 2021:
| Ferrari (Pinoche): | $73,650 |
| San Jose: | $126,377 |
Median rent in in 2021:
| Ferrari (Pinoche): | $1,484 |
| San Jose: | $2,001 |
Male vs Females
| Males: | 418 |
| Females: | 389 |
Median age
| Males: | 35.3 years |
| Females: | 30.2 years |
Most popular occupations of males: service occupations (28.1%); construction, extraction, and maintenance occupations (23.4%); sales and office occupations (12.7%); production occupations (8.3%); management occupations (except farmers) (5.0%); business and financial operations occupations (5.0%); material moving occupations (3.2%)
Most popular occupations of females: service occupations (32.3%); sales and office occupations (30.2%); production occupations (12.6%); material moving occupations (5.4%); healthcare practitioners and technical occupations (4.5%); arts, design, entertainment, sports, and media occupations (4.3%); business and financial operations occupations (3.7%)
Roads and streets: Sunbeam Cir; Story Rd; Via Ferrari; Sunshade Ln; Sunshine Ct; Panoche Ave; Panoche Ct.
Ferrari neighborhood detailed profile
Five Wounds neighborhood in San Jose statistics: (Find on map)
Area: 0.114 square miles
Population: 1,521
Population density:
Median household income in 2021:
Median rent in in 2021:
Male vs Females
Median age
Most popular occupations of males: construction, extraction, and maintenance occupations (14.6%); service occupations (14.3%); sales and office occupations (12.5%); business and financial operations occupations (11.8%); production occupations (11.8%); arts, design, entertainment, sports, and media occupations (9.4%); transportation occupations (7.2%)
Most popular occupations of females: sales and office occupations (41.6%); service occupations (25.3%); management occupations (except farmers) (14.5%); healthcare practitioners and technical occupations (4.2%); material moving occupations (3.6%); education, training, and library occupations (3.5%); production occupations (3.4%)
Limited-access highways (interstate or state) in this neighborhood: US Hwy 101.
Roads and streets: E Santa Clara St; Whitton Ave; E San Fernando St; Shortridge Ave; S 26th St; S 28th St; S 30th St; N 28th St.
Railroad features: Union Pacific RR.
Five Wounds neighborhood detailed profile
Area: 0.114 square miles
Population: 1,521
Population density:
| Five Wounds: | 13,319 people per square mile |
| San Jose: | 5,625 people per square mile |
Median household income in 2021:
| Five Wounds: | $86,569 |
| San Jose: | $126,377 |
Median rent in in 2021:
| Five Wounds: | $1,771 |
| San Jose: | $2,001 |
Male vs Females
| Males: | 778 |
| Females: | 742 |
Median age
| Males: | 33.2 years |
| Females: | 32.7 years |
Most popular occupations of males: construction, extraction, and maintenance occupations (14.6%); service occupations (14.3%); sales and office occupations (12.5%); business and financial operations occupations (11.8%); production occupations (11.8%); arts, design, entertainment, sports, and media occupations (9.4%); transportation occupations (7.2%)
Most popular occupations of females: sales and office occupations (41.6%); service occupations (25.3%); management occupations (except farmers) (14.5%); healthcare practitioners and technical occupations (4.2%); material moving occupations (3.6%); education, training, and library occupations (3.5%); production occupations (3.4%)
Limited-access highways (interstate or state) in this neighborhood: US Hwy 101.
Roads and streets: E Santa Clara St; Whitton Ave; E San Fernando St; Shortridge Ave; S 26th St; S 28th St; S 30th St; N 28th St.
Railroad features: Union Pacific RR.
Five Wounds neighborhood detailed profile
Flickinger North neighborhood in San Jose statistics: (Find on map)
Area: 0.182 square miles
Population: 1,890
Population density:
Median household income in 2021:
Median rent in in 2021:
Male vs Females
Median age
Most popular occupations of males: computer and mathematical occupations (23.7%); management occupations (except farmers) (14.5%); sales and office occupations (11.8%); architecture and engineering occupations (10.3%); service occupations (7.5%); business and financial operations occupations (6.9%); construction, extraction, and maintenance occupations (6.5%)
Most popular occupations of females: sales and office occupations (27.9%); architecture and engineering occupations (13.6%); computer and mathematical occupations (13.1%); service occupations (11.2%); production occupations (10.9%); healthcare practitioners and technical occupations (8.0%); business and financial operations occupations (4.8%)
Roads and streets: Four Oaks Rd; Four Oaks Cir; Timber Creek Dr; Zoria Cir; Emerald Hills Cir; Shumaker Way; Doxey Dr; Clampett Way; Fujiko Dr; Doxey Ct; Hounslow Dr; Stratton Pl; Tourney Dr; Myrick Ct; Coraltree Pl; Saugus Ct; Woodranch Rd; Fujiko Way; Woodranch Ct; Perrin Ct; Oneco Ct; Toano Ct; Zuni Ct; Renfrew Ct; Ladymuir Ct.
Flickinger North neighborhood detailed profile
Area: 0.182 square miles
Population: 1,890
Population density:
| Flickinger North: | 10,386 people per square mile |
| San Jose: | 5,625 people per square mile |
Median household income in 2021:
| Flickinger North: | $154,624 |
| San Jose: | $126,377 |
Median rent in in 2021:
| Flickinger North: | $2,899 |
| San Jose: | $2,001 |
Male vs Females
| Males: | 1,036 |
| Females: | 854 |
Median age
| Males: | 33.1 years |
| Females: | 40.6 years |
Most popular occupations of males: computer and mathematical occupations (23.7%); management occupations (except farmers) (14.5%); sales and office occupations (11.8%); architecture and engineering occupations (10.3%); service occupations (7.5%); business and financial operations occupations (6.9%); construction, extraction, and maintenance occupations (6.5%)
Most popular occupations of females: sales and office occupations (27.9%); architecture and engineering occupations (13.6%); computer and mathematical occupations (13.1%); service occupations (11.2%); production occupations (10.9%); healthcare practitioners and technical occupations (8.0%); business and financial operations occupations (4.8%)
Roads and streets: Four Oaks Rd; Four Oaks Cir; Timber Creek Dr; Zoria Cir; Emerald Hills Cir; Shumaker Way; Doxey Dr; Clampett Way; Fujiko Dr; Doxey Ct; Hounslow Dr; Stratton Pl; Tourney Dr; Myrick Ct; Coraltree Pl; Saugus Ct; Woodranch Rd; Fujiko Way; Woodranch Ct; Perrin Ct; Oneco Ct; Toano Ct; Zuni Ct; Renfrew Ct; Ladymuir Ct.
Flickinger North neighborhood detailed profile
Flickinger South neighborhood in San Jose statistics: (Find on map)
Area: 0.203 square miles
Population: 3,441
Population density:
Median household income in 2021:
Median rent in in 2021:
Male vs Females
Median age
Housing prices:
Average estimated value of detached houses in 2021 (65.6% of all units):
Average estimated value of townhouses or other attached units in 2021 (23.6% of all units):
Most popular occupations of males: service occupations (17.2%); computer and mathematical occupations (14.8%); sales and office occupations (11.3%); management occupations (except farmers) (9.9%); architecture and engineering occupations (9.5%); healthcare practitioners and technical occupations (6.6%); business and financial operations occupations (5.9%)
Most popular occupations of females: sales and office occupations (26.1%); service occupations (17.0%); production occupations (13.0%); management occupations (except farmers) (11.5%); computer and mathematical occupations (10.4%); education, training, and library occupations (7.1%); healthcare practitioners and technical occupations (4.9%)
Limited-access highways (interstate or state) in this neighborhood: I- 680 (Sinclair Fwy).
Roads and streets: Tofts Dr; Charger Dr; Hikido Dr; Tourney Dr; Turrett Dr; Aberford Dr; Berryessa Rd; Pembroke Dr; Sierra Rd; Mich Bluff Dr; Ramish Dr; Jonesport Ave; Chertsey Ct; Best Ct; Cardona Way; Oakbluff Ct; Jonesport Ct; Belthorn Ct; Wigan Ct; Talesfore Ct; Woodranch Rd.
Flickinger South neighborhood detailed profile
Area: 0.203 square miles
Population: 3,441
Population density:
| Flickinger South: | 16,916 people per square mile |
| San Jose: | 5,625 people per square mile |
Median household income in 2021:
| Flickinger South: | $156,453 |
| San Jose: | $126,377 |
Median rent in in 2021:
| Flickinger South: | $2,481 |
| San Jose: | $2,001 |
Male vs Females
| Males: | 1,770 |
| Females: | 1,670 |
Median age
| Males: | 34.9 years |
| Females: | 41.9 years |
Housing prices:
Average estimated value of detached houses in 2021 (65.6% of all units):
| Flickinger South: | $961,546 |
| San Jose: | $1,403,256 |
Average estimated value of townhouses or other attached units in 2021 (23.6% of all units):
| This neighborhood: | $620,795 |
| city: | $892,629 |
Most popular occupations of males: service occupations (17.2%); computer and mathematical occupations (14.8%); sales and office occupations (11.3%); management occupations (except farmers) (9.9%); architecture and engineering occupations (9.5%); healthcare practitioners and technical occupations (6.6%); business and financial operations occupations (5.9%)
Most popular occupations of females: sales and office occupations (26.1%); service occupations (17.0%); production occupations (13.0%); management occupations (except farmers) (11.5%); computer and mathematical occupations (10.4%); education, training, and library occupations (7.1%); healthcare practitioners and technical occupations (4.9%)
Limited-access highways (interstate or state) in this neighborhood: I- 680 (Sinclair Fwy).
Roads and streets: Tofts Dr; Charger Dr; Hikido Dr; Tourney Dr; Turrett Dr; Aberford Dr; Berryessa Rd; Pembroke Dr; Sierra Rd; Mich Bluff Dr; Ramish Dr; Jonesport Ave; Chertsey Ct; Best Ct; Cardona Way; Oakbluff Ct; Jonesport Ct; Belthorn Ct; Wigan Ct; Talesfore Ct; Woodranch Rd.
Flickinger South neighborhood detailed profile
Florence neighborhood in San Jose statistics: (Find on map)
Area: 0.059 square miles
Population: 423
Population density:
Median household income in 2021:
Median rent in in 2021:
Male vs Females
Median age
Most popular occupations of males: service occupations (32.5%); construction, extraction, and maintenance occupations (12.3%); sales and office occupations (9.8%); computer and mathematical occupations (8.5%); education, training, and library occupations (8.3%); transportation occupations (8.3%); production occupations (8.1%)
Most popular occupations of females: service occupations (43.8%); sales and office occupations (18.0%); business and financial operations occupations (13.8%); education, training, and library occupations (11.3%); production occupations (4.8%); management occupations (except farmers) (4.4%); community and social services occupations (4.3%)
Roads and streets: Rose Ave; Colonade Sq; Rose Ln; Nancy Ln; Estrada Ct; Rose Bay Ct; Keever Ct; Florence Ave.
Florence neighborhood detailed profile
Area: 0.059 square miles
Population: 423
Population density:
| Florence (Nancy): | 7,126 people per square mile |
| San Jose: | 5,625 people per square mile |
Median household income in 2021:
| Florence (Nancy): | $79,738 |
| San Jose: | $126,377 |
Median rent in in 2021:
| Florence (Nancy): | $1,599 |
| San Jose: | $2,001 |
Male vs Females
| Males: | 241 |
| Females: | 181 |
Median age
| Males: | 38.0 years |
| Females: | 37.3 years |
Most popular occupations of males: service occupations (32.5%); construction, extraction, and maintenance occupations (12.3%); sales and office occupations (9.8%); computer and mathematical occupations (8.5%); education, training, and library occupations (8.3%); transportation occupations (8.3%); production occupations (8.1%)
Most popular occupations of females: service occupations (43.8%); sales and office occupations (18.0%); business and financial operations occupations (13.8%); education, training, and library occupations (11.3%); production occupations (4.8%); management occupations (except farmers) (4.4%); community and social services occupations (4.3%)
Roads and streets: Rose Ave; Colonade Sq; Rose Ln; Nancy Ln; Estrada Ct; Rose Bay Ct; Keever Ct; Florence Ave.
Florence neighborhood detailed profile
Florence Court neighborhood in San Jose statistics: (Find on map)
Area: 0.009 square miles
Population: 68
Population density:
Median household income in 2021:
Median rent in in 2021:
Male vs Females
Median age
Most popular occupations of males: construction, extraction, and maintenance occupations (30.6%); sales and office occupations (15.3%); community and social services occupations (11.6%); material moving occupations (10.5%); service occupations (9.7%); architecture and engineering occupations (9.4%); transportation occupations (9.0%)
Most popular occupations of females: sales and office occupations (50.4%); service occupations (19.1%); community and social services occupations (15.1%); education, training, and library occupations (14.4%); legal occupations (8.9%); management occupations (except farmers) (7.6%); material moving occupations (4.2%)
Roads and streets: Florence Ct.
Florence Court neighborhood detailed profile
Area: 0.009 square miles
Population: 68
Population density:
| Florence Court: | 7,609 people per square mile |
| San Jose: | 5,625 people per square mile |
Median household income in 2021:
| Florence Court: | $61,385 |
| San Jose: | $126,377 |
Median rent in in 2021:
| Florence Court: | $1,903 |
| San Jose: | $2,001 |
Male vs Females
| Males: | 36 |
| Females: | 31 |
Median age
| Males: | 32.8 years |
| Females: | 36.2 years |
Most popular occupations of males: construction, extraction, and maintenance occupations (30.6%); sales and office occupations (15.3%); community and social services occupations (11.6%); material moving occupations (10.5%); service occupations (9.7%); architecture and engineering occupations (9.4%); transportation occupations (9.0%)
Most popular occupations of females: sales and office occupations (50.4%); service occupations (19.1%); community and social services occupations (15.1%); education, training, and library occupations (14.4%); legal occupations (8.9%); management occupations (except farmers) (7.6%); material moving occupations (4.2%)
Roads and streets: Florence Ct.
Florence Court neighborhood detailed profile
Forest neighborhood in San Jose statistics: (Find on map)
Area: 0.054 square miles
Population: 240
Population density:
Median household income in 2021:
Median rent in in 2021:
Male vs Females
Median age
Most popular occupations of males: sales and office occupations (24.5%); management occupations (except farmers) (17.8%); computer and mathematical occupations (14.1%); architecture and engineering occupations (12.2%); construction, extraction, and maintenance occupations (12.2%); business and financial operations occupations (11.5%); arts, design, entertainment, sports, and media occupations (9.3%)
Most popular occupations of females: service occupations (33.6%); healthcare practitioners and technical occupations (20.7%); management occupations (except farmers) (19.9%); sales and office occupations (10.9%); life, physical, and social science occupations (5.5%); community and social services occupations (5.0%); transportation occupations (5.0%)
Roads and streets: Forest Ave; Pineview Dr; Crestview Dr; Fernwood Ave; Pruneridge Ave; Jill Ave; N Winchester Blvd.
Forest neighborhood detailed profile
Area: 0.054 square miles
Population: 240
Population density:
| Forest (Pruneridge): | 4,445 people per square mile |
| San Jose: | 5,625 people per square mile |
Median household income in 2021:
| Forest (Pruneridge): | $177,292 |
| San Jose: | $126,377 |
Median rent in in 2021:
| Forest (Pruneridge): | $2,563 |
| San Jose: | $2,001 |
Male vs Females
| Males: | 129 |
| Females: | 110 |
Median age
| Males: | 35.3 years |
| Females: | 39.6 years |
Most popular occupations of males: sales and office occupations (24.5%); management occupations (except farmers) (17.8%); computer and mathematical occupations (14.1%); architecture and engineering occupations (12.2%); construction, extraction, and maintenance occupations (12.2%); business and financial operations occupations (11.5%); arts, design, entertainment, sports, and media occupations (9.3%)
Most popular occupations of females: service occupations (33.6%); healthcare practitioners and technical occupations (20.7%); management occupations (except farmers) (19.9%); sales and office occupations (10.9%); life, physical, and social science occupations (5.5%); community and social services occupations (5.0%); transportation occupations (5.0%)
Roads and streets: Forest Ave; Pineview Dr; Crestview Dr; Fernwood Ave; Pruneridge Ave; Jill Ave; N Winchester Blvd.
Forest neighborhood detailed profile
Foss neighborhood in San Jose statistics: (Find on map)
Area: 0.012 square miles
Roads and streets: Foss Ave; San Fernando St.
Foss neighborhood detailed profile
Area: 0.012 square miles
Roads and streets: Foss Ave; San Fernando St.
Foss neighborhood detailed profile
Fowler neighborhood in San Jose statistics: (Find on map)
Area: 0.407 square miles
Roads and streets: Delta Rd; Fowler Rd; Ruby Ave; Littleworth Way; Middle Park Dr; Beebe Cir; Stimson Way; Oldfield Way; Christian Dr; Beckley Dr; Linkfield Way; Pinot Blanc Way; Pinot Gris Way; Pomerado Dr; Amos Way; Mosshall Way; Valmaine Ct; Metropolitan Way; Watkins Way; Falerno Way; Grapeleaf Way; Filan Way; Charmat Ct; Lismore Ct; Wingham Ln; Capelaw Ct; Midhurst Way; Charmes Ct; Brut Way; Midhurst Ct; Snowbank Ct; Moonflower Ct; Panmure Ct; Fahrner Ct; Lawther Ct; Penhurst Pl; Montelena Dr; Graach Ct; Fowler Ct; Merlot Ct.
Fowler neighborhood detailed profile
Foxchase neighborhood in San Jose statistics: (Find on map)
Area: 0.033 square miles
Population: 157
Population density:
Median household income in 2021:
Median rent in in 2021:
Male vs Females
Median age
Most popular occupations of males: service occupations (23.4%); construction, extraction, and maintenance occupations (22.5%); computer and mathematical occupations (9.8%); material moving occupations (9.5%); business and financial operations occupations (7.3%); sales and office occupations (7.1%); transportation occupations (6.8%)
Most popular occupations of females: service occupations (37.9%); sales and office occupations (37.6%); education, training, and library occupations (8.0%); computer and mathematical occupations (7.3%); management occupations (except farmers) (6.8%); healthcare practitioners and technical occupations (4.0%); business and financial operations occupations (2.8%)
Roads and streets: Fox Chase Dr.
Foxchase neighborhood detailed profile
Area: 0.033 square miles
Population: 157
Population density:
| Foxchase (Sanchez): | 4,738 people per square mile |
| San Jose: | 5,625 people per square mile |
Median household income in 2021:
| Foxchase (Sanchez): | $55,223 |
| San Jose: | $126,377 |
Median rent in in 2021:
| Foxchase (Sanchez): | $2,323 |
| San Jose: | $2,001 |
Male vs Females
| Males: | 74 |
| Females: | 83 |
Median age
| Males: | 43.1 years |
| Females: | 49.7 years |
Most popular occupations of males: service occupations (23.4%); construction, extraction, and maintenance occupations (22.5%); computer and mathematical occupations (9.8%); material moving occupations (9.5%); business and financial operations occupations (7.3%); sales and office occupations (7.1%); transportation occupations (6.8%)
Most popular occupations of females: service occupations (37.9%); sales and office occupations (37.6%); education, training, and library occupations (8.0%); computer and mathematical occupations (7.3%); management occupations (except farmers) (6.8%); healthcare practitioners and technical occupations (4.0%); business and financial operations occupations (2.8%)
Roads and streets: Fox Chase Dr.
Foxchase neighborhood detailed profile
Fruitdale College neighborhood in San Jose statistics: (Find on map)
Area: 0.045 square miles
Roads and streets: Fruitdale Ave; Goodwin Ave; Lawton Ave.
Fruitdale College neighborhood detailed profile
Area: 0.045 square miles
Roads and streets: Fruitdale Ave; Goodwin Ave; Lawton Ave.
Fruitdale College neighborhood detailed profile
Fruitdale Rexford neighborhood in San Jose statistics: (Find on map)
Area: 0.032 square miles
Roads and streets: Sherman Oaks Dr; Randolph Dr; Mansfield Dr; Kingman Ave.
Fruitdale Rexford neighborhood detailed profile
Area: 0.032 square miles
Roads and streets: Sherman Oaks Dr; Randolph Dr; Mansfield Dr; Kingman Ave.
Fruitdale Rexford neighborhood detailed profile
Garden neighborhood in San Jose statistics: (Find on map)
Area: 0.030 square miles
Roads and streets: Garden Ave; Villa Monterey; Lewis Rd; Sunburst Dr.
Garden neighborhood detailed profile
Area: 0.030 square miles
Roads and streets: Garden Ave; Villa Monterey; Lewis Rd; Sunburst Dr.
Garden neighborhood detailed profile
Garden Alameda neighborhood in San Jose statistics: (Find on map)
Area: 0.239 square miles
Population: 965
Population density:
Median household income in 2021:
Median rent in in 2021:
Male vs Females
Median age
Average estimated value of detached houses in 2021 (87.0% of all units):
Most popular occupations of males: management occupations (except farmers) (44.9%); construction, extraction, and maintenance occupations (14.2%); computer and mathematical occupations (12.9%); community and social services occupations (6.5%); architecture and engineering occupations (6.3%); healthcare practitioners and technical occupations (5.4%); sales and office occupations (4.4%)
Most popular occupations of females: management occupations (except farmers) (36.1%); transportation occupations (21.4%); sales and office occupations (14.6%); business and financial operations occupations (12.3%); production occupations (11.1%); life, physical, and social science occupations (9.6%); education, training, and library occupations (8.6%)
Roads and streets: Stockton Ave; Villa Ave; W Julian St; Cinnabar St; Schiele Ave; Harding Ave; Pershing Ave; N Morrison Ave; Hoover Ave; Lenzen Ave; Clinton Pl; Lenzen Ct.
Garden Alameda neighborhood detailed profile
Area: 0.239 square miles
Population: 965
Population density:
| Garden Alameda: | 4,038 people per square mile |
| San Jose: | 5,625 people per square mile |
Median household income in 2021:
| Garden Alameda: | $178,827 |
| San Jose: | $126,377 |
Median rent in in 2021:
| Garden Alameda: | $1,852 |
| San Jose: | $2,001 |
Male vs Females
| Males: | 510 |
| Females: | 455 |
Median age
| Males: | 35.2 years |
| Females: | 39.6 years |
Average estimated value of detached houses in 2021 (87.0% of all units):
| Garden Alameda: | $1,158,959 |
| San Jose: | $1,403,256 |
Most popular occupations of males: management occupations (except farmers) (44.9%); construction, extraction, and maintenance occupations (14.2%); computer and mathematical occupations (12.9%); community and social services occupations (6.5%); architecture and engineering occupations (6.3%); healthcare practitioners and technical occupations (5.4%); sales and office occupations (4.4%)
Most popular occupations of females: management occupations (except farmers) (36.1%); transportation occupations (21.4%); sales and office occupations (14.6%); business and financial operations occupations (12.3%); production occupations (11.1%); life, physical, and social science occupations (9.6%); education, training, and library occupations (8.6%)
Roads and streets: Stockton Ave; Villa Ave; W Julian St; Cinnabar St; Schiele Ave; Harding Ave; Pershing Ave; N Morrison Ave; Hoover Ave; Lenzen Ave; Clinton Pl; Lenzen Ct.
Garden Alameda neighborhood detailed profile
Gardner neighborhood in San Jose statistics: (Find on map)
Area: 0.108 square miles
Population: 1,536
Population density:
Median household income in 2021:
Median rent in in 2021:
Male vs Females
Median age
Housing prices:
Average estimated value of detached houses in 2021 (80.6% of all units):
Average estimated value of townhouses or other attached units in 2021 (3.8% of all units):
Most popular occupations of males: material moving occupations (13.6%); community and social services occupations (12.2%); management occupations (except farmers) (12.0%); production occupations (9.5%); sales and office occupations (9.2%); service occupations (8.7%); construction, extraction, and maintenance occupations (8.6%)
Most popular occupations of females: sales and office occupations (23.8%); service occupations (20.6%); management occupations (except farmers) (13.8%); education, training, and library occupations (12.5%); transportation occupations (6.5%); community and social services occupations (4.5%); computer and mathematical occupations (3.8%)
Roads and streets: West Virginia St; Jerome St; Illinois Ave; Delmas Ave; Brown St; Willis Ave; Minor Ave; Spencer Ave; W William St; Prevost St.
Gardner neighborhood detailed profile
Area: 0.108 square miles
Population: 1,536
Population density:
| Gardner: | 14,157 people per square mile |
| San Jose: | 5,625 people per square mile |
Median household income in 2021:
| Gardner: | $150,834 |
| San Jose: | $126,377 |
Median rent in in 2021:
| Gardner: | $2,207 |
| San Jose: | $2,001 |
Male vs Females
| Males: | 753 |
| Females: | 782 |
Median age
| Males: | 36.9 years |
| Females: | 38.3 years |
Housing prices:
Average estimated value of detached houses in 2021 (80.6% of all units):
| Gardner: | $968,788 |
| San Jose: | $1,403,256 |
Average estimated value of townhouses or other attached units in 2021 (3.8% of all units):
| This neighborhood: | $912,195 |
| city: | $892,629 |
Most popular occupations of males: material moving occupations (13.6%); community and social services occupations (12.2%); management occupations (except farmers) (12.0%); production occupations (9.5%); sales and office occupations (9.2%); service occupations (8.7%); construction, extraction, and maintenance occupations (8.6%)
Most popular occupations of females: sales and office occupations (23.8%); service occupations (20.6%); management occupations (except farmers) (13.8%); education, training, and library occupations (12.5%); transportation occupations (6.5%); community and social services occupations (4.5%); computer and mathematical occupations (3.8%)
Roads and streets: West Virginia St; Jerome St; Illinois Ave; Delmas Ave; Brown St; Willis Ave; Minor Ave; Spencer Ave; W William St; Prevost St.
Gardner neighborhood detailed profile
Gateview neighborhood in San Jose statistics: (Find on map)
Area: 0.073 square miles
Population: 403
Population density:
Median household income in 2021:
Median rent in in 2021:
Male vs Females
Median age
Housing prices:
Average estimated value of detached houses in 2021 (27.5% of all units):
Average estimated value of townhouses or other attached units in 2021 (25.2% of all units):
Average estimated '21 value of housing units in 5-or-more-unit structures (6.1% of all units):
Most popular occupations of males: sales and office occupations (22.0%); material moving occupations (15.8%); construction, extraction, and maintenance occupations (14.1%); computer and mathematical occupations (11.2%); service occupations (9.1%); management occupations (except farmers) (8.3%); business and financial operations occupations (7.9%)
Most popular occupations of females: service occupations (41.6%); production occupations (20.4%); management occupations (except farmers) (15.1%); computer and mathematical occupations (13.9%); sales and office occupations (12.7%); architecture and engineering occupations (12.2%); material moving occupations (10.3%)
Roads and streets: Gateview Dr; Beaver Creek Way; Lava Dr; Meadowmont Dr; Southgrove Dr; Bear Valley Ln; Northgrove Ln; Ravine Dr; Stanislaus Dr; Lava Way; Grouse Way; Granite Ln; Mountaingate Way; Whitefir Ln; Dragonfly Way; Taproot Ct; Heartwood Way; Sapwood Ln; Antelope Dr; Southgrove Ln; Ferndale Way; Sweetwater Way; Stanislaus Ct; Toiyabe Ct; Granite Way; Northgrove Way; Ravine Ct; Basalt Ct; Gateview Ct.
Gateview neighborhood detailed profile
Area: 0.073 square miles
Population: 403
Population density:
| Gateview: | 5,536 people per square mile |
| San Jose: | 5,625 people per square mile |
Median household income in 2021:
| Gateview: | $63,438 |
| San Jose: | $126,377 |
Median rent in in 2021:
| Gateview: | $1,319 |
| San Jose: | $2,001 |
Male vs Females
| Males: | 207 |
| Females: | 196 |
Median age
| Males: | 28.1 years |
| Females: | 28.5 years |
Housing prices:
Average estimated value of detached houses in 2021 (27.5% of all units):
| Gateview: | $2,616,874 |
| San Jose: | $1,403,256 |
Average estimated value of townhouses or other attached units in 2021 (25.2% of all units):
| This neighborhood: | $1,178,036 |
| city: | $892,629 |
Average estimated '21 value of housing units in 5-or-more-unit structures (6.1% of all units):
| Gateview: | $490,330 |
| San Jose: | $688,625 |
Most popular occupations of males: sales and office occupations (22.0%); material moving occupations (15.8%); construction, extraction, and maintenance occupations (14.1%); computer and mathematical occupations (11.2%); service occupations (9.1%); management occupations (except farmers) (8.3%); business and financial operations occupations (7.9%)
Most popular occupations of females: service occupations (41.6%); production occupations (20.4%); management occupations (except farmers) (15.1%); computer and mathematical occupations (13.9%); sales and office occupations (12.7%); architecture and engineering occupations (12.2%); material moving occupations (10.3%)
Roads and streets: Gateview Dr; Beaver Creek Way; Lava Dr; Meadowmont Dr; Southgrove Dr; Bear Valley Ln; Northgrove Ln; Ravine Dr; Stanislaus Dr; Lava Way; Grouse Way; Granite Ln; Mountaingate Way; Whitefir Ln; Dragonfly Way; Taproot Ct; Heartwood Way; Sapwood Ln; Antelope Dr; Southgrove Ln; Ferndale Way; Sweetwater Way; Stanislaus Ct; Toiyabe Ct; Granite Way; Northgrove Way; Ravine Ct; Basalt Ct; Gateview Ct.
Gateview neighborhood detailed profile
Gawain neighborhood in San Jose statistics: (Find on map)
Area: 0.088 square miles
Population: 3,480
Population density:
Median household income in 2021:
Median rent in in 2021:
Male vs Females
Median age
Housing prices:
Average estimated value of detached houses in 2021 (90.2% of all units):
Average estimated value of townhouses or other attached units in 2021 (1.4% of all units):
Most popular occupations of males: sales and office occupations (22.4%); construction, extraction, and maintenance occupations (14.5%); management occupations (except farmers) (11.4%); service occupations (11.0%); transportation occupations (9.8%); production occupations (5.9%); architecture and engineering occupations (2.8%)
Most popular occupations of females: sales and office occupations (27.7%); service occupations (21.2%); healthcare practitioners and technical occupations (19.4%); education, training, and library occupations (16.3%); management occupations (except farmers) (4.8%); material moving occupations (3.2%); production occupations (2.8%)
Roads and streets: Golf Dr; Gridley St; Gawain Dr; Percivale Dr; Flagler St; Modred Dr; Tristian Ave; Duncan St; Bedivere Dr; Ellery St; N Ridge Vista Ave; Carver St.
Gawain neighborhood detailed profile
Area: 0.088 square miles
Population: 3,480
Population density:
| Gawain (Percivale): | 39,563 people per square mile |
| San Jose: | 5,625 people per square mile |
Median household income in 2021:
| Gawain (Percivale): | $134,467 |
| San Jose: | $126,377 |
Median rent in in 2021:
| Gawain (Percivale): | $2,878 |
| San Jose: | $2,001 |
Male vs Females
| Males: | 2,016 |
| Females: | 1,463 |
Median age
| Males: | 35.2 years |
| Females: | 47.3 years |
Housing prices:
Average estimated value of detached houses in 2021 (90.2% of all units):
| Gawain (Percivale): | $769,003 |
| San Jose: | $1,403,256 |
Average estimated value of townhouses or other attached units in 2021 (1.4% of all units):
| This neighborhood: | $490,138 |
| city: | $892,629 |
Most popular occupations of males: sales and office occupations (22.4%); construction, extraction, and maintenance occupations (14.5%); management occupations (except farmers) (11.4%); service occupations (11.0%); transportation occupations (9.8%); production occupations (5.9%); architecture and engineering occupations (2.8%)
Most popular occupations of females: sales and office occupations (27.7%); service occupations (21.2%); healthcare practitioners and technical occupations (19.4%); education, training, and library occupations (16.3%); management occupations (except farmers) (4.8%); material moving occupations (3.2%); production occupations (2.8%)
Roads and streets: Golf Dr; Gridley St; Gawain Dr; Percivale Dr; Flagler St; Modred Dr; Tristian Ave; Duncan St; Bedivere Dr; Ellery St; N Ridge Vista Ave; Carver St.
Gawain neighborhood detailed profile
Gilchrist neighborhood in San Jose statistics: (Find on map)
Area: 0.062 square miles
Population: 650
Population density:
Median household income in 2021:
Median rent in in 2021:
Male vs Females
Median age
Housing prices:
Average estimated value of detached houses in 2021 (96.4% of all units):
Average estimated value of townhouses or other attached units in 2021 (13.1% of all units):
Average estimated '21 value of housing units in 3-to-4-unit structures (1.5% of all units):
Average estimated '21 value of housing units in 5-or-more-unit structures (5.1% of all units):
Average estimated value of mobile home in 2021 (8.8% of all units):
Most popular occupations of males: service occupations (22.8%); computer and mathematical occupations (16.6%); architecture and engineering occupations (16.6%); construction, extraction, and maintenance occupations (12.0%); management occupations (except farmers) (11.7%); material moving occupations (9.1%); production occupations (7.2%)
Most popular occupations of females: sales and office occupations (32.3%); business and financial operations occupations (17.4%); management occupations (except farmers) (9.6%); service occupations (8.6%); healthcare practitioners and technical occupations (6.9%); education, training, and library occupations (6.7%); computer and mathematical occupations (6.0%)
Limited-access highways (interstate or state) in this neighborhood: .
Roads and streets: Las Palmas Way; Gilchrist Dr; N Capitol Ave; Mabury Rd; Gilchrist Walkway; Wyman Way; Williford Dr; Golzio Ct; Royal Palm Ct; Palmetta Palm Ct; Cane Palm Ct; Sentry Palm Ct; Dillion Ct; Date Palm Ct; Fan Palm Ct; Bamboo Palm Ct; King Palm Ct; Fountain Palm Ct; Windmill Palm Ct; Island Palm Ct; Lady Palm Ct; Canary Palm Ct.
Gilchrist neighborhood detailed profile
Area: 0.062 square miles
Population: 650
Population density:
| Gilchrist: | 10,440 people per square mile |
| San Jose: | 5,625 people per square mile |
Median household income in 2021:
| Gilchrist: | $125,302 |
| San Jose: | $126,377 |
Median rent in in 2021:
| Gilchrist: | $3,233 |
| San Jose: | $2,001 |
Male vs Females
| Males: | 340 |
| Females: | 310 |
Median age
| Males: | 37.8 years |
| Females: | 37.5 years |
Housing prices:
Average estimated value of detached houses in 2021 (96.4% of all units):
| Gilchrist: | $1,083,969 |
| San Jose: | $1,403,256 |
Average estimated value of townhouses or other attached units in 2021 (13.1% of all units):
| This neighborhood: | $889,744 |
| city: | $892,629 |
Average estimated '21 value of housing units in 3-to-4-unit structures (1.5% of all units):
| Gilchrist: | $3,392,998 |
| city: | $680,453 |
Average estimated '21 value of housing units in 5-or-more-unit structures (5.1% of all units):
| Gilchrist: | $449,181 |
| San Jose: | $688,625 |
Average estimated value of mobile home in 2021 (8.8% of all units):
| Gilchrist: | $253,459 |
| San Jose: | $240,963 |
Most popular occupations of males: service occupations (22.8%); computer and mathematical occupations (16.6%); architecture and engineering occupations (16.6%); construction, extraction, and maintenance occupations (12.0%); management occupations (except farmers) (11.7%); material moving occupations (9.1%); production occupations (7.2%)
Most popular occupations of females: sales and office occupations (32.3%); business and financial operations occupations (17.4%); management occupations (except farmers) (9.6%); service occupations (8.6%); healthcare practitioners and technical occupations (6.9%); education, training, and library occupations (6.7%); computer and mathematical occupations (6.0%)
Limited-access highways (interstate or state) in this neighborhood: .
Roads and streets: Las Palmas Way; Gilchrist Dr; N Capitol Ave; Mabury Rd; Gilchrist Walkway; Wyman Way; Williford Dr; Golzio Ct; Royal Palm Ct; Palmetta Palm Ct; Cane Palm Ct; Sentry Palm Ct; Dillion Ct; Date Palm Ct; Fan Palm Ct; Bamboo Palm Ct; King Palm Ct; Fountain Palm Ct; Windmill Palm Ct; Island Palm Ct; Lady Palm Ct; Canary Palm Ct.
Gilchrist neighborhood detailed profile
Glen Crest neighborhood in San Jose statistics: (Find on map)
Area: 0.148 square miles
Population: 4,854
Population density:
Median household income in 2021:
Median rent in in 2021:
Male vs Females
Median age
Housing prices:
Average estimated value of detached houses in 2021 (63.4% of all units):
Average estimated value of townhouses or other attached units in 2021 (35.8% of all units):
Most popular occupations of males: computer and mathematical occupations (33.2%); management occupations (except farmers) (28.0%); architecture and engineering occupations (11.6%); sales and office occupations (8.1%); business and financial operations occupations (6.4%); legal occupations (2.0%); arts, design, entertainment, sports, and media occupations (2.0%)
Most popular occupations of females: business and financial operations occupations (18.9%); education, training, and library occupations (17.1%); sales and office occupations (12.4%); management occupations (except farmers) (11.7%); computer and mathematical occupations (11.1%); service occupations (9.1%); healthcare practitioners and technical occupations (5.5%)
Roads and streets: Valley Quail Cir; Quail Creek Cir; Mountain Quail Cir; Quail Cove Way; Quail Dunes Way; Quail Knoll Ct; McCall Dr; Hollow Tree Way; Serenity Way; Hollow Park Ct; Quail Cove Ct.
Glen Crest neighborhood detailed profile
Area: 0.148 square miles
Population: 4,854
Population density:
| Glen Crest: | 32,886 people per square mile |
| San Jose: | 5,625 people per square mile |
Median household income in 2021:
| Glen Crest: | $221,826 |
| San Jose: | $126,377 |
Median rent in in 2021:
| Glen Crest: | $3,301 |
| San Jose: | $2,001 |
Male vs Females
| Males: | 2,522 |
| Females: | 2,331 |
Median age
| Males: | 41.3 years |
| Females: | 45.7 years |
Housing prices:
Average estimated value of detached houses in 2021 (63.4% of all units):
| Glen Crest: | $1,528,717 |
| San Jose: | $1,403,256 |
Average estimated value of townhouses or other attached units in 2021 (35.8% of all units):
| This neighborhood: | $909,708 |
| city: | $892,629 |
Most popular occupations of males: computer and mathematical occupations (33.2%); management occupations (except farmers) (28.0%); architecture and engineering occupations (11.6%); sales and office occupations (8.1%); business and financial operations occupations (6.4%); legal occupations (2.0%); arts, design, entertainment, sports, and media occupations (2.0%)
Most popular occupations of females: business and financial operations occupations (18.9%); education, training, and library occupations (17.1%); sales and office occupations (12.4%); management occupations (except farmers) (11.7%); computer and mathematical occupations (11.1%); service occupations (9.1%); healthcare practitioners and technical occupations (5.5%)
Roads and streets: Valley Quail Cir; Quail Creek Cir; Mountain Quail Cir; Quail Cove Way; Quail Dunes Way; Quail Knoll Ct; McCall Dr; Hollow Tree Way; Serenity Way; Hollow Park Ct; Quail Cove Ct.
Glen Crest neighborhood detailed profile
Glenview Serenity neighborhood in San Jose statistics: (Find on map)
Area: 0.279 square miles
Population: 794
Population density:
Median household income in 2021:
Median rent in in 2021:
Male vs Females
Median age
Housing prices:
Average estimated value of detached houses in 2021 (95.0% of all units):
Average estimated value of townhouses or other attached units in 2021 (110.5% of all units):
Most popular occupations of males: legal occupations (1504.2%); production occupations (1337.0%); transportation occupations (835.6%); management occupations (except farmers) (19.3%); business and financial operations occupations (17.8%); sales and office occupations (16.7%); architecture and engineering occupations (12.0%)
Most popular occupations of females: sales and office occupations (9479.5%); architecture and engineering occupations (4100.5%); material moving occupations (2112.4%); production occupations (1242.6%); arts, design, entertainment, sports, and media occupations (1120.2%); management occupations (except farmers) (35.2%); service occupations (17.4%)
Roads and streets: Elwood Rd; Lenwood Way; Glenview Dr; Corvallis Dr; Almaden Rd; Olive Branch Ln; Rajkovich Way; Wilhelmina Way; Tannahill Dr; Serenity Way; Nikette Way; Allston Way; Casual Way; Trinidad Dr; Petroni Way; Nikulina Ct; Dorene Pl; Prentiss Dr; Holly Ann Pl; Norcott Ct; Campisi Ct; Casual Ct; Lansdale Ct; Garrett Ct; Misty Willow Ct; Velvet Meadow Ct; Elwood Ct; Royston Ct; Serenity Ct; Allston Ct; Corvallis Ct.
Glenview Serenity neighborhood detailed profile
Area: 0.279 square miles
Population: 794
Population density:
| Glenview Serenity: | 2,851 people per square mile |
| San Jose: | 5,625 people per square mile |
Median household income in 2021:
| Glenview Serenity: | $250,001 |
| San Jose: | $126,377 |
Median rent in in 2021:
| Glenview Serenity: | $3,301 |
| San Jose: | $2,001 |
Male vs Females
| Males: | 407 |
| Females: | 386 |
Median age
| Males: | 46.9 years |
| Females: | 48.3 years |
Housing prices:
Average estimated value of detached houses in 2021 (95.0% of all units):
| Glenview Serenity: | $2,808,324 |
| San Jose: | $1,403,256 |
Average estimated value of townhouses or other attached units in 2021 (110.5% of all units):
| This neighborhood: | $909,708 |
| city: | $892,629 |
Most popular occupations of males: legal occupations (1504.2%); production occupations (1337.0%); transportation occupations (835.6%); management occupations (except farmers) (19.3%); business and financial operations occupations (17.8%); sales and office occupations (16.7%); architecture and engineering occupations (12.0%)
Most popular occupations of females: sales and office occupations (9479.5%); architecture and engineering occupations (4100.5%); material moving occupations (2112.4%); production occupations (1242.6%); arts, design, entertainment, sports, and media occupations (1120.2%); management occupations (except farmers) (35.2%); service occupations (17.4%)
Roads and streets: Elwood Rd; Lenwood Way; Glenview Dr; Corvallis Dr; Almaden Rd; Olive Branch Ln; Rajkovich Way; Wilhelmina Way; Tannahill Dr; Serenity Way; Nikette Way; Allston Way; Casual Way; Trinidad Dr; Petroni Way; Nikulina Ct; Dorene Pl; Prentiss Dr; Holly Ann Pl; Norcott Ct; Campisi Ct; Casual Ct; Lansdale Ct; Garrett Ct; Misty Willow Ct; Velvet Meadow Ct; Elwood Ct; Royston Ct; Serenity Ct; Allston Ct; Corvallis Ct.
Glenview Serenity neighborhood detailed profile
Glider neighborhood in San Jose statistics: (Find on map)
Area: 0.313 square miles
Population: 1,465
Population density:
Median household income in 2021:
Median rent in in 2021:
Male vs Females
Median age
Average estimated value of detached houses in 2021 (100.0% of all units):
Most popular occupations of males: computer and mathematical occupations (22.1%); management occupations (except farmers) (17.8%); sales and office occupations (14.9%); architecture and engineering occupations (10.4%); service occupations (7.1%); business and financial operations occupations (6.6%); arts, design, entertainment, sports, and media occupations (6.4%)
Most popular occupations of females: sales and office occupations (25.3%); service occupations (16.0%); healthcare practitioners and technical occupations (12.8%); education, training, and library occupations (11.4%); business and financial operations occupations (9.2%); management occupations (except farmers) (7.1%); computer and mathematical occupations (5.8%)
Roads and streets: Suisse Dr; Galen Dr; Curie Dr; Elvis Dr; Dunn Ave; Glider Dr; Culvert Dr; Cozy Dr; Jesse James Dr; Banner Dr; Radiant Dr; Current Dr; Drifter Dr; Pancho Ct; Dewey Way; Contessa Ct; Banner Ct; Forbes Dr; Northdale Ct; Cozy Ct; Cessna Ct; Haley Ct; Elder Ct.
Other features: Canoas Crk.
Glider neighborhood detailed profile
Area: 0.313 square miles
Population: 1,465
Population density:
| Glider: | 4,678 people per square mile |
| San Jose: | 5,625 people per square mile |
Median household income in 2021:
| Glider: | $170,321 |
| San Jose: | $126,377 |
Median rent in in 2021:
| Glider: | $3,262 |
| San Jose: | $2,001 |
Male vs Females
| Males: | 751 |
| Females: | 714 |
Median age
| Males: | 40.3 years |
| Females: | 42.5 years |
Average estimated value of detached houses in 2021 (100.0% of all units):
| Glider: | $1,201,016 |
| San Jose: | $1,403,256 |
Most popular occupations of males: computer and mathematical occupations (22.1%); management occupations (except farmers) (17.8%); sales and office occupations (14.9%); architecture and engineering occupations (10.4%); service occupations (7.1%); business and financial operations occupations (6.6%); arts, design, entertainment, sports, and media occupations (6.4%)
Most popular occupations of females: sales and office occupations (25.3%); service occupations (16.0%); healthcare practitioners and technical occupations (12.8%); education, training, and library occupations (11.4%); business and financial operations occupations (9.2%); management occupations (except farmers) (7.1%); computer and mathematical occupations (5.8%)
Roads and streets: Suisse Dr; Galen Dr; Curie Dr; Elvis Dr; Dunn Ave; Glider Dr; Culvert Dr; Cozy Dr; Jesse James Dr; Banner Dr; Radiant Dr; Current Dr; Drifter Dr; Pancho Ct; Dewey Way; Contessa Ct; Banner Ct; Forbes Dr; Northdale Ct; Cozy Ct; Cessna Ct; Haley Ct; Elder Ct.
Other features: Canoas Crk.
Glider neighborhood detailed profile
Gold Creek neighborhood in San Jose statistics: (Find on map)
Area: 0.043 square miles
Population: 291
Population density:
Median household income in 2021:
Median rent in in 2021:
Male vs Females
Median age
Most popular occupations of males: computer and mathematical occupations (33.6%); management occupations (except farmers) (19.6%); business and financial operations occupations (11.8%); sales and office occupations (8.0%); architecture and engineering occupations (7.8%); production occupations (6.4%); healthcare practitioners and technical occupations (4.1%)
Most popular occupations of females: sales and office occupations (19.4%); education, training, and library occupations (15.5%); management occupations (except farmers) (14.0%); business and financial operations occupations (14.0%); healthcare practitioners and technical occupations (11.7%); service occupations (8.5%); community and social services occupations (7.3%)
Roads and streets: Sleepy Creek Dr; Kiser Dr; Martwood Way; Alamitos Creek Dr; Wild Creek Dr; Sleepy Creek Way; Ivory Creek Dr.
Gold Creek neighborhood detailed profile
Area: 0.043 square miles
Population: 291
Population density:
| Gold Creek: | 6,752 people per square mile |
| San Jose: | 5,625 people per square mile |
Median household income in 2021:
| Gold Creek: | $213,750 |
| San Jose: | $126,377 |
Median rent in in 2021:
| Gold Creek: | $3,250 |
| San Jose: | $2,001 |
Male vs Females
| Males: | 139 |
| Females: | 151 |
Median age
| Males: | 40.3 years |
| Females: | 41.3 years |
Most popular occupations of males: computer and mathematical occupations (33.6%); management occupations (except farmers) (19.6%); business and financial operations occupations (11.8%); sales and office occupations (8.0%); architecture and engineering occupations (7.8%); production occupations (6.4%); healthcare practitioners and technical occupations (4.1%)
Most popular occupations of females: sales and office occupations (19.4%); education, training, and library occupations (15.5%); management occupations (except farmers) (14.0%); business and financial operations occupations (14.0%); healthcare practitioners and technical occupations (11.7%); service occupations (8.5%); community and social services occupations (7.3%)
Roads and streets: Sleepy Creek Dr; Kiser Dr; Martwood Way; Alamitos Creek Dr; Wild Creek Dr; Sleepy Creek Way; Ivory Creek Dr.
Gold Creek neighborhood detailed profile
Goodyear neighborhood in San Jose statistics: (Find on map)
Area: 0.118 square miles
Population: 2,509
Population density:
Median household income in 2021:
Median rent in in 2021:
Male vs Females
Median age
Average estimated value of detached houses in 2021 (37.7% of all units):
Most popular occupations of males: construction, extraction, and maintenance occupations (32.0%); management occupations (except farmers) (18.1%); sales and office occupations (12.7%); service occupations (9.7%); production occupations (7.9%); material moving occupations (5.1%); transportation occupations (4.4%)
Most popular occupations of females: service occupations (33.4%); sales and office occupations (16.3%); management occupations (except farmers) (12.5%); computer and mathematical occupations (12.3%); education, training, and library occupations (7.3%); farming, fishing, and forestry occupations (5.8%); transportation occupations (5.4%)
Highways in this neighborhood: S 1st St (State Hwy 82).
Roads and streets: Mastic St; Sherman St; Plum St; Floyd St; W Alma Ave; W Humboldt St; Goodyear St; Willow St; Graham Ave; S 2nd St.
Goodyear neighborhood detailed profile
Area: 0.118 square miles
Population: 2,509
Population density:
| Goodyear (Mastic): | 21,331 people per square mile |
| San Jose: | 5,625 people per square mile |
Median household income in 2021:
| Goodyear (Mastic): | $66,254 |
| San Jose: | $126,377 |
Median rent in in 2021:
| Goodyear (Mastic): | $1,925 |
| San Jose: | $2,001 |
Male vs Females
| Males: | 1,305 |
| Females: | 1,204 |
Median age
| Males: | 36.2 years |
| Females: | 35.2 years |
Average estimated value of detached houses in 2021 (37.7% of all units):
| Goodyear (Mastic): | $838,732 |
| San Jose: | $1,403,256 |
Most popular occupations of males: construction, extraction, and maintenance occupations (32.0%); management occupations (except farmers) (18.1%); sales and office occupations (12.7%); service occupations (9.7%); production occupations (7.9%); material moving occupations (5.1%); transportation occupations (4.4%)
Most popular occupations of females: service occupations (33.4%); sales and office occupations (16.3%); management occupations (except farmers) (12.5%); computer and mathematical occupations (12.3%); education, training, and library occupations (7.3%); farming, fishing, and forestry occupations (5.8%); transportation occupations (5.4%)
Highways in this neighborhood: S 1st St (State Hwy 82).
Roads and streets: Mastic St; Sherman St; Plum St; Floyd St; W Alma Ave; W Humboldt St; Goodyear St; Willow St; Graham Ave; S 2nd St.
Goodyear neighborhood detailed profile
Gordy neighborhood in San Jose statistics: (Find on map)
Area: 0.067 square miles
Population: 511
Population density:
Median household income in 2021:
Median rent in in 2021:
Male vs Females
Median age
Most popular occupations of males: architecture and engineering occupations (21.0%); sales and office occupations (14.4%); computer and mathematical occupations (13.1%); service occupations (12.9%); material moving occupations (8.8%); production occupations (7.3%); education, training, and library occupations (5.4%)
Most popular occupations of females: healthcare practitioners and technical occupations (18.3%); service occupations (17.6%); sales and office occupations (11.0%); architecture and engineering occupations (10.5%); management occupations (except farmers) (10.1%); arts, design, entertainment, sports, and media occupations (8.2%); production occupations (6.0%)
Roads and streets: Gordy Dr; Prelude Dr; Williamsport Dr; Cleo Springs Dr; New Bedford Ct; Greensboro Ct; Tersini Ct; Lindsay Ann Ter; Cleo Springs Ct; Jonesboro Ct; Asheboro Ct.
Railroad features: Union Pacific RR.
Gordy neighborhood detailed profile
Area: 0.067 square miles
Population: 511
Population density:
| Gordy: | 7,615 people per square mile |
| San Jose: | 5,625 people per square mile |
Median household income in 2021:
| Gordy: | $124,000 |
| San Jose: | $126,377 |
Median rent in in 2021:
| Gordy: | $1,883 |
| San Jose: | $2,001 |
Male vs Females
| Males: | 252 |
| Females: | 259 |
Median age
| Males: | 37.4 years |
| Females: | 51.0 years |
Most popular occupations of males: architecture and engineering occupations (21.0%); sales and office occupations (14.4%); computer and mathematical occupations (13.1%); service occupations (12.9%); material moving occupations (8.8%); production occupations (7.3%); education, training, and library occupations (5.4%)
Most popular occupations of females: healthcare practitioners and technical occupations (18.3%); service occupations (17.6%); sales and office occupations (11.0%); architecture and engineering occupations (10.5%); management occupations (except farmers) (10.1%); arts, design, entertainment, sports, and media occupations (8.2%); production occupations (6.0%)
Roads and streets: Gordy Dr; Prelude Dr; Williamsport Dr; Cleo Springs Dr; New Bedford Ct; Greensboro Ct; Tersini Ct; Lindsay Ann Ter; Cleo Springs Ct; Jonesboro Ct; Asheboro Ct.
Railroad features: Union Pacific RR.
Gordy neighborhood detailed profile
Granite Creek neighborhood in San Jose statistics: (Find on map)
Area: 0.038 square miles
Population: 373
Population density:
Median household income in 2021:
Median rent in in 2021:
Male vs Females
Median age
Average estimated value of detached houses in 2021 (100.0% of all units):
Most popular occupations of males: construction, extraction, and maintenance occupations (20.1%); sales and office occupations (16.0%); service occupations (14.8%); material moving occupations (14.1%); computer and mathematical occupations (9.0%); production occupations (7.2%); management occupations (except farmers) (5.2%)
Most popular occupations of females: sales and office occupations (38.3%); management occupations (except farmers) (19.0%); service occupations (10.9%); education, training, and library occupations (8.6%); healthcare practitioners and technical occupations (6.6%); business and financial operations occupations (5.7%); community and social services occupations (5.4%)
Roads and streets: Granite Creek Pl; Capitol Expy Rmp; Mervyns Way; Mc Ginness Ave; Wilkey Ct; Adobecreek Ct; Pebble Creek Ct; Betten Ct.
Granite Creek neighborhood detailed profile
Area: 0.038 square miles
Population: 373
Population density:
| Granite Creek: | 9,711 people per square mile |
| San Jose: | 5,625 people per square mile |
Median household income in 2021:
| Granite Creek: | $100,958 |
| San Jose: | $126,377 |
Median rent in in 2021:
| Granite Creek: | $2,338 |
| San Jose: | $2,001 |
Male vs Females
| Males: | 203 |
| Females: | 170 |
Median age
| Males: | 33.6 years |
| Females: | 50.9 years |
Average estimated value of detached houses in 2021 (100.0% of all units):
| Granite Creek: | $713,850 |
| San Jose: | $1,403,256 |
Most popular occupations of males: construction, extraction, and maintenance occupations (20.1%); sales and office occupations (16.0%); service occupations (14.8%); material moving occupations (14.1%); computer and mathematical occupations (9.0%); production occupations (7.2%); management occupations (except farmers) (5.2%)
Most popular occupations of females: sales and office occupations (38.3%); management occupations (except farmers) (19.0%); service occupations (10.9%); education, training, and library occupations (8.6%); healthcare practitioners and technical occupations (6.6%); business and financial operations occupations (5.7%); community and social services occupations (5.4%)
Roads and streets: Granite Creek Pl; Capitol Expy Rmp; Mervyns Way; Mc Ginness Ave; Wilkey Ct; Adobecreek Ct; Pebble Creek Ct; Betten Ct.
Granite Creek neighborhood detailed profile
Graystone neighborhood in San Jose statistics: (Find on map)
Area: 0.449 square miles
Population: 2,253
Population density:
Median household income in 2021:
Median rent in in 2021:
Male vs Females
Median age
Housing prices:
Average estimated value of detached houses in 2021 (98.4% of all units):
Average estimated value of townhouses or other attached units in 2021 (1.4% of all units):
Most popular occupations of males: management occupations (except farmers) (35.8%); computer and mathematical occupations (20.7%); architecture and engineering occupations (10.6%); sales and office occupations (8.8%); healthcare practitioners and technical occupations (8.5%); business and financial operations occupations (7.9%); transportation occupations (2.1%)
Most popular occupations of females: management occupations (except farmers) (18.7%); business and financial operations occupations (14.7%); sales and office occupations (14.3%); life, physical, and social science occupations (12.6%); service occupations (11.4%); education, training, and library occupations (9.5%); healthcare practitioners and technical occupations (8.4%)
Limited-access highways (interstate or state) in this neighborhood: Almaden Expy.
Roads and streets: Bret Harte Dr (); Hampswood Way; Burnside Dr (); Queenswood Way; Elmsdale Dr; Woodview Pl; Burlwood Dr; Tunbridge Way; Almaden Rd; Maiden Ln; Shearwater Dr; Brooktree Way; Caggiano Dr; Azalea Dr; Yarmouth Way; Marlinton Ct; Hurlstone Ln; Kindra Hill Dr; O'Grady Dr; Sheehan Ct; Brooktree Ct; Carrabelle Way; Worthing Ct; Morecambe Dr; Fieldwood Ct; Woodthrush Ct; Foxswallow Ct; Old Creek Dr; Downswood Ct; Via Valiente; Surian Ct; Spicewood Ct; Grovewood Ct; Kristen Ct; Buckwood Ct; Rycroft Ct; Queenswood Ct (Greenwood Ct); Seth Ct; Waldheim Ct; Figwood Ct; Hampswood Ct; Caggiano Ct; Freitas Rd.
Graystone neighborhood detailed profile
Area: 0.449 square miles
Population: 2,253
Population density:
| Graystone: | 5,015 people per square mile |
| San Jose: | 5,625 people per square mile |
Median household income in 2021:
| Graystone: | $232,919 |
| San Jose: | $126,377 |
Median rent in in 2021:
| Graystone: | $3,259 |
| San Jose: | $2,001 |
Male vs Females
| Males: | 1,033 |
| Females: | 1,220 |
Median age
| Males: | 42.5 years |
| Females: | 43.0 years |
Housing prices:
Average estimated value of detached houses in 2021 (98.4% of all units):
| Graystone: | $1,601,321 |
| San Jose: | $1,403,256 |
Average estimated value of townhouses or other attached units in 2021 (1.4% of all units):
| This neighborhood: | $909,708 |
| city: | $892,629 |
Most popular occupations of males: management occupations (except farmers) (35.8%); computer and mathematical occupations (20.7%); architecture and engineering occupations (10.6%); sales and office occupations (8.8%); healthcare practitioners and technical occupations (8.5%); business and financial operations occupations (7.9%); transportation occupations (2.1%)
Most popular occupations of females: management occupations (except farmers) (18.7%); business and financial operations occupations (14.7%); sales and office occupations (14.3%); life, physical, and social science occupations (12.6%); service occupations (11.4%); education, training, and library occupations (9.5%); healthcare practitioners and technical occupations (8.4%)
Limited-access highways (interstate or state) in this neighborhood: Almaden Expy.
Roads and streets: Bret Harte Dr (); Hampswood Way; Burnside Dr (); Queenswood Way; Elmsdale Dr; Woodview Pl; Burlwood Dr; Tunbridge Way; Almaden Rd; Maiden Ln; Shearwater Dr; Brooktree Way; Caggiano Dr; Azalea Dr; Yarmouth Way; Marlinton Ct; Hurlstone Ln; Kindra Hill Dr; O'Grady Dr; Sheehan Ct; Brooktree Ct; Carrabelle Way; Worthing Ct; Morecambe Dr; Fieldwood Ct; Woodthrush Ct; Foxswallow Ct; Old Creek Dr; Downswood Ct; Via Valiente; Surian Ct; Spicewood Ct; Grovewood Ct; Kristen Ct; Buckwood Ct; Rycroft Ct; Queenswood Ct (Greenwood Ct); Seth Ct; Waldheim Ct; Figwood Ct; Hampswood Ct; Caggiano Ct; Freitas Rd.
Graystone neighborhood detailed profile
Great Oaks neighborhood in San Jose statistics: (Find on map)
Area: 0.238 square miles
Population: 563
Population density:
Median household income in 2021:
Median rent in in 2021:
Male vs Females
Median age
Most popular occupations of males: architecture and engineering occupations (19.8%); arts, design, entertainment, sports, and media occupations (17.4%); healthcare practitioners and technical occupations (16.9%); sales and office occupations (15.0%); education, training, and library occupations (10.1%); service occupations (7.4%); management occupations (except farmers) (7.2%)
Most popular occupations of females: healthcare practitioners and technical occupations (46.2%); education, training, and library occupations (22.7%); sales and office occupations (15.1%); management occupations (except farmers) (8.4%); business and financial operations occupations (7.6%); service occupations (6.0%); computer and mathematical occupations (3.5%)
Roads and streets: Snow Dr; Savstrom Way; Ella Dr; Blom Dr; Giraudo Dr; Ashmont Dr; Branham Ln E; Giusti Dr; Lyng Dr; Bold Dr; Dickinson Dr; War Admiral Ave; Cloud Dr; Dickinson Way; Battle Dance Dr; Golden Creek Ter; War Admiral Way; Osgood Ct; Ella Ct; Bold Ct.
Great Oaks neighborhood detailed profile
Area: 0.238 square miles
Population: 563
Population density:
| Great Oaks: | 2,364 people per square mile |
| San Jose: | 5,625 people per square mile |
Median household income in 2021:
| Great Oaks: | $167,330 |
| San Jose: | $126,377 |
Median rent in in 2021:
| Great Oaks: | $3,167 |
| San Jose: | $2,001 |
Male vs Females
| Males: | 310 |
| Females: | 253 |
Median age
| Males: | 39.1 years |
| Females: | 44.3 years |
Most popular occupations of males: architecture and engineering occupations (19.8%); arts, design, entertainment, sports, and media occupations (17.4%); healthcare practitioners and technical occupations (16.9%); sales and office occupations (15.0%); education, training, and library occupations (10.1%); service occupations (7.4%); management occupations (except farmers) (7.2%)
Most popular occupations of females: healthcare practitioners and technical occupations (46.2%); education, training, and library occupations (22.7%); sales and office occupations (15.1%); management occupations (except farmers) (8.4%); business and financial operations occupations (7.6%); service occupations (6.0%); computer and mathematical occupations (3.5%)
Roads and streets: Snow Dr; Savstrom Way; Ella Dr; Blom Dr; Giraudo Dr; Ashmont Dr; Branham Ln E; Giusti Dr; Lyng Dr; Bold Dr; Dickinson Dr; War Admiral Ave; Cloud Dr; Dickinson Way; Battle Dance Dr; Golden Creek Ter; War Admiral Way; Osgood Ct; Ella Ct; Bold Ct.
Great Oaks neighborhood detailed profile
Greylands neighborhood in San Jose statistics: (Find on map)
Area: 0.167 square miles
Population: 1,116
Population density:
Median household income in 2021:
Median rent in in 2021:
Male vs Females
Median age
Average estimated value of detached houses in 2021 (23.2% of all units):
Most popular occupations of males: computer and mathematical occupations (25.1%); management occupations (except farmers) (16.2%); business and financial operations occupations (14.5%); architecture and engineering occupations (8.3%); education, training, and library occupations (6.7%); sales and office occupations (6.1%); life, physical, and social science occupations (4.2%)
Most popular occupations of females: sales and office occupations (20.0%); education, training, and library occupations (16.3%); arts, design, entertainment, sports, and media occupations (11.6%); healthcare practitioners and technical occupations (11.0%); computer and mathematical occupations (9.3%); architecture and engineering occupations (8.5%); service occupations (7.6%)
Roads and streets: Hamilton Pl; Braddock Ct; Huxley Ct; Weibel Way; Leigh Ave; Wente Way (Wente Pl); Foxhall Loop; Greenwich Ct; Donovan Ct; Keenan Way; Wente Way; Greylands Dr; Willow St; Chandon Ct; Beaulieu Ct; Deloach Ct; Ashmeade Ct; Fetzer Dr; Beringer Ct.
Other features: Los Gatos Crk.
Greylands neighborhood detailed profile
Area: 0.167 square miles
Population: 1,116
Population density:
| Greylands: | 6,681 people per square mile |
| San Jose: | 5,625 people per square mile |
Median household income in 2021:
| Greylands: | $123,928 |
| San Jose: | $126,377 |
Median rent in in 2021:
| Greylands: | $2,548 |
| San Jose: | $2,001 |
Male vs Females
| Males: | 419 |
| Females: | 696 |
Median age
| Males: | 40.0 years |
| Females: | 43.7 years |
Average estimated value of detached houses in 2021 (23.2% of all units):
| Greylands: | $1,437,405 |
| San Jose: | $1,403,256 |
Most popular occupations of males: computer and mathematical occupations (25.1%); management occupations (except farmers) (16.2%); business and financial operations occupations (14.5%); architecture and engineering occupations (8.3%); education, training, and library occupations (6.7%); sales and office occupations (6.1%); life, physical, and social science occupations (4.2%)
Most popular occupations of females: sales and office occupations (20.0%); education, training, and library occupations (16.3%); arts, design, entertainment, sports, and media occupations (11.6%); healthcare practitioners and technical occupations (11.0%); computer and mathematical occupations (9.3%); architecture and engineering occupations (8.5%); service occupations (7.6%)
Roads and streets: Hamilton Pl; Braddock Ct; Huxley Ct; Weibel Way; Leigh Ave; Wente Way (Wente Pl); Foxhall Loop; Greenwich Ct; Donovan Ct; Keenan Way; Wente Way; Greylands Dr; Willow St; Chandon Ct; Beaulieu Ct; Deloach Ct; Ashmeade Ct; Fetzer Dr; Beringer Ct.
Other features: Los Gatos Crk.
Greylands neighborhood detailed profile
Guadalupe Almaden neighborhood in San Jose statistics: (Find on map)
Area: 0.025 square miles
Population: 120
Population density:
Median household income in 2021:
Median rent in in 2021:
Male vs Females
Median age
Most popular occupations of males: sales and office occupations (41.5%); architecture and engineering occupations (26.9%); legal occupations (23.4%); material moving occupations (17.1%); arts, design, entertainment, sports, and media occupations (16.4%); transportation occupations (15.0%); life, physical, and social science occupations (13.5%)
Most popular occupations of females: healthcare practitioners and technical occupations (44.1%); sales and office occupations (32.0%); management occupations (except farmers) (22.5%); education, training, and library occupations (15.8%); business and financial operations occupations (15.4%); community and social services occupations (6.9%); arts, design, entertainment, sports, and media occupations (4.0%)
Roads and streets: Guadalupe Ave; Willow Glen Way.
Guadalupe Almaden neighborhood detailed profile
Area: 0.025 square miles
Population: 120
Population density:
| Guadalupe Almaden (Almaden): | 4,789 people per square mile |
| San Jose: | 5,625 people per square mile |
Median household income in 2021:
| Guadalupe Almaden (Almaden): | $214,399 |
| San Jose: | $126,377 |
Median rent in in 2021:
| Guadalupe Almaden (Almaden): | $1,801 |
| San Jose: | $2,001 |
Male vs Females
| Males: | 52 |
| Females: | 68 |
Median age
| Males: | 42.7 years |
| Females: | 27.7 years |
Most popular occupations of males: sales and office occupations (41.5%); architecture and engineering occupations (26.9%); legal occupations (23.4%); material moving occupations (17.1%); arts, design, entertainment, sports, and media occupations (16.4%); transportation occupations (15.0%); life, physical, and social science occupations (13.5%)
Most popular occupations of females: healthcare practitioners and technical occupations (44.1%); sales and office occupations (32.0%); management occupations (except farmers) (22.5%); education, training, and library occupations (15.8%); business and financial operations occupations (15.4%); community and social services occupations (6.9%); arts, design, entertainment, sports, and media occupations (4.0%)
Roads and streets: Guadalupe Ave; Willow Glen Way.
Guadalupe Almaden neighborhood detailed profile
Guadalupe Canoas neighborhood in San Jose statistics: (Find on map)
Area: 0.046 square miles
Limited-access highways (interstate or state) in this neighborhood: Almaden Expy.
Roads and streets: Almandon Rd.
Guadalupe Canoas neighborhood detailed profile
Area: 0.046 square miles
Limited-access highways (interstate or state) in this neighborhood: Almaden Expy.
Roads and streets: Almandon Rd.
Guadalupe Canoas neighborhood detailed profile
Guadalupe Oak Grove neighborhood in San Jose statistics: (Find on map)
Area: 0.330 square miles
Population: 1,489
Population density:
Median household income in 2021:
Median rent in in 2021:
Male vs Females
Median age
Housing prices:
Average estimated value of detached houses in 2021 (82.0% of all units):
Average estimated value of townhouses or other attached units in 2021 (15.1% of all units):
Average estimated '21 value of housing units in 5-or-more-unit structures (0.5% of all units):
Most popular occupations of males: architecture and engineering occupations (17.3%); management occupations (except farmers) (13.2%); business and financial operations occupations (12.0%); sales and office occupations (10.2%); computer and mathematical occupations (8.8%); service occupations (8.0%); legal occupations (6.8%)
Most popular occupations of females: sales and office occupations (33.5%); management occupations (except farmers) (19.4%); business and financial operations occupations (14.0%); life, physical, and social science occupations (7.9%); education, training, and library occupations (6.9%); healthcare practitioners and technical occupations (4.6%); computer and mathematical occupations (3.8%)
Limited-access highways (interstate or state) in this neighborhood: Almaden Expy.
Roads and streets: Thorntree Dr; Porto Alegre Dr; Antigua Dr; Mc Abee Rd; Coleman Rd; Starwood Dr; Rhinecastle Way; Zinfandel Way; Sterling Oaks Dr; Vargas Dr; Recife Way; Pilar Ct; Ponce Ct; Strada Almaden; Vargas Ct; Sylvaner Way; Flaxwood St; Brasilia Way; Antigua Ct; Thorntree Pl; Starwood Pl; Cll Almaden; Porto Alegre Ct; Post Oak Cir; Porto Allegra Pl (Porto Alegre Pl); Thorntree Ct; Antigua Way; Ardsley Ct; Via Almaden; Starwood Ct; Rugby Ct.
Guadalupe Oak Grove neighborhood detailed profile
Area: 0.330 square miles
Population: 1,489
Population density:
| Guadalupe Oak Grove: | 4,519 people per square mile |
| San Jose: | 5,625 people per square mile |
Median household income in 2021:
| Guadalupe Oak Grove: | $188,424 |
| San Jose: | $126,377 |
Median rent in in 2021:
| Guadalupe Oak Grove: | $3,500 |
| San Jose: | $2,001 |
Male vs Females
| Males: | 756 |
| Females: | 733 |
Median age
| Males: | 48.5 years |
| Females: | 47.9 years |
Housing prices:
Average estimated value of detached houses in 2021 (82.0% of all units):
| Guadalupe Oak Grove: | $1,418,870 |
| San Jose: | $1,403,256 |
Average estimated value of townhouses or other attached units in 2021 (15.1% of all units):
| This neighborhood: | $1,227,616 |
| city: | $892,629 |
Average estimated '21 value of housing units in 5-or-more-unit structures (0.5% of all units):
| Guadalupe Oak Grove: | $593,216 |
| San Jose: | $688,625 |
Most popular occupations of males: architecture and engineering occupations (17.3%); management occupations (except farmers) (13.2%); business and financial operations occupations (12.0%); sales and office occupations (10.2%); computer and mathematical occupations (8.8%); service occupations (8.0%); legal occupations (6.8%)
Most popular occupations of females: sales and office occupations (33.5%); management occupations (except farmers) (19.4%); business and financial operations occupations (14.0%); life, physical, and social science occupations (7.9%); education, training, and library occupations (6.9%); healthcare practitioners and technical occupations (4.6%); computer and mathematical occupations (3.8%)
Limited-access highways (interstate or state) in this neighborhood: Almaden Expy.
Roads and streets: Thorntree Dr; Porto Alegre Dr; Antigua Dr; Mc Abee Rd; Coleman Rd; Starwood Dr; Rhinecastle Way; Zinfandel Way; Sterling Oaks Dr; Vargas Dr; Recife Way; Pilar Ct; Ponce Ct; Strada Almaden; Vargas Ct; Sylvaner Way; Flaxwood St; Brasilia Way; Antigua Ct; Thorntree Pl; Starwood Pl; Cll Almaden; Porto Alegre Ct; Post Oak Cir; Porto Allegra Pl (Porto Alegre Pl); Thorntree Ct; Antigua Way; Ardsley Ct; Via Almaden; Starwood Ct; Rugby Ct.
Guadalupe Oak Grove neighborhood detailed profile
Hamann Park neighborhood in San Jose statistics: (Find on map)
Area: 0.264 square miles
Population: 1,081
Population density:
Median household income in 2021:
Median rent in in 2021:
Male vs Females
Median age
Housing prices:
Average estimated value of detached houses in 2021 (82.4% of all units):
Average estimated '21 value of housing units in 5-or-more-unit structures (26.2% of all units):
Most popular occupations of males: management occupations (except farmers) (25.1%); computer and mathematical occupations (14.4%); architecture and engineering occupations (11.7%); sales and office occupations (11.3%); business and financial operations occupations (10.0%); service occupations (8.2%); healthcare practitioners and technical occupations (7.7%)
Most popular occupations of females: sales and office occupations (49.1%); business and financial operations occupations (16.3%); management occupations (except farmers) (6.9%); life, physical, and social science occupations (6.2%); service occupations (5.4%); education, training, and library occupations (4.9%); community and social services occupations (4.8%)
Roads and streets: S Genevieve Ln; S Daniel Way; Williams Rd; Neal Ave; S Monroe St; S Baywood Ave; S Clover Ave; Fruitdale Ave; Moorpark Ave; Clifton Ave; Ori Ave; Huff Ave; Westfield Ave.
Hamann Park neighborhood detailed profile
Area: 0.264 square miles
Population: 1,081
Population density:
| Hamann Park: | 4,098 people per square mile |
| San Jose: | 5,625 people per square mile |
Median household income in 2021:
| Hamann Park: | $156,242 |
| San Jose: | $126,377 |
Median rent in in 2021:
| Hamann Park: | $2,685 |
| San Jose: | $2,001 |
Male vs Females
| Males: | 552 |
| Females: | 528 |
Median age
| Males: | 38.7 years |
| Females: | 35.2 years |
Housing prices:
Average estimated value of detached houses in 2021 (82.4% of all units):
| Hamann Park: | $1,330,313 |
| San Jose: | $1,403,256 |
Average estimated '21 value of housing units in 5-or-more-unit structures (26.2% of all units):
| Hamann Park: | $647,734 |
| San Jose: | $688,625 |
Most popular occupations of males: management occupations (except farmers) (25.1%); computer and mathematical occupations (14.4%); architecture and engineering occupations (11.7%); sales and office occupations (11.3%); business and financial operations occupations (10.0%); service occupations (8.2%); healthcare practitioners and technical occupations (7.7%)
Most popular occupations of females: sales and office occupations (49.1%); business and financial operations occupations (16.3%); management occupations (except farmers) (6.9%); life, physical, and social science occupations (6.2%); service occupations (5.4%); education, training, and library occupations (4.9%); community and social services occupations (4.8%)
Roads and streets: S Genevieve Ln; S Daniel Way; Williams Rd; Neal Ave; S Monroe St; S Baywood Ave; S Clover Ave; Fruitdale Ave; Moorpark Ave; Clifton Ave; Ori Ave; Huff Ave; Westfield Ave.
Hamann Park neighborhood detailed profile
Hammer neighborhood in San Jose statistics: (Find on map)
Area: 0.142 square miles
Population: 1,462
Population density:
Median household income in 2021:
Median rent in in 2021:
Male vs Females
Median age
Housing prices:
Average estimated value of detached houses in 2021 (31.7% of all units):
Average estimated value of townhouses or other attached units in 2021 (19.3% of all units):
Average estimated '21 value of housing units in 3-to-4-unit structures (43.5% of all units):
Average estimated '21 value of housing units in 5-or-more-unit structures (3.2% of all units):
Most popular occupations of males: management occupations (except farmers) (17.5%); computer and mathematical occupations (13.7%); construction, extraction, and maintenance occupations (10.6%); architecture and engineering occupations (9.6%); business and financial operations occupations (8.1%); arts, design, entertainment, sports, and media occupations (7.0%); education, training, and library occupations (6.4%)
Most popular occupations of females: education, training, and library occupations (14.5%); management occupations (except farmers) (13.6%); sales and office occupations (13.3%); construction, extraction, and maintenance occupations (13.1%); service occupations (12.2%); material moving occupations (11.2%); business and financial operations occupations (10.9%)
Roads and streets: Corbin Ave; Wayland Ave; Trenary Way; Tifton Way; Bouret Dr; Cherry Ave; Capay Dr; Shawn Dr; Lansing Ave; Scossa Ave; Russo Dr; Joplin Dr; Cosmo Pl; Capay Ct.
Hammer neighborhood detailed profile
Area: 0.142 square miles
Population: 1,462
Population density:
| Hammer: | 10,286 people per square mile |
| San Jose: | 5,625 people per square mile |
Median household income in 2021:
| Hammer: | $128,963 |
| San Jose: | $126,377 |
Median rent in in 2021:
| Hammer: | $2,015 |
| San Jose: | $2,001 |
Male vs Females
| Males: | 673 |
| Females: | 788 |
Median age
| Males: | 40.1 years |
| Females: | 42.9 years |
Housing prices:
Average estimated value of detached houses in 2021 (31.7% of all units):
| Hammer: | $1,226,657 |
| San Jose: | $1,403,256 |
Average estimated value of townhouses or other attached units in 2021 (19.3% of all units):
| This neighborhood: | $717,886 |
| city: | $892,629 |
Average estimated '21 value of housing units in 3-to-4-unit structures (43.5% of all units):
| Hammer: | $154,400 |
| city: | $680,453 |
Average estimated '21 value of housing units in 5-or-more-unit structures (3.2% of all units):
| Hammer: | $633,871 |
| San Jose: | $688,625 |
Most popular occupations of males: management occupations (except farmers) (17.5%); computer and mathematical occupations (13.7%); construction, extraction, and maintenance occupations (10.6%); architecture and engineering occupations (9.6%); business and financial operations occupations (8.1%); arts, design, entertainment, sports, and media occupations (7.0%); education, training, and library occupations (6.4%)
Most popular occupations of females: education, training, and library occupations (14.5%); management occupations (except farmers) (13.6%); sales and office occupations (13.3%); construction, extraction, and maintenance occupations (13.1%); service occupations (12.2%); material moving occupations (11.2%); business and financial operations occupations (10.9%)
Roads and streets: Corbin Ave; Wayland Ave; Trenary Way; Tifton Way; Bouret Dr; Cherry Ave; Capay Dr; Shawn Dr; Lansing Ave; Scossa Ave; Russo Dr; Joplin Dr; Cosmo Pl; Capay Ct.
Hammer neighborhood detailed profile
Hannah neighborhood in San Jose statistics: (Find on map)
Area: 0.011 square miles
Population: 54
Population density:
Median household income in 2021:
Median rent in in 2021:
Male vs Females
Median age
Most popular occupations of males: management occupations (except farmers) (41.0%); computer and mathematical occupations (20.3%); architecture and engineering occupations (12.8%); business and financial operations occupations (10.3%); service occupations (9.0%); sales and office occupations (7.1%); education, training, and library occupations (6.1%)
Most popular occupations of females: computer and mathematical occupations (25.9%); education, training, and library occupations (14.1%); business and financial operations occupations (12.5%); management occupations (except farmers) (12.2%); service occupations (12.2%); sales and office occupations (12.2%); production occupations (10.6%)
Roads and streets: Hannah St; West Virginia St.
Hannah neighborhood detailed profile
Area: 0.011 square miles
Population: 54
Population density:
| Hannah (Gregory): | 4,952 people per square mile |
| San Jose: | 5,625 people per square mile |
Median household income in 2021:
| Hannah (Gregory): | $129,583 |
| San Jose: | $126,377 |
Median rent in in 2021:
| Hannah (Gregory): | $2,898 |
| San Jose: | $2,001 |
Male vs Females
| Males: | 29 |
| Females: | 25 |
Median age
| Males: | 37.6 years |
| Females: | 37.3 years |
Most popular occupations of males: management occupations (except farmers) (41.0%); computer and mathematical occupations (20.3%); architecture and engineering occupations (12.8%); business and financial operations occupations (10.3%); service occupations (9.0%); sales and office occupations (7.1%); education, training, and library occupations (6.1%)
Most popular occupations of females: computer and mathematical occupations (25.9%); education, training, and library occupations (14.1%); business and financial operations occupations (12.5%); management occupations (except farmers) (12.2%); service occupations (12.2%); sales and office occupations (12.2%); production occupations (10.6%)
Roads and streets: Hannah St; West Virginia St.
Hannah neighborhood detailed profile
Hathaway neighborhood in San Jose statistics: (Find on map)
Area: 0.220 square miles
Population: 1,463
Population density:
Median household income in 2021:
Median rent in in 2021:
Male vs Females
Median age
Average estimated value of detached houses in 2021 (49.4% of all units):
Most popular occupations of males: sales and office occupations (17.0%); service occupations (12.2%); architecture and engineering occupations (11.1%); computer and mathematical occupations (10.6%); management occupations (except farmers) (9.1%); construction, extraction, and maintenance occupations (7.6%); business and financial operations occupations (7.3%)
Most popular occupations of females: sales and office occupations (20.1%); service occupations (17.9%); education, training, and library occupations (15.2%); management occupations (except farmers) (13.3%); business and financial operations occupations (11.7%); production occupations (4.4%); healthcare practitioners and technical occupations (4.3%)
Roads and streets: Vallejo Dr; Hamilton Ave; San Tomas Aquino Rd; Colombo Dr; Latimer Ave; Lamore Dr; McKinnon Dr; Garrans Dr; Hilton Ave; Parkview Ave; Southwood Dr; Los Olivos Dr; Los Felice Dr; Los Alamos Dr; Parkwest Dr; Bayne Pl; Bongate Ct; Sunland Ct; McKinnon Ct; Hilton Ct.
Hathaway neighborhood detailed profile
Area: 0.220 square miles
Population: 1,463
Population density:
| Hathaway: | 6,660 people per square mile |
| San Jose: | 5,625 people per square mile |
Median household income in 2021:
| Hathaway: | $118,804 |
| San Jose: | $126,377 |
Median rent in in 2021:
| Hathaway: | $1,868 |
| San Jose: | $2,001 |
Male vs Females
| Males: | 710 |
| Females: | 753 |
Median age
| Males: | 41.9 years |
| Females: | 37.1 years |
Average estimated value of detached houses in 2021 (49.4% of all units):
| Hathaway: | $1,700,268 |
| San Jose: | $1,403,256 |
Most popular occupations of males: sales and office occupations (17.0%); service occupations (12.2%); architecture and engineering occupations (11.1%); computer and mathematical occupations (10.6%); management occupations (except farmers) (9.1%); construction, extraction, and maintenance occupations (7.6%); business and financial operations occupations (7.3%)
Most popular occupations of females: sales and office occupations (20.1%); service occupations (17.9%); education, training, and library occupations (15.2%); management occupations (except farmers) (13.3%); business and financial operations occupations (11.7%); production occupations (4.4%); healthcare practitioners and technical occupations (4.3%)
Roads and streets: Vallejo Dr; Hamilton Ave; San Tomas Aquino Rd; Colombo Dr; Latimer Ave; Lamore Dr; McKinnon Dr; Garrans Dr; Hilton Ave; Parkview Ave; Southwood Dr; Los Olivos Dr; Los Felice Dr; Los Alamos Dr; Parkwest Dr; Bayne Pl; Bongate Ct; Sunland Ct; McKinnon Ct; Hilton Ct.
Hathaway neighborhood detailed profile
Hayes neighborhood in San Jose statistics: (Find on map)
Area: 0.316 square miles
Population: 2,617
Population density:
Median household income in 2021:
Median rent in in 2021:
Male vs Females
Median age
Housing prices:
Average estimated value of detached houses in 2021 (67.0% of all units):
Average estimated value of townhouses or other attached units in 2021 (25.4% of all units):
Average estimated '21 value of housing units in 3-to-4-unit structures (6.5% of all units):
Average estimated '21 value of housing units in 5-or-more-unit structures (2.6% of all units):
Average estimated value of mobile home in 2021 (48.6% of all units):
Most popular occupations of males: business and financial operations occupations (19.1%); management occupations (except farmers) (17.1%); computer and mathematical occupations (12.8%); sales and office occupations (9.4%); transportation occupations (8.9%); production occupations (8.4%); healthcare practitioners and technical occupations (6.7%)
Most popular occupations of females: sales and office occupations (33.1%); management occupations (except farmers) (17.4%); computer and mathematical occupations (15.6%); life, physical, and social science occupations (9.0%); business and financial operations occupations (7.6%); service occupations (5.9%); material moving occupations (3.4%)
Roads and streets: Poston Dr; Edenvale Ave; Chynoweth Ave; Rue Calais; War Wagon Dr; Eagle Rock Rd; Branham Ln; Weepinggate Ln; Rue Cannes; Grey Feather Cir; Derek Dr; Rue Loiret; Cedargate Ln; Rooster Dr; Rue Bordeaux; Saddle Brook Rd; Rio Lobo Dr; Olivegate Ln; Rue Le Mans; Rio Grande Dr; Broken Arrow Dr; Red River Way; Flat Rock Cir; Sutter Creek Cir; Tiffin Dr; Pony Pass Cir; Red Creek Dr; Obert Dr; Indian River Dr; Destry Ct; Rue Lyon; Rue Boulogne; Canmore Ct; Baralay Pl; War Wagon Ct; Rue Tours Ct; Rue Orleans Ct; Rue Nice Ct; Ivygate Ln; Little Bear Way; Indian River Ct; Path Way; Bear Claw Way; Rooster Ct; Sigrid Way; Rue Toulon Ct; Rue Lyon Ct; Scout Ct; Marjohn Blvd.
Hayes neighborhood detailed profile
Area: 0.316 square miles
Population: 2,617
Population density:
| Hayes: | 8,280 people per square mile |
| San Jose: | 5,625 people per square mile |
Median household income in 2021:
| Hayes: | $110,045 |
| San Jose: | $126,377 |
Median rent in in 2021:
| Hayes: | $3,191 |
| San Jose: | $2,001 |
Male vs Females
| Males: | 1,327 |
| Females: | 1,290 |
Median age
| Males: | 40.2 years |
| Females: | 37.9 years |
Housing prices:
Average estimated value of detached houses in 2021 (67.0% of all units):
| Hayes: | $859,566 |
| San Jose: | $1,403,256 |
Average estimated value of townhouses or other attached units in 2021 (25.4% of all units):
| This neighborhood: | $920,793 |
| city: | $892,629 |
Average estimated '21 value of housing units in 3-to-4-unit structures (6.5% of all units):
| Hayes: | $373,134 |
| city: | $680,453 |
Average estimated '21 value of housing units in 5-or-more-unit structures (2.6% of all units):
| Hayes: | $231,354 |
| San Jose: | $688,625 |
Average estimated value of mobile home in 2021 (48.6% of all units):
| Hayes: | $153,720 |
| San Jose: | $240,963 |
Most popular occupations of males: business and financial operations occupations (19.1%); management occupations (except farmers) (17.1%); computer and mathematical occupations (12.8%); sales and office occupations (9.4%); transportation occupations (8.9%); production occupations (8.4%); healthcare practitioners and technical occupations (6.7%)
Most popular occupations of females: sales and office occupations (33.1%); management occupations (except farmers) (17.4%); computer and mathematical occupations (15.6%); life, physical, and social science occupations (9.0%); business and financial operations occupations (7.6%); service occupations (5.9%); material moving occupations (3.4%)
Roads and streets: Poston Dr; Edenvale Ave; Chynoweth Ave; Rue Calais; War Wagon Dr; Eagle Rock Rd; Branham Ln; Weepinggate Ln; Rue Cannes; Grey Feather Cir; Derek Dr; Rue Loiret; Cedargate Ln; Rooster Dr; Rue Bordeaux; Saddle Brook Rd; Rio Lobo Dr; Olivegate Ln; Rue Le Mans; Rio Grande Dr; Broken Arrow Dr; Red River Way; Flat Rock Cir; Sutter Creek Cir; Tiffin Dr; Pony Pass Cir; Red Creek Dr; Obert Dr; Indian River Dr; Destry Ct; Rue Lyon; Rue Boulogne; Canmore Ct; Baralay Pl; War Wagon Ct; Rue Tours Ct; Rue Orleans Ct; Rue Nice Ct; Ivygate Ln; Little Bear Way; Indian River Ct; Path Way; Bear Claw Way; Rooster Ct; Sigrid Way; Rue Toulon Ct; Rue Lyon Ct; Scout Ct; Marjohn Blvd.
Hayes neighborhood detailed profile
Hellyer neighborhood in San Jose statistics: (Find on map)
Area: 0.175 square miles
Population: 1,404
Population density:
Median household income in 2021:
Median rent in in 2021:
Male vs Females
Median age
Most popular occupations of males: sales and office occupations (34.8%); service occupations (15.3%); management occupations (except farmers) (12.9%); material moving occupations (10.4%); construction, extraction, and maintenance occupations (5.7%); architecture and engineering occupations (4.2%); production occupations (4.2%)
Most popular occupations of females: service occupations (35.6%); sales and office occupations (18.3%); production occupations (11.0%); management occupations (except farmers) (9.4%); healthcare practitioners and technical occupations (9.1%); business and financial operations occupations (5.7%); community and social services occupations (2.9%)
Roads and streets: Sylvandale Ave; Ambler Way; Faris Dr; Burman Dr; Park Johnson Pl; Jana Ln; Brock Way; Nash Ct; Leyte Ct; Masters Ct; Chilton Ct; Palisade Dr; Ambler Ct; Oahu Dr; Ashton Ln; Park Charles Ct; Honolulu Ct; Maui Ct; Trimar Ct; Ashton Ct; Maui Dr.
Hellyer neighborhood detailed profile
Area: 0.175 square miles
Population: 1,404
Population density:
| Hellyer: | 8,038 people per square mile |
| San Jose: | 5,625 people per square mile |
Median household income in 2021:
| Hellyer: | $106,348 |
| San Jose: | $126,377 |
Median rent in in 2021:
| Hellyer: | $2,511 |
| San Jose: | $2,001 |
Male vs Females
| Males: | 748 |
| Females: | 655 |
Median age
| Males: | 35.9 years |
| Females: | 39.8 years |
Most popular occupations of males: sales and office occupations (34.8%); service occupations (15.3%); management occupations (except farmers) (12.9%); material moving occupations (10.4%); construction, extraction, and maintenance occupations (5.7%); architecture and engineering occupations (4.2%); production occupations (4.2%)
Most popular occupations of females: service occupations (35.6%); sales and office occupations (18.3%); production occupations (11.0%); management occupations (except farmers) (9.4%); healthcare practitioners and technical occupations (9.1%); business and financial operations occupations (5.7%); community and social services occupations (2.9%)
Roads and streets: Sylvandale Ave; Ambler Way; Faris Dr; Burman Dr; Park Johnson Pl; Jana Ln; Brock Way; Nash Ct; Leyte Ct; Masters Ct; Chilton Ct; Palisade Dr; Ambler Ct; Oahu Dr; Ashton Ln; Park Charles Ct; Honolulu Ct; Maui Ct; Trimar Ct; Ashton Ct; Maui Dr.
Hellyer neighborhood detailed profile
Hensley neighborhood in San Jose statistics: (Find on map)
Area: 0.108 square miles
Population: 1,865
Population density:
Median household income in 2021:
Median rent in in 2021:
Male vs Females
Median age
Average estimated value of detached houses in 2021 (3.8% of all units):
Most popular occupations of males: management occupations (except farmers) (19.7%); education, training, and library occupations (19.7%); construction, extraction, and maintenance occupations (17.6%); computer and mathematical occupations (15.4%); architecture and engineering occupations (12.9%); sales and office occupations (12.5%); service occupations (1.6%)
Most popular occupations of females: sales and office occupations (43.8%); business and financial operations occupations (20.2%); computer and mathematical occupations (17.1%); healthcare practitioners and technical occupations (15.7%); management occupations (except farmers) (9.3%); service occupations (9.0%); material moving occupations (3.0%)
Roads and streets: N 5th St; N 3rd St; N 4th St; E Julian St; N 6th St; Washington St; Hensley St; N 2nd St.
Railroad features: Union Pacific RR.
Hensley neighborhood detailed profile
Area: 0.108 square miles
Population: 1,865
Population density:
| Hensley: | 17,280 people per square mile |
| San Jose: | 5,625 people per square mile |
Median household income in 2021:
| Hensley: | $57,467 |
| San Jose: | $126,377 |
Median rent in in 2021:
| Hensley: | $1,752 |
| San Jose: | $2,001 |
Male vs Females
| Males: | 1,156 |
| Females: | 708 |
Median age
| Males: | 25.3 years |
| Females: | 22.2 years |
Average estimated value of detached houses in 2021 (3.8% of all units):
| Hensley: | $862,222 |
| San Jose: | $1,403,256 |
Most popular occupations of males: management occupations (except farmers) (19.7%); education, training, and library occupations (19.7%); construction, extraction, and maintenance occupations (17.6%); computer and mathematical occupations (15.4%); architecture and engineering occupations (12.9%); sales and office occupations (12.5%); service occupations (1.6%)
Most popular occupations of females: sales and office occupations (43.8%); business and financial operations occupations (20.2%); computer and mathematical occupations (17.1%); healthcare practitioners and technical occupations (15.7%); management occupations (except farmers) (9.3%); service occupations (9.0%); material moving occupations (3.0%)
Roads and streets: N 5th St; N 3rd St; N 4th St; E Julian St; N 6th St; Washington St; Hensley St; N 2nd St.
Railroad features: Union Pacific RR.
Hensley neighborhood detailed profile
Heritage neighborhood in San Jose statistics: (Find on map)
Area: 0.626 square miles
Population: 4,718
Population density:
Median household income in 2021:
Median rent in in 2021:
Male vs Females
Median age
Housing prices:
Average estimated value of detached houses in 2021 (91.7% of all units):
Average estimated value of townhouses or other attached units in 2021 (12.0% of all units):
Most popular occupations of males: architecture and engineering occupations (16.1%); sales and office occupations (15.6%); computer and mathematical occupations (12.0%); service occupations (10.4%); production occupations (8.2%); business and financial operations occupations (8.1%); construction, extraction, and maintenance occupations (8.0%)
Most popular occupations of females: sales and office occupations (22.2%); service occupations (16.9%); healthcare practitioners and technical occupations (16.0%); education, training, and library occupations (11.0%); production occupations (9.5%); management occupations (except farmers) (6.4%); computer and mathematical occupations (6.2%)
Roads and streets: Quimby Rd; Ruby Ave; Stevens Ln; D'Amico Dr; Remington Way; Whitesand Dr; Oakgate Way; Yancy Dr; Millbrook Dr; Croft Dr; Apperson Ridge Dr; White Acres Dr; Lynview Dr; Bradshaw Dr; Teddington Dr; Corby Dr; Vintage Crest Dr; Whiteleaf Way; Janelle Dr; Heritage Valley Dr; Pavan Dr; Edenbank Dr; Tenley Dr; Heritage Estates Ct; Tolliver Dr; Whiterose Dr; Heritage Estates Dr; Stutz Way; Aborn Rd; Sebastian Bore Dr; Pinegate Way; Whittington Dr; Haughton Dr; Heritage Oaks Dr; Vintage Hills Ct (Corbal Ct); Glen Alto Ct; Mount Oso Dr; Heritage Springs Ct; Arcola Ct; Pendleton Dr; Vintage Oaks Ct; Mount Isabel Dr; Lusard Dr; Mount Isabel Ct; Chillum Ct; Perivale Ct; Linkshead Ct; Albermar Ct; Castleton Dr; Schooner Ct; Sprucegate Ct; Whitby Ct; Bouveron Ct; Whiteleaf Ct; Whitesand Ct; Remington Ct; Whiterose Ct; Pitner Ct; Fallen Oak Ct; Edenbank Ct; Elm Gate Ct; Greenford Ct; Apperson Ridge Ct; Whispering Elm Ct; Gatelight Ct; Thousand Pines Ct; Fieldgate Ct; Lamond Ct; D Amico Dr; Heritage Point Ct; Heritage Oaks Ct; Gateland Ct; Sulphur Spring Ct; Humberside Ct; Stevens Ct; Malton Ct; Horwedel Dr; Heritage Valley Ct; Scotch Heather Ct; Swindon Ct; Silbury Ct; Carol Leaf Ct; Cord Ct; Dayo Ct; Pavan Ct; Dunwich Ct.
Other features: Quimby Crk.
Heritage neighborhood detailed profile
Area: 0.626 square miles
Population: 4,718
Population density:
| Heritage: | 7,533 people per square mile |
| San Jose: | 5,625 people per square mile |
Median household income in 2021:
| Heritage: | $149,604 |
| San Jose: | $126,377 |
Median rent in in 2021:
| Heritage: | $1,997 |
| San Jose: | $2,001 |
Male vs Females
| Males: | 2,393 |
| Females: | 2,324 |
Median age
| Males: | 39.0 years |
| Females: | 40.9 years |
Housing prices:
Average estimated value of detached houses in 2021 (91.7% of all units):
| Heritage: | $888,949 |
| San Jose: | $1,403,256 |
Average estimated value of townhouses or other attached units in 2021 (12.0% of all units):
| This neighborhood: | $799,732 |
| city: | $892,629 |
Most popular occupations of males: architecture and engineering occupations (16.1%); sales and office occupations (15.6%); computer and mathematical occupations (12.0%); service occupations (10.4%); production occupations (8.2%); business and financial operations occupations (8.1%); construction, extraction, and maintenance occupations (8.0%)
Most popular occupations of females: sales and office occupations (22.2%); service occupations (16.9%); healthcare practitioners and technical occupations (16.0%); education, training, and library occupations (11.0%); production occupations (9.5%); management occupations (except farmers) (6.4%); computer and mathematical occupations (6.2%)
Roads and streets: Quimby Rd; Ruby Ave; Stevens Ln; D'Amico Dr; Remington Way; Whitesand Dr; Oakgate Way; Yancy Dr; Millbrook Dr; Croft Dr; Apperson Ridge Dr; White Acres Dr; Lynview Dr; Bradshaw Dr; Teddington Dr; Corby Dr; Vintage Crest Dr; Whiteleaf Way; Janelle Dr; Heritage Valley Dr; Pavan Dr; Edenbank Dr; Tenley Dr; Heritage Estates Ct; Tolliver Dr; Whiterose Dr; Heritage Estates Dr; Stutz Way; Aborn Rd; Sebastian Bore Dr; Pinegate Way; Whittington Dr; Haughton Dr; Heritage Oaks Dr; Vintage Hills Ct (Corbal Ct); Glen Alto Ct; Mount Oso Dr; Heritage Springs Ct; Arcola Ct; Pendleton Dr; Vintage Oaks Ct; Mount Isabel Dr; Lusard Dr; Mount Isabel Ct; Chillum Ct; Perivale Ct; Linkshead Ct; Albermar Ct; Castleton Dr; Schooner Ct; Sprucegate Ct; Whitby Ct; Bouveron Ct; Whiteleaf Ct; Whitesand Ct; Remington Ct; Whiterose Ct; Pitner Ct; Fallen Oak Ct; Edenbank Ct; Elm Gate Ct; Greenford Ct; Apperson Ridge Ct; Whispering Elm Ct; Gatelight Ct; Thousand Pines Ct; Fieldgate Ct; Lamond Ct; D Amico Dr; Heritage Point Ct; Heritage Oaks Ct; Gateland Ct; Sulphur Spring Ct; Humberside Ct; Stevens Ct; Malton Ct; Horwedel Dr; Heritage Valley Ct; Scotch Heather Ct; Swindon Ct; Silbury Ct; Carol Leaf Ct; Cord Ct; Dayo Ct; Pavan Ct; Dunwich Ct.
Other features: Quimby Crk.
Heritage neighborhood detailed profile
Hermes neighborhood in San Jose statistics: (Find on map)
Area: 0.003 square miles
Population: 30
Population density:
Median household income in 2021:
Median rent in in 2021:
Male vs Females
Median age
Most popular occupations of males: production occupations (24.8%); service occupations (11.6%); architecture and engineering occupations (10.1%); construction, extraction, and maintenance occupations (10.0%); transportation occupations (6.6%); education, training, and library occupations (5.5%); healthcare practitioners and technical occupations (4.9%)
Most popular occupations of females: service occupations (32.7%); sales and office occupations (21.6%); production occupations (13.8%); healthcare practitioners and technical occupations (8.8%); management occupations (except farmers) (7.8%); education, training, and library occupations (5.0%); life, physical, and social science occupations (3.5%)
Hermes neighborhood detailed profile
Area: 0.003 square miles
Population: 30
Population density:
| Hermes: | 9,346 people per square mile |
| San Jose: | 5,625 people per square mile |
Median household income in 2021:
| Hermes: | $81,020 |
| San Jose: | $126,377 |
Median rent in in 2021:
| Hermes: | $1,425 |
| San Jose: | $2,001 |
Male vs Females
| Males: | 15 |
| Females: | 15 |
Median age
| Males: | 36.6 years |
| Females: | 36.3 years |
Most popular occupations of males: production occupations (24.8%); service occupations (11.6%); architecture and engineering occupations (10.1%); construction, extraction, and maintenance occupations (10.0%); transportation occupations (6.6%); education, training, and library occupations (5.5%); healthcare practitioners and technical occupations (4.9%)
Most popular occupations of females: service occupations (32.7%); sales and office occupations (21.6%); production occupations (13.8%); healthcare practitioners and technical occupations (8.8%); management occupations (except farmers) (7.8%); education, training, and library occupations (5.0%); life, physical, and social science occupations (3.5%)
Hermes neighborhood detailed profile