Gilchrist neighborhood in San Jose, California (CA), 95133 detailed profile
Settings
X

Business Search - 14 Million verified businesses
Area: 0.062 square miles
Population: 657
Population density:
| Gilchrist: | 10,553 people per square mile |
| San Jose: | 5,554 people per square mile |

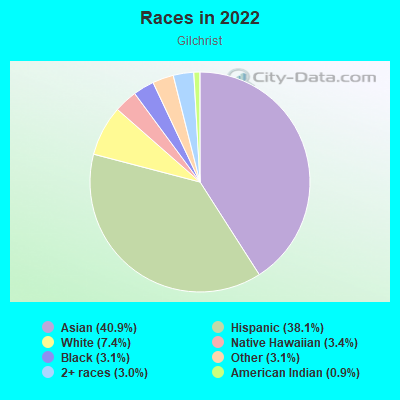
- 28640.9%Asian
- 26738.1%Hispanic or Latino
- 527.4%White
- 243.4%Native Hawaiian and Other
Pacific Islander - 223.1%Black
- 223.1%Some other race
- 213.0%Two or more races
- 60.9%American Indian
Distribution of median household income
![Distribution of median household income]()
- 15Less than $10,000
- 15$10,000 to $19,999
- 14$20,000 to $29,999
- 2$30,000 to $39,999
- 3$40,000 to $49,999
- 3$50,000 to $59,999
- 3$60,000 to $74,999
- 8$75,000 to $99,999
- 4$100,000 to $124,999
- 24$125,000 to $149,999
- 48$150,000 to $199,999
- 50$200,000 or more

Distribution of owner-occupied house/condo value
![Distribution of owner-occupied house/condo value]()
- 3Less than $50,000
- 7$50,000 to $99,999
- 2$100,000 to $149,999
- 3$150,000 to $199,999
- 3$200,000 to $249,999
- 3$250,000 to $299,999
- 5$300,000 to $399,999
- 3$400,000 to $499,999
- 5$500,000 to $749,999
- 12$750,000 to $999,999
- 95$1,000,000 or more

Distribution of rent paid by renters
![Distribution of rent paid by renters]()
- 6Less than $100
- 6$200 to $299
- 3$400 to $499
- 3$500 to $599
- 5$600 to $699
- 5$700 to $799
- 5$800 to $899
- 10$900 to $999
- 4$1,000 to $1,249
- 2$1,250 to $1,499
- 9$1,500 to $1,999
- 42$2,000 or more

Median rent in 2022:
| Gilchrist: | $3,448 |
| San Jose: | $2,001 |
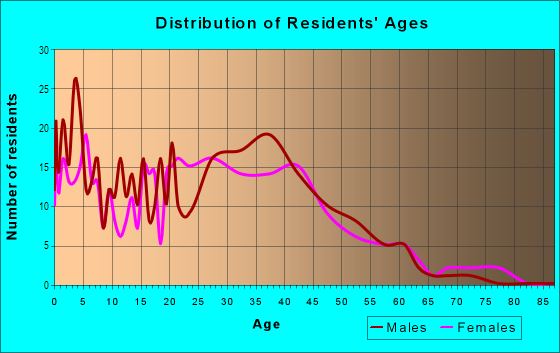
| Males: | 348 |
| Females: | 309 |
Males:
| This neighborhood: | 38.3 years |
| Whole city: | 37.6 years |
| This neighborhood: | 35.8 years |
| Whole city: | 39.1 years |
Average household size:
| Gilchrist: | 3.8 people |
| San Jose: | 2.9 people |
Percentage of family households:
| Gilchrist: | 70.5% |
| San Jose: | 49.9% |
| Here: | 78.8% |
| San Jose: | 53.0% |
Percentage of married-couple families with children (among all households):
| Gilchrist: | 14.7% |
| San Jose: | 25.8% |
Percentage of single-mother households (among all households):
| Gilchrist: | 1.5% |
| San Jose: | 5.2% |
Percentage of never married males 15 years old and over:
Percentage of never married females 15 years old and over:
| Gilchrist: | 12.7% |
| San Jose: | 20.9% |
Percentage of never married females 15 years old and over:
| Gilchrist: | 15.0% |
| city: | 16.7% |
Percentage of people that speak English not well or not at all:
| Gilchrist: | 21.9% |
| San Jose: | 11.4% |
Percentage of people born in this state:
Percentage of people born in another U.S. state:
Percentage of native residents but born outside the U.S.:
Percentage of foreign born residents:
| Here: | 33.7% |
| San Jose: | 46.1% |
Percentage of people born in another U.S. state:
| Gilchrist: | 7.8% |
| San Jose: | 10.4% |
Percentage of native residents but born outside the U.S.:
| Here: | 2.7% |
| city: | 1.7% |
Percentage of foreign born residents:
| Here: | 55.8% |
| San Jose: | 41.8% |
Owner-occupied
Renter-occupied

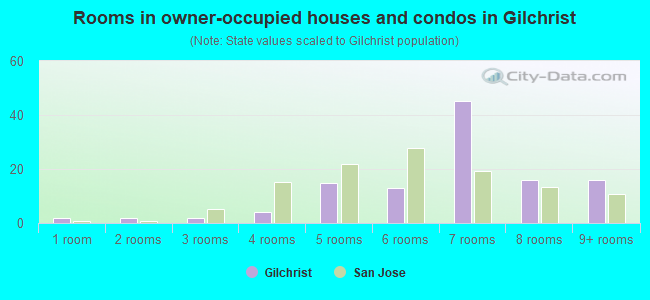
- Rooms in owner-occupied houses and condos in Gilchrist
- 21 room
- 22 rooms
- 23 rooms
- 44 rooms
- 155 rooms
- 136 rooms
- 457 rooms
- 168 rooms
- 169+ rooms
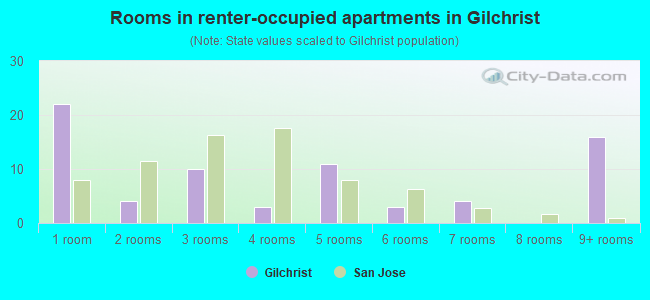
- Rooms in renter-occupied apartments in Gilchrist
- 221 room
- 42 rooms
- 103 rooms
- 34 rooms
- 115 rooms
- 36 rooms
- 47 rooms
- 08 rooms
- 169+ rooms
Owner-occupied
Renter-occupied
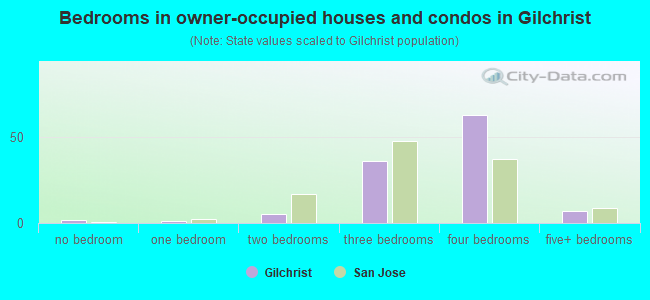
- Bedrooms in owner-occupied houses and condos in Gilchrist
- 2no bedroom
- 11 bedroom
- 52 bedrooms
- 363 bedrooms
- 634 bedrooms
- 75+ bedrooms
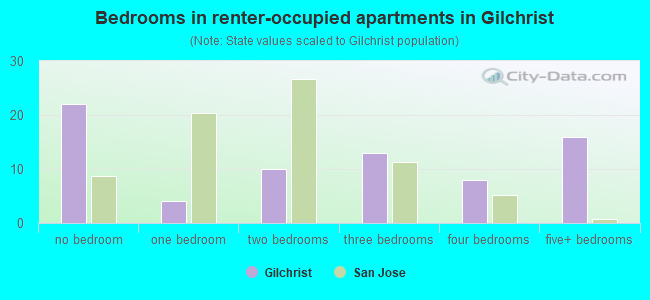
- Bedrooms in renter-occupied apartments in Gilchrist
- 22no bedroom
- 41 bedroom
- 102 bedrooms
- 133 bedrooms
- 84 bedrooms
- 165+ bedrooms
Average number of cars or other vehicles available in houses/condos:
Average number of cars or other vehicles available in apartments:
| This neighborhood: | 2.6 |
| San Jose: | 2.3 |
Average number of cars or other vehicles available in apartments:
| Here: | 4.6 |
| city: | 1.6 |
Percentage of units with a mortgage:
| Gilchrist: | 77.2% |
| San Jose: | 66.9% |
Housing prices:
- Average estimated value of detached houses in 2022 (95.0% of all units):
Gilchrist: $1,250,633 San Jose: $1,532,815
- Average estimated value of townhouses or other attached units in 2022 (2.1% of all units):
This neighborhood: $974,254 city: $1,024,857
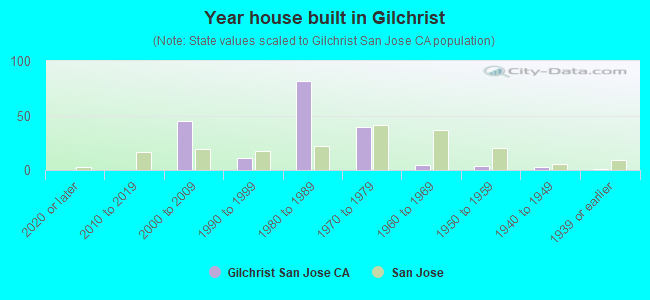
- Year house built in Gilchrist
- 02020 or later
- 02010 to 2019
- 452000 to 2009
- 111990 to 1999
- 821980 to 1989
- 391970 to 1979
- 51960 to 1969
- 41950 to 1959
- 31940 to 1949
- 11939 or earlier
City-data.com crime index for city in 2020 (higher means more crime):
| City: | 268.4 |
| U.S. average: | 219.5 |
Travel time to work (commute)
![Travel time to work (commute)]()
- 4Less than 5 minutes
- 95 to 9 minutes
- 1510 to 14 minutes
- 7315 to 19 minutes
- 5420 to 24 minutes
- 525 to 29 minutes
- 5530 to 34 minutes
- 335 to 39 minutes
- 1440 to 44 minutes
- 2245 to 59 minutes
- 1460 to 89 minutes
- 390 or more minutes

Means of transportation to work
![Means of transportation to work]()
- 73.5%222Drove a car alone
- 6.0%18Carpooled
- 0.3%1Bus
- 0.7%2Subway or elevated rail
- 0.3%1Long-distance train or commuter rail
- 0.3%1Light rail, streetcar or trolley
- 0.7%2Taxi
- 1.0%3Walked
- 0.3%1Other means
- 18.5%56Worked at home

Time leaving home to go to work
![Time leaving home to go to work]()
- 612:00 a.m. to 4:59 a.m.
- 55:00 a.m. to 5:29 a.m.
- 165:30 a.m. to 5:59 a.m.
- 166:00 a.m. to 6:29 a.m.
- 296:30 a.m. to 6:59 a.m.
- 277:00 a.m. to 7:29 a.m.
- 197:30 a.m. to 7:59 a.m.
- 348:00 a.m. to 8:29 a.m.
- 158:30 a.m. to 8:59 a.m.
- 229:00 a.m. to 9:59 a.m.
- 3610:00 a.m. to 10:59 a.m.
- 811:00 a.m. to 11:59 a.m.
- 3412:00 p.m. to 3:59 p.m.
- 64:00 p.m. to 11:59 p.m.

Occupations of males:
- Percentage of males in management occupations (except farmers):
Here: 11.0% city: 13.0%
- Percentage of males in business and financial operations occupations:
Here: 1.2% city: 4.6%
- Percentage of males in computer and mathematical occupations:
Here: 19.8% city: 13.6%
- Percentage of males in architecture and engineering occupations:
Here: 12.6% city: 10.2%
- Percentage of males in legal occupations:
Here: 1.1% city: 0.8%
- Percentage of males in education, training, and library occupations:
Here: 1.2% city: 2.8%
- Percentage of males in service occupations:
Here: 18.0% city: 12.7%
- Percentage of males in sales and office occupations:
Here: 4.3% city: 12.8%
- Percentage of males in construction, extraction, and maintenance occupations:
Here: 12.9% city: 7.8%
- Percentage of males in production occupations:
Here: 7.6% city: 5.5%
- Percentage of males in material moving occupations:
Here: 9.2% city: 3.1%
Occupations of females:
- Percentage of females in management occupations (except farmers):
Here: 8.0% city: 11.0%
- Percentage of females in business and financial operations occupations:
Here: 12.0% city: 8.6%
- Percentage of females in computer and mathematical occupations:
Here: 6.7% city: 5.4%
- Percentage of females in architecture and engineering occupations:
Here: 7.3% city: 2.8%
- Percentage of females in education, training, and library occupations:
Here: 7.2% city: 8.1%
- Percentage of females in healthcare practitioners and technical occupations:
Here: 4.5% city: 6.8%
- Percentage of females in service occupations:
Here: 11.3% city: 21.7%
- Percentage of females in sales and office occupations:
Here: 34.8% city: 22.0%
- Percentage of females in production occupations:
Here: 5.7% city: 4.0%
- Percentage of females in transportation occupations:
Here: 2.5% city: 0.7%
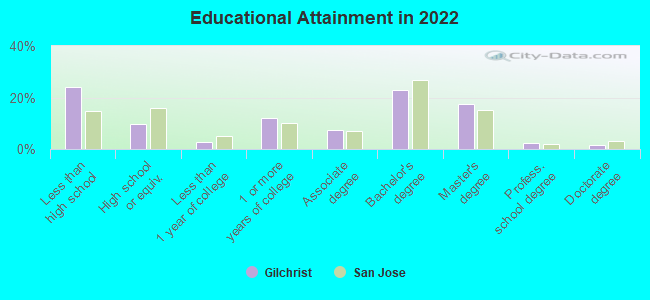
Education in this neighborhood (subdivision or community):
- Percentage of people 3 years and older in K-12 schools:
Gilchrist: 20.5% San Jose: 16.1%
- Percentage of people 3 years and older in undergraduate colleges:
Gilchrist: 5.6% San Jose: 6.5%
- Percentage of people 3 years and older in grad. or professional schools:
Gilchrist: 0.8% San Jose: 2.0%
- Percentage of students K-12 enrolled in private schools:
Gilchrist: 21.6% San Jose: 14.9%
Percentage of population below poverty level:
| Gilchrist: | 5.0% |
| San Jose: | 9.0% |
Median year owner moved in (as recorded in 2022):
Median year renter moved in (as recorded in 2022):
| Gilchrist: | 2008 |
| San Jose: | 2008 |
Median year renter moved in (as recorded in 2022):
| Gilchrist: | 2016 |
| San Jose: | 2020 |
Percentage of married-couple families with both working:
| Gilchrist: | 82.3% |
| San Jose: | 72.5% |
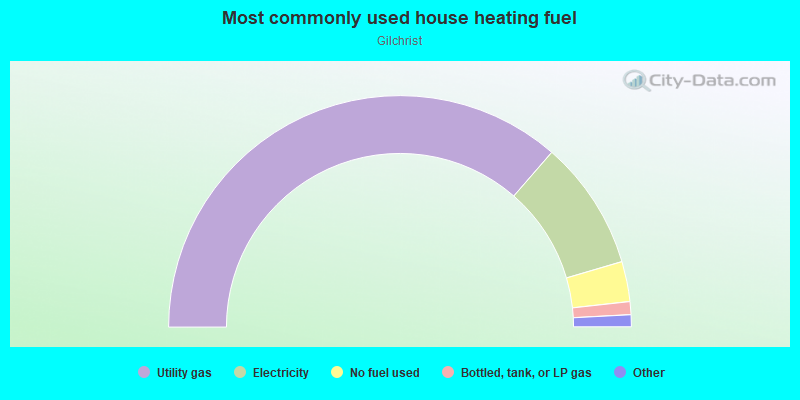
- 72.8%Utility gas
- 18.1%Electricity
- 5.6%No fuel used
- 1.8%Bottled, tank, or LP gas
- 0.8%Solar energy
- 0.8%Other fuel
Limited-access highways (interstate or state) in this neighborhood:
Roads and streets:
Las Palmas Way
Length: 0.36 miles
Directions: E-W, N-S, SE-NW, SW-NE
Address range: 800 to 2599
Directions: E-W, N-S, SE-NW, SW-NE
Address range: 800 to 2599
Gilchrist Dr
Length: 0.31 miles
Directions: E-W, N-S, SE-NW, SW-NE
Address range: 800 to 999
Directions: E-W, N-S, SE-NW, SW-NE
Address range: 800 to 999
N Capitol Ave
Length: 0.31 miles
Direction: SE-NW
Address range: 745 to 898
Direction: SE-NW
Address range: 745 to 898
Mabury Rd
Length: 0.23 miles
Direction: SW-NE
Direction: SW-NE
Gilchrist Walkway
Length: 0.22 miles
Direction: SE-NW
Address range: 800 to 999
Direction: SE-NW
Address range: 800 to 999
Wyman Way
Length: 0.18 miles
Directions: E-W, N-S, SE-NW, SW-NE
Address range: 800 to 899
Directions: E-W, N-S, SE-NW, SW-NE
Address range: 800 to 899
Williford Dr
Length: 0.12 miles
Directions: E-W, SW-NE
Directions: E-W, SW-NE
Golzio Ct
Length: 0.08 miles
Directions: E-W, SE-NW, SW-NE
Address range: 2400 to 2599
Directions: E-W, SE-NW, SW-NE
Address range: 2400 to 2599
Royal Palm Ct
Length: 0.05 miles
Direction: SE-NW
Address range: 800 to 899
Direction: SE-NW
Address range: 800 to 899
Palmetta Palm Ct
Length: 0.04 miles
Direction: SW-NE
Address range: 2500 to 2599
Direction: SW-NE
Address range: 2500 to 2599
Cane Palm Ct
Length: 0.04 miles
Direction: SE-NW
Address range: 801 to 899
Direction: SE-NW
Address range: 801 to 899
Sentry Palm Ct
Length: 0.03 miles
Directions: N-S, SE-NW
Address range: 800 to 899
Directions: N-S, SE-NW
Address range: 800 to 899
Dillion Ct
Length: 0.03 miles
Directions: E-W, SW-NE
Address range: 2500 to 2599
Directions: E-W, SW-NE
Address range: 2500 to 2599
Date Palm Ct
Length: 0.03 miles
Direction: SE-NW
Address range: 800 to 899
Direction: SE-NW
Address range: 800 to 899
Fan Palm Ct
Length: 0.03 miles
Direction: SE-NW
Address range: 800 to 899
Direction: SE-NW
Address range: 800 to 899
Bamboo Palm Ct
Length: 0.03 miles
Directions: E-W, N-S, SE-NW, SW-NE
Address range: 801 to 899
Directions: E-W, N-S, SE-NW, SW-NE
Address range: 801 to 899
King Palm Ct
Length: 0.02 miles
Direction: SE-NW
Address range: 800 to 899
Direction: SE-NW
Address range: 800 to 899
Fountain Palm Ct
Length: 0.02 miles
Direction: SE-NW
Address range: 800 to 899
Direction: SE-NW
Address range: 800 to 899
Windmill Palm Ct
Length: 0.02 miles
Direction: SE-NW
Address range: 800 to 849
Direction: SE-NW
Address range: 800 to 849
Island Palm Ct
Length: 0.02 miles
Direction: SW-NE
Address range: 2500 to 2599
Direction: SW-NE
Address range: 2500 to 2599
Lady Palm Ct
Length: 0.02 miles
Direction: SW-NE
Address range: 2500 to 2599
Direction: SW-NE
Address range: 2500 to 2599
Canary Palm Ct
Length: 0.02 miles
Direction: SW-NE
Address range: 2500 to 2581
Direction: SW-NE
Address range: 2500 to 2581