Estimated zip code population in 2022: 28,510 Zip code population in 2010: 25,401 Zip code population in 2000: 26,018
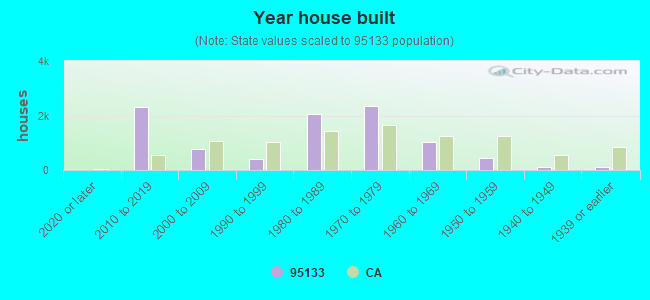
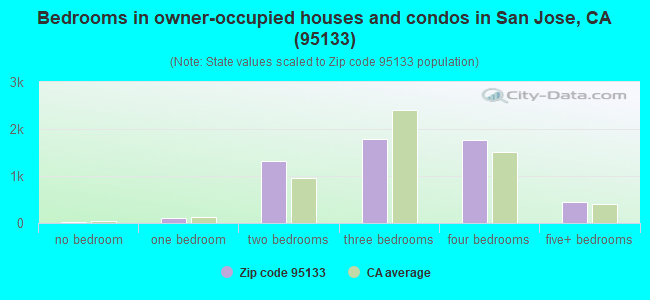
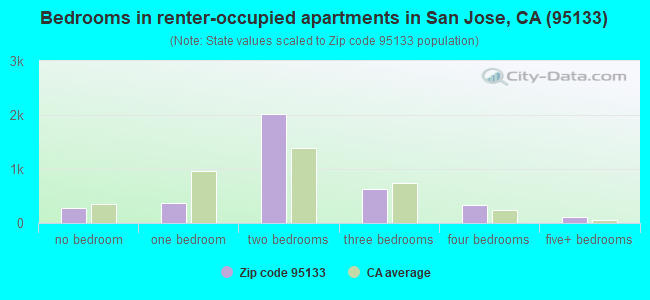
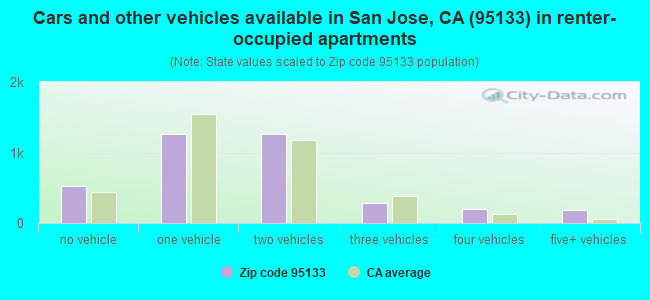
Houses and condos: 9,327 Renter-occupied apartments: 3,736
% of renters here:
41%
State:
44%
March 2022 cost of living index in zip code 95133: 121.9 (high, U.S. average is 100)
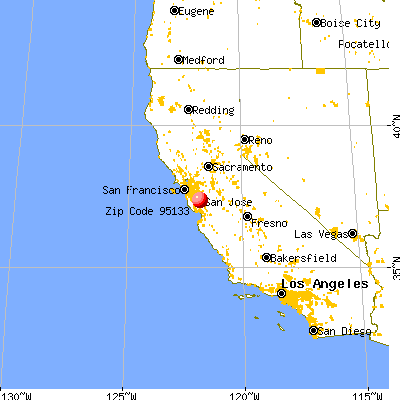
Land area: 3.2 sq. mi. Water area: 0.0 sq. mi.
Population density: 8,922 people per square mile
(high).
OSM Map
General Map
Google Map
MSN Map
OSM Map
General Map
Google Map
MSN Map
OSM Map
General Map
Google Map
MSN Map
OSM Map
General Map
Google Map
MSN Map
Please wait while loading the map...
Real estate property taxes paid for housing units in 2022:
This zip code:
0.8% ($8,650)
California:
0.7% ($4,831)
Median real estate property taxes paid for housing units with mortgages in 2022: $10,330 (0.9%) Median real estate property taxes paid for housing units with no mortgage in 2022: $6,231 (0.6%)
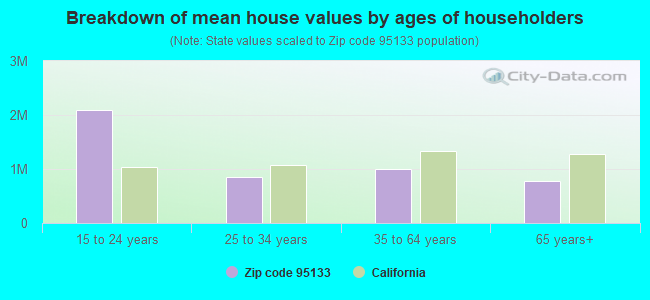
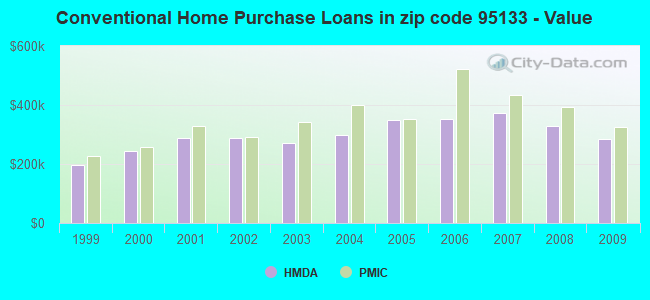
Estimated median house/condo value in 2022: $1,089,866
95133:
$1,089,866
California:
$715,900
According to our research of California and other state lists, there were 23 registered sex offenders living in 95133 zip code as of April 27, 2024. The ratio of all residents to sex offenders in zip code 95133 is 1,210 to 1. The ratio of registered sex offenders to all residents in this zip code is lower than the state average.
Median resident age:
This zip code:
38.0 years
California median age:
37.9 years
Average household size:
This zip code:
3.1 people
California:
2.8 people
Averages for the 2020 tax year for zip code 95133, filed in 2021:
Average Adjusted Gross Income (AGI) in 2020: $99,697 (Individual Income Tax Returns)
Here:
$99,697
State:
$95,910
Salary/wage: $94,081 (reported on 86.9% of returns)
Here:
$94,081
State:
$77,331
(% of AGI for various income ranges: 1211.1% for AGIs below $25k, 4144.2% for AGIs $25k-50k, 7643.8% for AGIs $50k-75k, 11323.1% for AGIs $75k-100k, 22311.3% for AGIs $100k-200k, 118464.6% for AGIs over 200k)
Taxable interest for individuals: $1,206 (reported on 37.0% of returns)
This zip code:
$1,206
California:
$2,294
(% of AGI for various income ranges: 19.3% for AGIs below $25k, 27.5% for AGIs $25k-50k, 32.1% for AGIs $50k-75k, 46.3% for AGIs $75k-100k, 115.2% for AGIs $100k-200k, 641.7% for AGIs over 200k)
Ordinary dividends: $3,306 (reported on 27.0% of returns)
Here:
$3,306
State:
$10,949
(% of AGI for various income ranges: 23.0% for AGIs below $25k, 23.2% for AGIs $25k-50k, 49.8% for AGIs $50k-75k, 79.7% for AGIs $75k-100k, 252.4% for AGIs $100k-200k, 1505.9% for AGIs over 200k)
Net capital gain/loss in AGI: +$22,147 (reported on 29.0% of returns)
Here:
+$22,147
State:
+$49,306
(% of AGI for various income ranges: 10.3% for AGIs below $25k, 55.7% for AGIs $25k-50k, 84.2% for AGIs $50k-75k, 166.8% for AGIs $75k-100k, 721.7% for AGIs $100k-200k, 17220.0% for AGIs over 200k)
Profit/loss from business: +$11,827 (reported on 12.8% of returns)
Here:
+$11,827
State:
+$15,671
(% of AGI for various income ranges: 152.8% for AGIs below $25k, 161.8% for AGIs $25k-50k, 147.4% for AGIs $50k-75k, 184.2% for AGIs $75k-100k, 378.0% for AGIs $100k-200k, 1312.6% for AGIs over 200k)
Taxable individual retirement arrangement distribution: $21,709 (reported on 4.5% of returns)
95133:
$21,709
California:
$23,505
(% of AGI for various income ranges: 35.6% for AGIs below $25k, 54.1% for AGIs $25k-50k, 84.2% for AGIs $50k-75k, 143.3% for AGIs $75k-100k, 327.3% for AGIs $100k-200k, 1125.4% for AGIs over 200k)
Self-employed (Keogh) retirement plans: $24,580 (reported on 0.3% of returns)
95133:
$24,580
California:
$30,163
(% of AGI for various income ranges: 52.2% for AGIs $75k-100k, 161.7% for AGIs over 200k)
Total itemized deductions: $30,821 (reported on 16.7% of returns)
Here:
$30,821
State:
$39,517
(% of AGI for various income ranges: 61.1% for AGIs below $25k, 161.8% for AGIs $25k-50k, 370.4% for AGIs $50k-75k, 746.8% for AGIs $75k-100k, 1708.1% for AGIs $100k-200k, 7283.0% for AGIs over 200k)
Charity contributions: $5,396 (reported on 12.4% of returns)
Here:
$5,396
State:
$12,598
(% of AGI for various income ranges: 4.0% for AGIs below $25k, 13.2% for AGIs $25k-50k, 38.9% for AGIs $50k-75k, 101.6% for AGIs $75k-100k, 189.7% for AGIs $100k-200k, 1128.3% for AGIs over 200k)
Taxes paid: $9,396 (reported on 16.7% of returns)
95133:
$9,396
State:
$8,807
(% of AGI for various income ranges: 17.2% for AGIs below $25k, 44.9% for AGIs $25k-50k, 115.7% for AGIs $50k-75k, 236.9% for AGIs $75k-100k, 561.5% for AGIs $100k-200k, 2093.3% for AGIs over 200k)
Earned income credit: $1,833 (reported on 10.4% of returns)
Here:
$1,833
State:
$2,074
(% of AGI for various income ranges: 73.1% for AGIs below $25k, 53.4% for AGIs $25k-50k)
Percentage of individuals using paid preparers for their 2020 taxes: 91.4%
Here:
91%
State:
92%
(% for various income ranges: 88.6% for AGIs below $25k, 92.1% for AGIs $25k-50k, 92.6% for AGIs $50k-75k, 91.5% for AGIs $75k-100k, 90.6% for AGIs $100k-200k, 95.1% for AGIs over 200k)
Averages for the 2012 tax year for zip code 95133, filed in 2013:
Average Adjusted Gross Income (AGI) in 2012: $59,317 (Individual Income Tax Returns)
Here:
$59,317
State:
$72,726
Salary/wage: $56,657 (reported on 87.9% of returns)
Here:
$56,657
State:
$59,079
(% of AGI for various income ranges: 78.5% for AGIs below $25k, 87.3% for AGIs $25k-50k, 85.9% for AGIs $50k-75k, 86.7% for AGIs $75k-100k, 85.8% for AGIs $100k-200k, 78.2% for AGIs over 200k)
Taxable interest for individuals: $666 (reported on 34.4% of returns)
This zip code:
$666
California:
$2,146
(% of AGI for various income ranges: 0.6% for AGIs below $25k, 0.5% for AGIs $25k-50k, 0.3% for AGIs $50k-75k, 0.3% for AGIs $75k-100k, 0.4% for AGIs $100k-200k, 0.4% for AGIs over 200k)
Ordinary dividends: $2,840 (reported on 17.9% of returns)
Here:
$2,840
State:
$9,308
(% of AGI for various income ranges: 0.9% for AGIs below $25k, 0.4% for AGIs $25k-50k, 0.4% for AGIs $50k-75k, 0.7% for AGIs $75k-100k, 0.9% for AGIs $100k-200k, 1.5% for AGIs over 200k)
Net capital gain/loss in AGI: +$6,359 (reported on 18.0% of returns)
Here:
+$6,359
State:
+$30,460
(% of AGI for various income ranges: 0.9% for AGIs $100k-200k, 8.5% for AGIs over 200k)
Profit/loss from business: +$13,094 (reported on 13.4% of returns)
Here:
+$13,094
State:
+$17,064
(% of AGI for various income ranges: 9.5% for AGIs below $25k, 4.0% for AGIs $25k-50k, 2.2% for AGIs $50k-75k, 1.7% for AGIs $75k-100k, 2.2% for AGIs $100k-200k, 2.2% for AGIs over 200k)
Taxable individual retirement arrangement distribution: $17,139 (reported on 5.1% of returns)
95133:
$17,139
California:
$19,557
(% of AGI for various income ranges: 1.7% for AGIs below $25k, 1.2% for AGIs $25k-50k, 1.9% for AGIs $50k-75k, 1.5% for AGIs $75k-100k, 1.9% for AGIs $100k-200k, 0.6% for AGIs over 200k)
Self-employment retirement plans: $17,060 (reported on 0.4% of returns)
95133:
$17,060
California:
$24,530
Total itemized deductions: $27,171 (23% of AGI, reported on 33.5% of returns)
Here:
$27,171
State:
$34,004
Here:
23.3% of AGI
State:
22.7% of AGI
(% of AGI for various income ranges: 7.1% for AGIs below $25k, 9.4% for AGIs $25k-50k, 14.6% for AGIs $50k-75k, 18.1% for AGIs $75k-100k, 18.4% for AGIs $100k-200k, 16.7% for AGIs over 200k)
Charity contributions: $2,550 (reported on 26.6% of returns)
Here:
$2,550
State:
$4,659
(% of AGI for various income ranges: 0.4% for AGIs below $25k, 0.7% for AGIs $25k-50k, 1.0% for AGIs $50k-75k, 1.3% for AGIs $75k-100k, 1.4% for AGIs $100k-200k, 1.4% for AGIs over 200k)
Taxes paid: $11,616 (reported on 33.5% of returns)
95133:
$11,616
State:
$14,448
(% of AGI for various income ranges: 1.8% for AGIs below $25k, 2.7% for AGIs $25k-50k, 4.9% for AGIs $50k-75k, 7.0% for AGIs $75k-100k, 8.3% for AGIs $100k-200k, 9.3% for AGIs over 200k)
Earned income credit: $2,084 (reported on 19.2% of returns)
Here:
$2,084
State:
$2,286
(% of AGI for various income ranges: 6.7% for AGIs below $25k, 1.0% for AGIs $25k-50k)
Percentage of individuals using paid preparers for their 2012 taxes: 63.4%
Here:
63%
State:
64%
(% for various income ranges: 65.0% for AGIs below $25k, 67.6% for AGIs $25k-50k, 64.8% for AGIs $50k-75k, 62.9% for AGIs $75k-100k, 54.5% for AGIs $100k-200k, 50.0% for AGIs over 200k)
Averages for the 2004 tax year for zip code 95133, filed in 2005:
Average Adjusted Gross Income (AGI) in 2004: $47,830 (Individual Income Tax Returns)
Here:
$47,830
State:
$58,600
Salary/wage: $47,281 (reported on 89.0% of returns)
Here:
$47,281
State:
$49,455
(% of AGI for various income ranges: 106.5% for AGIs below $10k, 82.7% for AGIs $10k-25k, 90.4% for AGIs $25k-50k, 89.2% for AGIs $50k-75k, 89.4% for AGIs $75k-100k, 86.0% for AGIs over 100k)
Taxable interest for individuals: $933 (reported on 44.1% of returns)
This zip code:
$933
California:
$2,365
(% of AGI for various income ranges: 2.7% for AGIs below $10k, 1.0% for AGIs $10k-25k, 0.7% for AGIs $25k-50k, 0.6% for AGIs $50k-75k, 0.7% for AGIs $75k-100k, 1.0% for AGIs over 100k)
Taxable dividends: $1,424 (reported on 18.9% of returns)
Here:
$1,424
State:
$4,746
(% of AGI for various income ranges: 1.5% for AGIs below $10k, 0.6% for AGIs $10k-25k, 0.4% for AGIs $25k-50k, 0.4% for AGIs $50k-75k, 0.6% for AGIs $75k-100k, 0.7% for AGIs over 100k)
Net capital gain/loss: +$3,751 (reported on 21.6% of returns)
Here:
+$3,751
State:
+$23,418
(% of AGI for various income ranges: -2.3% for AGIs below $10k, -0.6% for AGIs $10k-25k, 0.1% for AGIs $25k-50k, 0.2% for AGIs $50k-75k, 0.4% for AGIs $75k-100k, 4.3% for AGIs over 100k)
Profit/loss from business: +$10,947 (reported on 13.0% of returns)
Here:
+$10,947
State:
+$16,826
(% of AGI for various income ranges: 7.0% for AGIs below $10k, 7.5% for AGIs $10k-25k, 3.0% for AGIs $25k-50k, 2.8% for AGIs $50k-75k, 1.6% for AGIs $75k-100k, 2.5% for AGIs over 100k)
IRA payment deduction: $3,271 (reported on 2.5% of returns)
95133:
$3,271
California:
$3,192
(% of AGI for various income ranges: 0.2% for AGIs $10k-25k, 0.2% for AGIs $25k-50k, 0.2% for AGIs $50k-75k, 0.2% for AGIs $75k-100k, 0.1% for AGIs over 100k)
Self-employed pension: $10,039 (reported on 0.5% of returns)
Here:
$10,039
California:
$17,688
Total itemized deductions: $24,501 (28% of AGI, reported on 38.0% of returns)
Here:
$24,501
State:
$28,113
Here:
28.2% of AGI
State:
25.3% of AGI
(% of AGI for various income ranges: 15.1% for AGIs below $10k, 9.1% for AGIs $10k-25k, 15.4% for AGIs $25k-50k, 22.9% for AGIs $50k-75k, 24.1% for AGIs $75k-100k, 20.4% for AGIs over 100k)
Charity contributions deductions: $2,202 (2% of AGI, reported on 32.8% of returns)
Here:
$2,202
State:
$3,923
Here:
2.4% of AGI
State:
3.3% of AGI
(% of AGI for various income ranges: 0.6% for AGIs below $10k, 0.5% for AGIs $10k-25k, 1.1% for AGIs $25k-50k, 1.5% for AGIs $50k-75k, 1.9% for AGIs $75k-100k, 1.8% for AGIs over 100k)
Total tax: $6,693 (reported on 74.4% of returns)
95133:
$6,693
State:
$10,761
(% of AGI for various income ranges: 4.0% for AGIs below $10k, 3.9% for AGIs $10k-25k, 6.2% for AGIs $25k-50k, 8.4% for AGIs $50k-75k, 9.5% for AGIs $75k-100k, 15.4% for AGIs over 100k)
Earned income credit: $1,692 (reported on 16.2% of returns)
Here:
$1,692
State:
$1,763
Percentage of individuals using paid preparers for their 2004 taxes: 64.3%
Here:
64%
State:
66%
(% for various income ranges: 58.4% for AGIs below $10k, 69.4% for AGIs $10k-25k, 70.3% for AGIs $25k-50k, 68.8% for AGIs $50k-75k, 59.0% for AGIs $75k-100k, 49.5% for AGIs over 100k)
Likely homosexual households (counted as self-reported same-sex unmarried-partner households)
Lesbian couples: 0.0% of all households
Gay men: 0.4% of all households
Household received Food Stamps/SNAP in the past 12 months: 1,250 Household did not receive Food Stamps/SNAP in the past 12 months: 7,971
Women who had a birth in the past 12 months: 234 (210 now married, 23 unmarried) Women who did not have a birth in the past 12 months: 6,794 (2,782 now married, 4,008 unmarried)
Housing units in zip code 95133 with a mortgage: 3,930 (352 second mortgage, 276 both second mortgage and home equity loan) Houses without a mortgage: 120
Median monthly owner costs for units with a mortgage: $3,484 Median monthly owner costs for units without a mortgage: $937
Residents with income below the poverty level in 2022:
This zip code:
11.8%
Whole state:
12.2%
Residents with income below 50% of the poverty level in 2022:
This zip code:
5.0%
Whole state:
6.2%
Median number of rooms in houses and condos:
Here:
5.4
State:
6.0
Median number of rooms in apartments:
Here:
3.9
State:
3.9
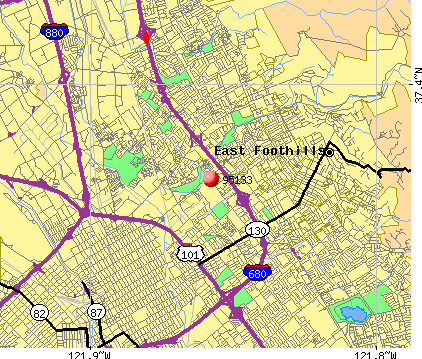
Notable locations in this zip code not listed on our city pages
3,147 married couples with children.
1,377 single-parent households (487 men, 890 women).
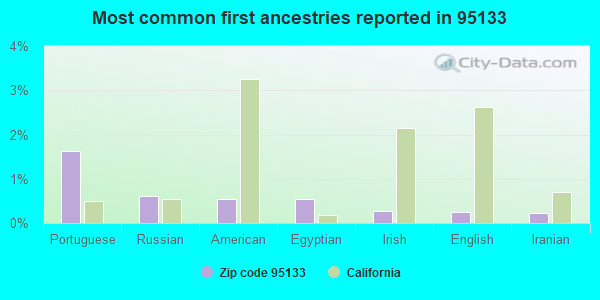
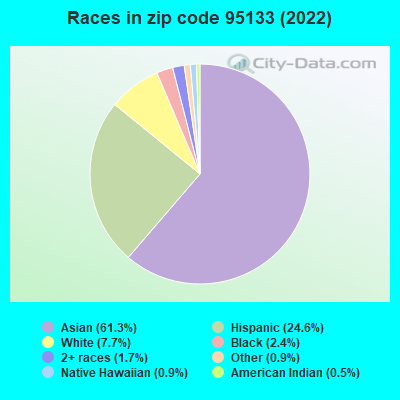
28.2% of residents of 95133 zip code speak English at home.
18.0% of residents speak Spanish at home (49% very well, 21% well, 25% not well, 4% not at all).
8.9% of residents speak other Indo-European language at home (68% very well, 19% well, 8% not well, 5% not at all).
44.8% of residents speak Asian or Pacific Island language at home (48% very well, 27% well, 20% not well, 5% not at all).
0.5% of residents speak other language at home (76% very well, 24% well).
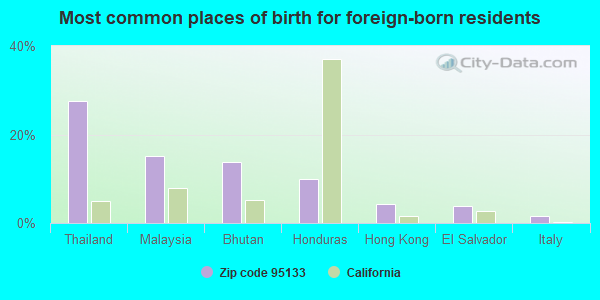
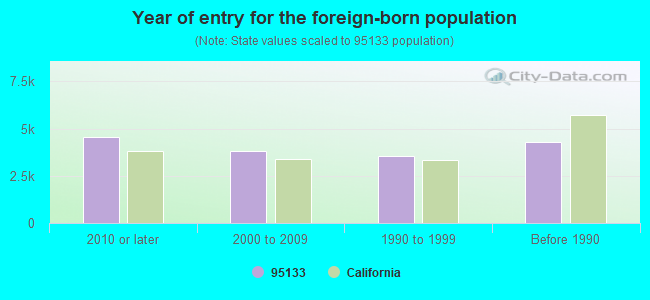
Foreign born population: 15,632 (54.8%) (61.9% of them are naturalized citizens)
Major facilities with environmental interests located in this zip code:
NEW AGE METAL FINISHING SAN JOSE LLC (1893 DOBBIN DR in SAN JOSE, CA)
STATE MASTER (California - Hazardous Waste Tracking) - HAZARDOU WASTE PROGRAM ENFORCEMENT/COMPLIANCE ACTIVITY (Integrated Compliance Information System) National Pollutant Discharge Elimination System NON-MAJOR (Tracking pollutant discharge elimination systems) - permit Large Quantity Generators, more that 1000 kg of hazardous waste/month (Resource Conservation and Recovery Act (tracking hazardous waste)) - notification TRI REPORTER (Tracking of toxic chemicals releasing facilities) Business SIC and NAICS classification: ELECTROPLATING, PLATING, POLISHING, ANODIZING, AND COLORING Organizations: HIEP TOAN KHIET PROPERTIES (CONTACT/OWNER)
Alternative names: ALL METAL PLATING INC, ANOPLATE METAL FINISHING INC
CHEVRON PRODUCTS COMPANY SAN JOSE TERMINAL (1020 BERRYESSA RD. in SAN JOSE, CA)
OIL CONTROL (Facility Response Plan for oil discharge) STATE MASTER (California - Hazardous Waste Tracking) - HAZARDOU WASTE PROGRAM CRITERIA AND HAZARDOUS AIR POLLUTANT INVENTORY (Inventory of air pollution sources) Large Quantity Generators, more that 1000 kg of hazardous waste/month (Resource Conservation and Recovery Act (tracking hazardous waste)) TRI REPORTER (Tracking of toxic chemicals releasing facilities) Business SIC classification: PETROLEUM BULK STATIONS AND TERMINALS Organizations: CHEVRON U.S.A. PRODUCTS (CONTACT/GENERAL)
, CHEVRON PRODUCTS CO. (CONTACT/OPERATOR)
Alternative names: CHEVRON INC, CHEVRON PRODS. CO. SAN JOSE TERMINAL, CHEVRON SAN JOSE TERMINAL , CHEVRON USA INC SAN JOSE TERM
ELCON (1009 TIMOTHY DRIVE in SAN JOSE, CA)
STATE MASTER (California - Hazardous Waste Tracking) - HAZARDOU WASTE PROGRAM CRITERIA AND HAZARDOUS AIR POLLUTANT INVENTORY (Inventory of air pollution sources) HAZARDOUS WASTE BIENNIAL REPORTER (Resource Conservation and Recovery Act (tracking hazardous waste)) Large Quantity Generators, more that 1000 kg of hazardous waste/month (Resource Conservation and Recovery Act (tracking hazardous waste)) Business SIC classification: SEMICONDUCTORS AND RELATED DEVICES Business NAICS classification: OTHER ELECTRONIC COMPONENT MANUFACTURING.; ALL OTHER MISCELLANEOUS ELECTRICAL EQUIPMENT AND COMPONENT MANUFACTURING. Organizations: ANTHONY BARRACO (CONTACT/OPERATOR)
MOORE MATERIAL HANDLING GROUP (875 MABURY ROAD in SAN JOSE, CA)
STATE MASTER (California - Hazardous Waste Tracking) - HAZARDOU WASTE PROGRAM CRITERIA AND HAZARDOUS AIR POLLUTANT INVENTORY (Inventory of air pollution sources) Large Quantity Generators, more that 1000 kg of hazardous waste/month (Resource Conservation and Recovery Act (tracking hazardous waste)) Business NAICS classification: INDUSTRIAL TRUCK, TRACTOR, TRAILER, AND STACKER MACHINERY MANUFACTURING. Alternative names: MOORE MATERIAL HANDLING GRP
CHEVRON STATION NO 96215 (1715 BERRYESA RD in SAN JOSE, CA)
STATE MASTER (California - Hazardous Waste Tracking) - HAZARDOU WASTE PROGRAM Small Quantity Generators, between 100 kg and 1000 kg of hazardous waste/month (Resource Conservation and Recovery Act (tracking hazardous waste)) - notification Organizations: CHEVRON PRODUCTS CO (CONTACT/OWNER)
EAST SIDE CADET ACADEMY (2315 CANOAS GARDEN in SAN JOSE, CA)
(National Center for Education Statistics) - STATE ID-4330551 Organizations: EAST SIDE UNION HIGH (SCHOOL DISTRICT)
INDEPENDENCE HIGH (1776 EDUCATIONAL PARK DR. in SAN JOSE, CA)
(National Center for Education Statistics) - STATE ID-4330031 Organizations: EAST SIDE UNION HIGH (SCHOOL DISTRICT)
ANDPAK EMA INC (1860 DOBBIN DR. in SAN JOSE, CA)
HAZARDOUS WASTE BIENNIAL REPORTER (Resource Conservation and Recovery Act (tracking hazardous waste)) Small Quantity Generators, between 100 kg and 1000 kg of hazardous waste/month (Resource Conservation and Recovery Act (tracking hazardous waste)) - notification (Resource Conservation and Recovery Act (tracking hazardous waste)) TRI REPORTER (Tracking of toxic chemicals releasing facilities) Business SIC classification: CHEMICALS AND CHEMICAL PREPARATIONS Business NAICS classification: ALL OTHER MISCELLANEOUS CHEMICAL PRODUCT AND PREPARATION MANUFACTURING.; ALL OTHER MISCELLANEOUS CHEMICAL PRODUCT AND PREPARATION MANUFACTURING.; ALL OTHER BUSINESS SUPPORT SERVICES. Organizations: PACKERS PARTNERS (CONTACT/OWNER)
Alternative names: ANDPAK INC.
INTERNATIONAL PAPER CO (1601 LAS PLUMAS AVE in SAN JOSE, CA)
(Resource Conservation and Recovery Act (tracking hazardous waste)) TRI REPORTER (Tracking of toxic chemicals releasing facilities) Business SIC classification: CORRUGATED AND SOLID FIBER BOXES Organizations: INTERNATIONAL PAPER COMPANY (CONTACT/OWNER)
Alternative names: INTERNATIONAL PAPER COMPANY BAG-PAK
INTRA FAB INC (660 LENFEST RD in SAN JOSE, CA)
Small Quantity Generators, between 100 kg and 1000 kg of hazardous waste/month (Resource Conservation and Recovery Act (tracking hazardous waste)) Small Quantity Generators, between 100 kg and 1000 kg of hazardous waste/month (Resource Conservation and Recovery Act (tracking hazardous waste)) Organizations: KEENE PRODUCTS INC (CONTACT/OWNER)
Alternative names: KEENE PRODS INC SAN JOSE DIV
ECOLAB INC (640 LENFEST RD. in SAN JOSE, CA)
COMPLIANCE ACTIVITY (Tracking inspections of insecticide, fungicide, and rodenticide, and toxic substances) CRITERIA AND HAZARDOUS AIR POLLUTANT INVENTORY (Inventory of air pollution sources) Small Quantity Generators, between 100 kg and 1000 kg of hazardous waste/month (Resource Conservation and Recovery Act (tracking hazardous waste)) TRI REPORTER (Tracking of toxic chemicals releasing facilities) Business SIC classification: SOAP AND OTHER DETERGENTS, EXCEPT SPECIALTY CLEANERS; SPECIALTY CLEANING, POLISHING, AND SANITATION PREPARATIONS Business NAICS classification: SOAP AND OTHER DETERGENT MANUFACTURING.; POLISH AND OTHER SANITATION GOOD MANUFACTURING. Organizations: ECONOMICS LABORATORY INC (CONTACT/OPERATOR)
Alternative names: ECONOMICS LABORATORY INC
CHEVRON NO 93837 (1140 N CAPITOL AVE in SAN JOSE, CA)
HAZARDOUS WASTE BIENNIAL REPORTER (Resource Conservation and Recovery Act (tracking hazardous waste)) Large Quantity Generators, more that 1000 kg of hazardous waste/month (Resource Conservation and Recovery Act (tracking hazardous waste)) Organizations: CHEVRON PRODUCTS CO (CONTACT/OWNER)
AMERICAN DRUMS (545 NIPPER AVENUE in SAN JOSE, CA)
CRITERIA AND HAZARDOUS AIR POLLUTANT INVENTORY (Inventory of air pollution sources) TRANSPORTER (Resource Conservation and Recovery Act (tracking hazardous waste)) Business SIC classification: INDUSTRIAL SUPPLIES Organizations: CARLOS CESAR AUBAIN (CONTACT/OWNER)
Housing units lacking complete kitchen facilities: 0.3%
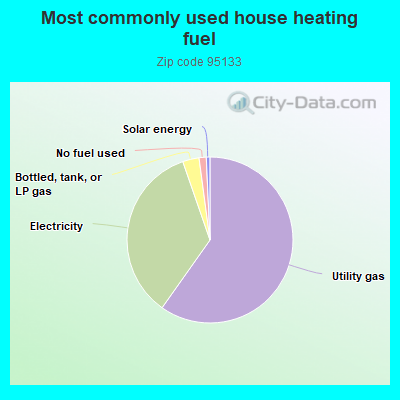
59.8%Utility gas
34.9%Electricity
3.2%Bottled, tank, or LP gas
1.4%No fuel used
0.7%Solar energy
Population in 1990: 24,136. Population change in the 1990s: +1,882 (+7.8%).
Place of birth for U.S.-born residents:
This state: 10,941
Northeast: 438
Midwest: 259
South: 576
West: 354
54% of the 95133 zip code residents lived in the same house 5 years ago. Out of people who lived in different houses, 82% lived in this county. Out of people who lived in different counties, 50% lived in California.
90% of the 95133 zip code residents lived in the same house 1 year ago. Out of people who lived in different houses, 54% moved from this county. Out of people who lived in different houses, 27% moved from different county within same state. Out of people who lived in different houses, 8% moved from different state. Out of people who lived in different houses, 11% moved from abroad.
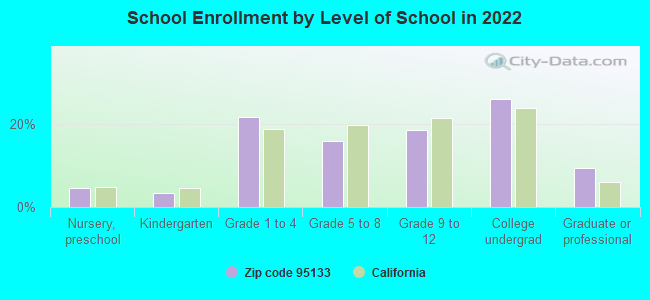
Private vs. public school enrollment:
Students in private schools in grades 1 to 8 (elementary and middle school): 251
Here:
9.9%
California:
10.5%
Students in private schools in grades 9 to 12 (high school): 197
Here:
16.0%
California:
8.5%
Students in private undergraduate colleges: 85
Here:
4.9%
California:
15.9%
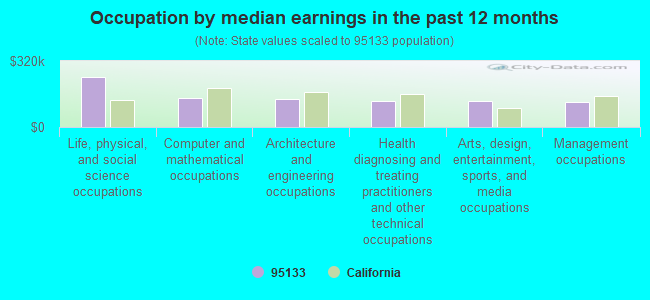
Occupation by median earnings in the past 12 months ($)
242,578Life, physical, and social science occupations
141,834Computer and mathematical occupations
135,680Architecture and engineering occupations
126,058Health diagnosing and treating practitioners and other technical occupations
125,466Arts, design, entertainment, sports, and media occupations
121,408Management occupations
Companies with federal contracts located in this zip code (SAN JOSE, CA):
TELEWAVE, INC (660 GIGUERE CT; small business) : $995,300 in 44 contractsfrom 2000 to 2006
Contracts for ADP Software, Radio and Television Communication Equipment, Except Airborne, Communications Services, Communication Training Devices, and moreby Bureau of the Public Debt, Air Force, U.S. Secret Service (disused code: now 7009), ENERGY, Department of, and others Signed by year:2000: $209,296; 2001: $45,442; 2002: $183,949; 2003: $311,255; 2004: $125,171; 2005: $64,598; 2006: $55,589.
Biggest contracts:
$180,000 with Bureau of the Public Debt for ADP Software. Taking place in MD. Signed on 2002-04-15. Completion date: 2003-03-15.
$150,000 with Air Force for ADP Software. Signed on 2003-07-31. Completion date: 2003-09-02.
$130,000 with Bureau of the Public Debt for ADP Software. Taking place in DC. Signed on 2003-06-15. Completion date: 2003-09-15.
$96,000 with U.S. Secret Service (disused code: now 7009) for ADP Software. Taking place in MD. Signed on 2000-06-15. Completion date: 2000-08-15.
UNITRACE INC (975 MABURY RD; small business) : $164,894 in 13 contractsfrom 2002 to 2006
Contracts for Electrical and Electronic assemblies, Boards, Cards, and Associated Hardware, Semiconductor Devices and Associated Hardware, Microcircuits, Electronic, Guns, through 30 mm by Navy Signed by year:2000: $0; 2001: $0; 2002: $67,250; 2003: $0; 2004: $65,079; 2005: $29,545; 2006: $3,020.
Biggest contracts:
$37,500 with Navy for Electrical and Electronic assemblies, Boards, Cards, and Associated Hardware. Signed on 2002-05-10. Completion date: 2002-05-24.
$29,750 with Navy for Semiconductor Devices and Associated Hardware. Signed on 2002-05-28. Completion date: 2003-07-21.
$28,200, same as above.Signed on 2004-05-18. Completion date: 2004-06-20.
$18,072 with Navy for Microcircuits, Electronic. Signed on 2004-10-13. Completion date: 2004-10-29.
PRIME IMAGE, INC (662 GIGUERE CT STE C; small business) : $98,708 in 2 contractsin 2002
$84,600 with Department of Defense for Radio and Television Communication Equipment, Except Airborne. Signed on 2002-08-28. Completion date: 2002-10-31.
$14,108, same as above.Signed on 2002-08-30. Completion date: 2002-09-24.
RECORTEC INC (1620 BERRYESSA RD STE A; small business) : $29,954 in 4 contractsfrom 2005 to 2006
$14,149 with Navy for Communications Security Equipment and Components. Signed on 2005-02-24. Completion date: 2005-03-05.
$10,635 with Navy for ADP Supplies. Signed on 2005-06-23. Completion date: 2005-07-01.
$6,000 with Navy for ADP Support Equipment. Signed on 2006-04-25. Completion date: 2006-05-31.
-$830 with Navy for Miscellaneous Items. Signed on 2005-05-25. Completion date: 2004-08-31.
MICRO PRECISION CALIBRATION, I (1679 MABURY RD) : $12,814 in 4 contractsfrom 2004 to 2006
$6,035 with Navy for Non-nuclear Ship Repair (West) Ship repair (including overhauls and conversions) performed on. non-nuclear propelled and nonpropelled ships west of the 108th meridian. Signed on 2004-11-12. Completion date: 2004-11-15.
$5,934 with Defense Logistics Agency for Miscellaneous Items. Signed on 2005-01-26. Completion date: 2006-02-03.
$3,009 with Navy for Non-nuclear Ship Repair (West) Ship repair (including overhauls and conversions) performed on. non-nuclear propelled and nonpropelled ships west of the 108th meridian. Signed on 2005-04-29. Completion date: 2005-01-28.
-$2,164 with Defense Logistics Agency for Maintenance, Repair and Rebuilding of Equipment -- Miscellaneous. Signed on 2006-05-19. Completion date: 2006-05-19.
ROSS SKATE PARKS INC (1585 MABURY RD STE B; small business)
$2,885 with Army for Miscellaneous Furniture and Fixtures. Signed on 2004-03-23. Completion date: 2004-04-30.
GDSI (925 BERRYESSA RD)
$1,120 with Navy for Other ADP and Telecommunications Services (includes data storage on tapes, compact disks, etc.). Signed on 2005-05-25. Completion date: 2005-06-27.
Top industries in this zip code by the number of employees in 2005:


 Nearest zip codes: 95116, 95112, 95131, 95113, 95122, 95110.