Estimated zip code population in 2022: 20,145 Zip code population in 2010: 18,730 Zip code population in 2000: 18,180
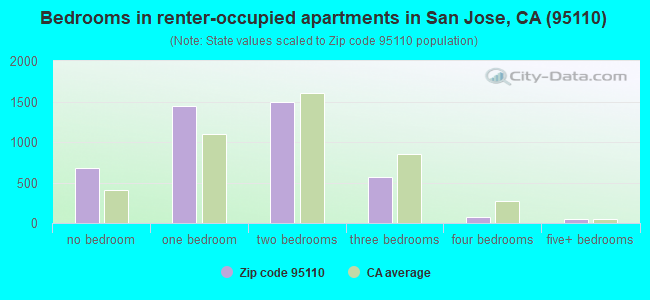
Houses and condos: 7,780 Renter-occupied apartments: 4,293
% of renters here:
62%
State:
44%
March 2022 cost of living index in zip code 95110: 121.3 (high, U.S. average is 100)
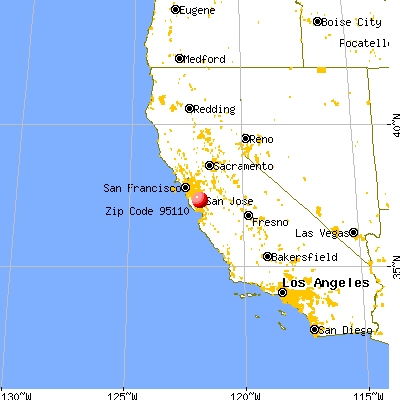
Land area: 4.7 sq. mi. Water area: 0.0 sq. mi.
Population density: 4,318 people per square mile
(average).
OSM Map
General Map
Google Map
MSN Map
OSM Map
General Map
Google Map
MSN Map
OSM Map
General Map
Google Map
MSN Map
OSM Map
General Map
Google Map
MSN Map
Please wait while loading the map...
Real estate property taxes paid for housing units in 2022:
This zip code:
0.8% ($7,983)
California:
0.7% ($4,831)
Median real estate property taxes paid for housing units with mortgages in 2022: $8,189 (0.8%) Median real estate property taxes paid for housing units with no mortgage in 2022: $7,097 (0.8%)
Averages for the 2020 tax year for zip code 95110, filed in 2021:
Average Adjusted Gross Income (AGI) in 2020: $94,998 (Individual Income Tax Returns)
Here:
$94,998
State:
$95,910
Salary/wage: $91,660 (reported on 89.1% of returns)
Here:
$91,660
State:
$77,331
(% of AGI for various income ranges: 1361.1% for AGIs below $25k, 4402.3% for AGIs $25k-50k, 7917.6% for AGIs $50k-75k, 11449.4% for AGIs $75k-100k, 22761.1% for AGIs $100k-200k, 126182.7% for AGIs over 200k)
Taxable interest for individuals: $806 (reported on 29.3% of returns)
This zip code:
$806
California:
$2,294
(% of AGI for various income ranges: 7.0% for AGIs below $25k, 10.4% for AGIs $25k-50k, 16.2% for AGIs $50k-75k, 31.9% for AGIs $75k-100k, 66.1% for AGIs $100k-200k, 391.5% for AGIs over 200k)
Ordinary dividends: $3,263 (reported on 21.1% of returns)
Here:
$3,263
State:
$10,949
(% of AGI for various income ranges: 14.9% for AGIs below $25k, 20.0% for AGIs $25k-50k, 25.9% for AGIs $50k-75k, 39.0% for AGIs $75k-100k, 141.1% for AGIs $100k-200k, 1633.8% for AGIs over 200k)
Net capital gain/loss in AGI: +$22,753 (reported on 21.8% of returns)
Here:
+$22,753
State:
+$49,306
(% of AGI for various income ranges: 8.3% for AGIs below $25k, 29.7% for AGIs $25k-50k, 55.4% for AGIs $50k-75k, 109.0% for AGIs $75k-100k, 426.4% for AGIs $100k-200k, 16102.7% for AGIs over 200k)
Profit/loss from business: +$12,230 (reported on 13.4% of returns)
Here:
+$12,230
State:
+$15,671
(% of AGI for various income ranges: 270.2% for AGIs below $25k, 184.0% for AGIs $25k-50k, 153.2% for AGIs $50k-75k, 329.2% for AGIs $75k-100k, 319.4% for AGIs $100k-200k, 981.2% for AGIs over 200k)
Taxable individual retirement arrangement distribution: $18,028 (reported on 3.0% of returns)
95110:
$18,028
California:
$23,505
(% of AGI for various income ranges: 22.8% for AGIs below $25k, 30.9% for AGIs $25k-50k, 61.7% for AGIs $50k-75k, 123.3% for AGIs $75k-100k, 180.6% for AGIs $100k-200k, 500.0% for AGIs over 200k)
Self-employed (Keogh) retirement plans: $17,575 (reported on 0.4% of returns)
95110:
$17,575
California:
$30,163
(% of AGI for various income ranges: 73.2% for AGIs $100k-200k)
Total itemized deductions: $28,589 (reported on 14.2% of returns)
Here:
$28,589
State:
$39,517
(% of AGI for various income ranges: 54.1% for AGIs below $25k, 132.4% for AGIs $25k-50k, 240.9% for AGIs $50k-75k, 648.9% for AGIs $75k-100k, 1441.6% for AGIs $100k-200k, 6159.2% for AGIs over 200k)
Charity contributions: $5,121 (reported on 10.2% of returns)
Here:
$5,121
State:
$12,598
(% of AGI for various income ranges: 13.4% for AGIs $25k-50k, 17.7% for AGIs $50k-75k, 65.2% for AGIs $75k-100k, 172.4% for AGIs $100k-200k, 987.7% for AGIs over 200k)
Taxes paid: $9,349 (reported on 14.1% of returns)
95110:
$9,349
State:
$8,807
(% of AGI for various income ranges: 14.9% for AGIs below $25k, 37.4% for AGIs $25k-50k, 76.1% for AGIs $50k-75k, 223.2% for AGIs $75k-100k, 519.7% for AGIs $100k-200k, 1832.7% for AGIs over 200k)
Earned income credit: $1,868 (reported on 9.1% of returns)
Here:
$1,868
State:
$2,074
(% of AGI for various income ranges: 72.8% for AGIs below $25k, 42.3% for AGIs $25k-50k)
Percentage of individuals using paid preparers for their 2020 taxes: 92.0%
Here:
92%
State:
92%
(% for various income ranges: 87.1% for AGIs below $25k, 91.3% for AGIs $25k-50k, 92.6% for AGIs $50k-75k, 95.8% for AGIs $75k-100k, 94.2% for AGIs $100k-200k, 96.1% for AGIs over 200k)
Averages for the 2012 tax year for zip code 95110, filed in 2013:
Average Adjusted Gross Income (AGI) in 2012: $65,057 (Individual Income Tax Returns)
Here:
$65,057
State:
$72,726
Salary/wage: $59,275 (reported on 89.5% of returns)
Here:
$59,275
State:
$59,079
(% of AGI for various income ranges: 80.7% for AGIs below $25k, 90.6% for AGIs $25k-50k, 89.4% for AGIs $50k-75k, 89.5% for AGIs $75k-100k, 90.2% for AGIs $100k-200k, 62.7% for AGIs over 200k)
Taxable interest for individuals: $747 (reported on 28.5% of returns)
This zip code:
$747
California:
$2,146
(% of AGI for various income ranges: 0.4% for AGIs below $25k, 0.2% for AGIs $25k-50k, 0.3% for AGIs $50k-75k, 0.4% for AGIs $75k-100k, 0.3% for AGIs $100k-200k, 0.4% for AGIs over 200k)
Ordinary dividends: $2,685 (reported on 13.5% of returns)
Here:
$2,685
State:
$9,308
(% of AGI for various income ranges: 0.5% for AGIs below $25k, 0.2% for AGIs $25k-50k, 0.6% for AGIs $50k-75k, 0.6% for AGIs $75k-100k, 0.5% for AGIs $100k-200k, 0.8% for AGIs over 200k)
Net capital gain/loss in AGI: +$10,013 (reported on 13.0% of returns)
Here:
+$10,013
State:
+$30,460
(% of AGI for various income ranges: 0.2% for AGIs $75k-100k, 0.7% for AGIs $100k-200k, 6.3% for AGIs over 200k)
Profit/loss from business: +$18,368 (reported on 13.3% of returns)
Here:
+$18,368
State:
+$17,064
(% of AGI for various income ranges: 10.1% for AGIs below $25k, 3.5% for AGIs $25k-50k, 2.3% for AGIs $50k-75k, 2.9% for AGIs $75k-100k, 2.3% for AGIs $100k-200k, 4.5% for AGIs over 200k)
Taxable individual retirement arrangement distribution: $17,279 (reported on 3.3% of returns)
95110:
$17,279
California:
$19,557
(% of AGI for various income ranges: 0.9% for AGIs below $25k, 0.7% for AGIs $25k-50k, 0.8% for AGIs $50k-75k, 0.8% for AGIs $75k-100k, 0.9% for AGIs $100k-200k, 1.1% for AGIs over 200k)
Self-employment retirement plans: $20,300 (reported on 0.5% of returns)
95110:
$20,300
California:
$24,530
Total itemized deductions: $26,057 (19% of AGI, reported on 30.7% of returns)
Here:
$26,057
State:
$34,004
Here:
19.1% of AGI
State:
22.7% of AGI
(% of AGI for various income ranges: 6.4% for AGIs below $25k, 7.3% for AGIs $25k-50k, 11.6% for AGIs $50k-75k, 14.8% for AGIs $75k-100k, 14.8% for AGIs $100k-200k, 13.5% for AGIs over 200k)
Charity contributions: $2,449 (reported on 21.0% of returns)
Here:
$2,449
State:
$4,659
(% of AGI for various income ranges: 0.2% for AGIs below $25k, 0.4% for AGIs $25k-50k, 0.8% for AGIs $50k-75k, 1.0% for AGIs $75k-100k, 1.0% for AGIs $100k-200k, 0.9% for AGIs over 200k)
Taxes paid: $13,066 (reported on 30.5% of returns)
95110:
$13,066
State:
$14,448
(% of AGI for various income ranges: 1.5% for AGIs below $25k, 1.9% for AGIs $25k-50k, 3.6% for AGIs $50k-75k, 6.1% for AGIs $75k-100k, 7.6% for AGIs $100k-200k, 9.3% for AGIs over 200k)
Earned income credit: $2,097 (reported on 14.0% of returns)
Here:
$2,097
State:
$2,286
(% of AGI for various income ranges: 4.6% for AGIs below $25k, 0.8% for AGIs $25k-50k)
Percentage of individuals using paid preparers for their 2012 taxes: 63.2%
Here:
63%
State:
64%
(% for various income ranges: 68.6% for AGIs below $25k, 66.2% for AGIs $25k-50k, 57.5% for AGIs $50k-75k, 56.3% for AGIs $75k-100k, 52.4% for AGIs $100k-200k, 62.9% for AGIs over 200k)
Averages for the 2004 tax year for zip code 95110, filed in 2005:
Average Adjusted Gross Income (AGI) in 2004: $44,622 (Individual Income Tax Returns)
Here:
$44,622
State:
$58,600
Salary/wage: $42,503 (reported on 90.1% of returns)
Here:
$42,503
State:
$49,455
(% of AGI for various income ranges: 104.9% for AGIs below $10k, 85.1% for AGIs $10k-25k, 91.7% for AGIs $25k-50k, 89.7% for AGIs $50k-75k, 89.7% for AGIs $75k-100k, 76.7% for AGIs over 100k)
Taxable interest for individuals: $1,111 (reported on 33.1% of returns)
This zip code:
$1,111
California:
$2,365
(% of AGI for various income ranges: 3.0% for AGIs below $10k, 0.7% for AGIs $10k-25k, 0.7% for AGIs $25k-50k, 1.0% for AGIs $50k-75k, 0.8% for AGIs $75k-100k, 0.8% for AGIs over 100k)
Taxable dividends: $1,452 (reported on 12.8% of returns)
Here:
$1,452
State:
$4,746
(% of AGI for various income ranges: 1.3% for AGIs below $10k, 0.3% for AGIs $10k-25k, 0.3% for AGIs $25k-50k, 0.2% for AGIs $50k-75k, 0.4% for AGIs $75k-100k, 0.6% for AGIs over 100k)
Net capital gain/loss: +$6,551 (reported on 12.8% of returns)
Here:
+$6,551
State:
+$23,418
(% of AGI for various income ranges: -2.0% for AGIs below $10k, 0.0% for AGIs $10k-25k, -0.1% for AGIs $25k-50k, 0.5% for AGIs $50k-75k, 0.2% for AGIs $75k-100k, 5.7% for AGIs over 100k)
Profit/loss from business: +$15,078 (reported on 12.3% of returns)
Here:
+$15,078
State:
+$16,826
(% of AGI for various income ranges: 4.1% for AGIs below $10k, 6.3% for AGIs $10k-25k, 2.8% for AGIs $25k-50k, 4.1% for AGIs $50k-75k, 3.2% for AGIs $75k-100k, 5.0% for AGIs over 100k)
IRA payment deduction: $2,633 (reported on 1.5% of returns)
95110:
$2,633
California:
$3,192
(% of AGI for various income ranges: 0.2% for AGIs $10k-25k, 0.1% for AGIs $25k-50k, 0.1% for AGIs $50k-75k, 0.1% for AGIs $75k-100k, 0.1% for AGIs over 100k)
Self-employed pension: $15,500 (reported on 0.6% of returns)
Here:
$15,500
California:
$17,688
Total itemized deductions: $22,295 (27% of AGI, reported on 30.9% of returns)
Here:
$22,295
State:
$28,113
Here:
26.7% of AGI
State:
25.3% of AGI
(% of AGI for various income ranges: 14.9% for AGIs below $10k, 9.1% for AGIs $10k-25k, 11.9% for AGIs $25k-50k, 17.1% for AGIs $50k-75k, 20.2% for AGIs $75k-100k, 17.1% for AGIs over 100k)
Charity contributions deductions: $1,915 (2% of AGI, reported on 24.6% of returns)
Here:
$1,915
State:
$3,923
Here:
2.2% of AGI
State:
3.3% of AGI
(% of AGI for various income ranges: 0.4% for AGIs below $10k, 0.3% for AGIs $10k-25k, 0.7% for AGIs $25k-50k, 1.2% for AGIs $50k-75k, 1.4% for AGIs $75k-100k, 1.4% for AGIs over 100k)
Total tax: $7,019 (reported on 71.2% of returns)
95110:
$7,019
State:
$10,761
(% of AGI for various income ranges: 3.6% for AGIs below $10k, 3.5% for AGIs $10k-25k, 6.4% for AGIs $25k-50k, 10.0% for AGIs $50k-75k, 12.0% for AGIs $75k-100k, 18.0% for AGIs over 100k)
Earned income credit: $1,571 (reported on 13.8% of returns)
Here:
$1,571
State:
$1,763
Percentage of individuals using paid preparers for their 2004 taxes: 68.6%
Here:
69%
State:
66%
(% for various income ranges: 62.8% for AGIs below $10k, 76.5% for AGIs $10k-25k, 68.3% for AGIs $25k-50k, 67.8% for AGIs $50k-75k, 60.0% for AGIs $75k-100k, 63.5% for AGIs over 100k)
Likely homosexual households (counted as self-reported same-sex unmarried-partner households)
Lesbian couples: 0.1% of all households
Gay men: 1.1% of all households
Household received Food Stamps/SNAP in the past 12 months: 498 Household did not receive Food Stamps/SNAP in the past 12 months: 6,393
Women who had a birth in the past 12 months: 239 (186 now married, 53 unmarried) Women who did not have a birth in the past 12 months: 4,873 (2,230 now married, 2,630 unmarried)
Housing units in zip code 95110 with a mortgage: 2,189 (225 second mortgage, 24 home equity loan, 130 both second mortgage and home equity loan) Houses without a mortgage: 35
Median monthly owner costs for units with a mortgage: $3,295 Median monthly owner costs for units without a mortgage: $1,094
Residents with income below the poverty level in 2022:
This zip code:
11.1%
Whole state:
12.2%
Residents with income below 50% of the poverty level in 2022:
This zip code:
6.8%
Whole state:
6.2%
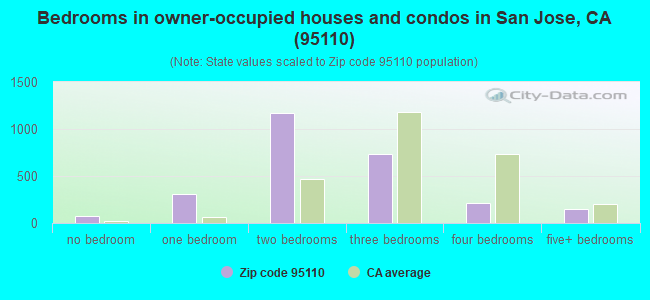
Median number of rooms in houses and condos:
Here:
4.8
State:
6.0
Median number of rooms in apartments:
Here:
3.3
State:
3.9
Notable locations in this zip code not listed on our city pages
Notable locations in zip code 95110: San Jose Convention Center (A), Childrens Museum (B), San Jose Fire Department Training Center (C), Biblioteca Latinoa Americana Branch San Jose Public Library (D), HP Pavillion (E), San Jose Fire Department Station 20 San Jose International Airport (F), San Jose Fire Department Station 1 (G). Display/hide their locations on the map
Churches in zip code 95110 include: Dien Tho Phat Mau San Jose (A), Primera Iglesia Bautista (B), Templo la Hermosa (C). Display/hide their locations on the map
Parks in zip code 95110 include: Arena Green (1), Guadalupe River Park (2), Heritage Rose Garden (3), Parque De Los Pobladores (4), Columbus Park (5), Guadalupe Gardens (6). Display/hide their locations on the map
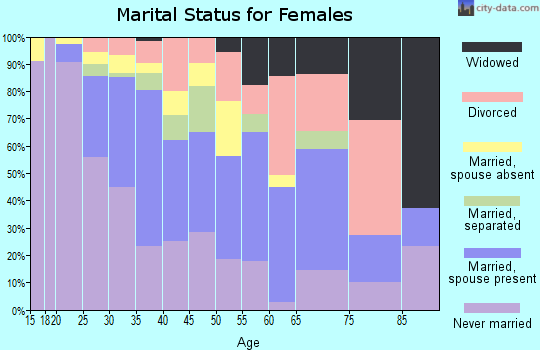
2,240 married couples with children.
1,333 single-parent households (444 men, 889 women).
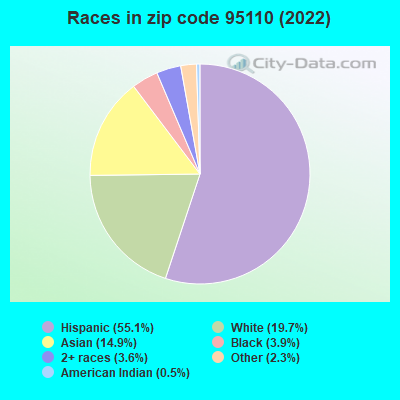
42.8% of residents of 95110 zip code speak English at home.
39.8% of residents speak Spanish at home (61% very well, 17% well, 17% not well, 4% not at all).
4.9% of residents speak other Indo-European language at home (92% very well, 4% well, 4% not well).
10.0% of residents speak Asian or Pacific Island language at home (64% very well, 18% well, 14% not well, 4% not at all).
1.7% of residents speak other language at home (23% very well, 60% well, 17% not well).
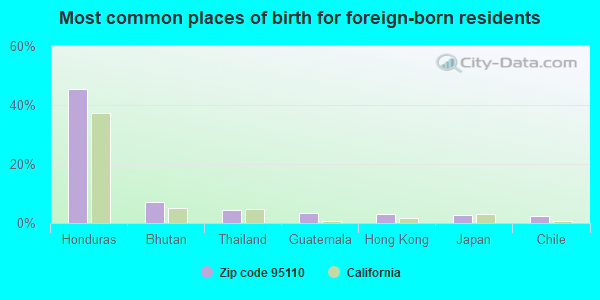
Foreign born population: 6,491 (32.2%) (34.2% of them are naturalized citizens)
Major facilities with environmental interests located in this zip code:
GUADALUPE RIVER PROJ CONST CONTR 3APH2 (200 RYLAND ST in SAN JOSE, CA) . Federal Facility. UNDETERMINED OR UNKNOWN AGENCY AFFILIATION
STATE MASTER (California - Hazardous Waste Tracking) - HAZARDOU WASTE PROGRAM Large Quantity Generators, more that 1000 kg of hazardous waste/month (Resource Conservation and Recovery Act (tracking hazardous waste)) TRANSPORTER (Resource Conservation and Recovery Act (tracking hazardous waste)) Business NAICS classification: LINE-HAUL RAILROADS. Organizations: UNION PACIFIC RAILROAD (CONTACT/OPERATOR)
FMC CORP (333 JULIAN ST in SAN JOSE, CA)
SUPERFUND (Superfund database) STATE MASTER (California - Hazardous Waste Tracking) - HAZARDOU WASTE PROGRAM Small Quantity Generators, between 100 kg and 1000 kg of hazardous waste/month (Resource Conservation and Recovery Act (tracking hazardous waste)) Alternative names: FMC CORP SAN JOSE ORDNANCE PLT
MUNICIPAL GARAGE CITY OF SAN JOSE (825 N SAN PEDRO ST in SAN JOSE, CA)
STATE MASTER (California - Hazardous Waste Tracking) - HAZARDOU WASTE PROGRAM Small Quantity Generators, between 100 kg and 1000 kg of hazardous waste/month (Resource Conservation and Recovery Act (tracking hazardous waste)) - notification Organizations: CITY CITY OF SAN JOSE (CONTACT/OWNER)
CARL A BUCHER PAINTING (790 CHESNUT STREET in SAN JOSE, CA)
STATE MASTER (California - Hazardous Waste Tracking) - HAZARDOU WASTE PROGRAM Small Quantity Generators, between 100 kg and 1000 kg of hazardous waste/month (Resource Conservation and Recovery Act (tracking hazardous waste)) - notification
ACME SAW SALES AND SERVICE (475 W JULIAN ST in SAN JOSE, CA)
STATE MASTER (California - Hazardous Waste Tracking) - HAZARDOU WASTE PROGRAM Small Quantity Generators, between 100 kg and 1000 kg of hazardous waste/month (Resource Conservation and Recovery Act (tracking hazardous waste)) - notification Organizations: KEN AND DOM OLIVET (CONTACT/OWNER)
K N T V (645 PARK AVE in SAN JOSE, CA)
STATE MASTER (California - Hazardous Waste Tracking) - HAZARDOU WASTE PROGRAM Small Quantity Generators, between 100 kg and 1000 kg of hazardous waste/month (Resource Conservation and Recovery Act (tracking hazardous waste)) - notification Organizations: K N T V TELEVISION INC (CONTACT/OWNER)
CHEVRON USA INC SAN JOSE CA ARPT (ARPT BLVD in SAN JOSE, CA)
STATE MASTER (California - Hazardous Waste Tracking) - HAZARDOU WASTE PROGRAM Small Quantity Generators, between 100 kg and 1000 kg of hazardous waste/month (Resource Conservation and Recovery Act (tracking hazardous waste)) Alternative names: CHEVRON 1001264 SJ AIRPORT
LEES DIESEL SERVICE CO (1125 LELONG ST in SAN JOSE, CA)
STATE MASTER (California - Hazardous Waste Tracking) - HAZARDOU WASTE PROGRAM Small Quantity Generators, between 100 kg and 1000 kg of hazardous waste/month (Resource Conservation and Recovery Act (tracking hazardous waste)) Business NAICS classification: GENERAL AUTOMOTIVE REPAIR.
ENVIROSYSTEMS INCORPORATED (1754 TECHNOLOGY DRIVE SUITE 106 in SAN JOSE, CA)
(Integrated Compliance Information System) - ICIS-09-2003-0155, FORMAL ENFORCEMENT ACTION COMPLIANCE ACTIVITY (Tracking inspections of insecticide, fungicide, and rodenticide, and toxic substances) Business SIC classification: SPECIALTY CLEANING, POLISHING, AND SANITATION PREPARATIONS
BACHRODT (WALTER L.) ELEMENTAR (102 SONORA AVE. in SAN JOSE, CA)
(National Center for Education Statistics) - STATE ID-6048730 Organizations: SAN JOSE UNIFIED (SCHOOL DISTRICT)
GOMEZ TRANSMISSION SPECIALIST CO (407 VINE ST in SAN JOSE, CA)
Small Quantity Generators, between 100 kg and 1000 kg of hazardous waste/month (Resource Conservation and Recovery Act (tracking hazardous waste)) Small Quantity Generators, between 100 kg and 1000 kg of hazardous waste/month (Resource Conservation and Recovery Act (tracking hazardous waste)) Organizations: GOMEZ MEL (CONTACT/OWNER)
, MEL GOMEZ (CONTACT/OWNER)
Alternative names: GOMEZ TRANSMISSIONS
LOCKHEED AIR TERMINAL INC (1661 AIRPORT BLVD in SAN JOSE, CA)
Small Quantity Generators, between 100 kg and 1000 kg of hazardous waste/month (Resource Conservation and Recovery Act (tracking hazardous waste)) - notification Small Quantity Generators, between 100 kg and 1000 kg of hazardous waste/month (Resource Conservation and Recovery Act (tracking hazardous waste)) - notification Organizations: CITY OF SAN JOSE (CONTACT/OWNER)
Alternative names: ATLANTIC AVIATION CA INC
AC LABEL CO (350 NO MONTGOMERY in SAN JOSE, CA)
(Resource Conservation and Recovery Act (tracking hazardous waste)) Business NAICS classification: PACKAGING MACHINERY MANUFACTURING. Organizations: LEWIS DI BONA (CONTACT/OWNER)
Alternative names: AC LABEL BERRYMAN PRODUCTS
Housing units lacking complete plumbing facilities: 0.4% Housing units lacking complete kitchen facilities: 1.6%
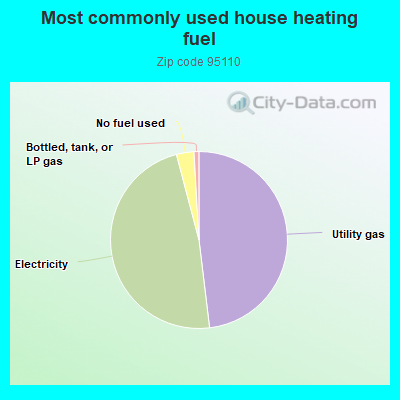
48.1%Utility gas
47.8%Electricity
3.2%No fuel used
0.9%Bottled, tank, or LP gas
Population in 1990: 17,437. Population change in the 1990s: +743 (+4.3%).
Place of birth for U.S.-born residents:
This state: 10,762
Northeast: 706
Midwest: 553
South: 876
West: 549
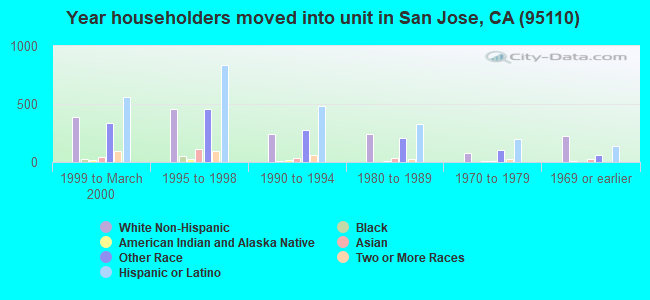
52% of the 95110 zip code residents lived in the same house 5 years ago. Out of people who lived in different houses, 74% lived in this county. Out of people who lived in different counties, 50% lived in California.
82% of the 95110 zip code residents lived in the same house 1 year ago. Out of people who lived in different houses, 55% moved from this county. Out of people who lived in different houses, 23% moved from different county within same state. Out of people who lived in different houses, 12% moved from different state. Out of people who lived in different houses, 7% moved from abroad.
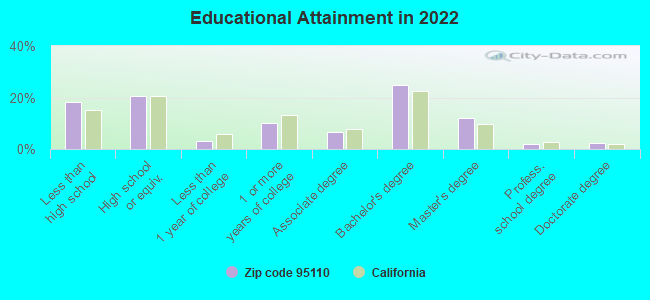
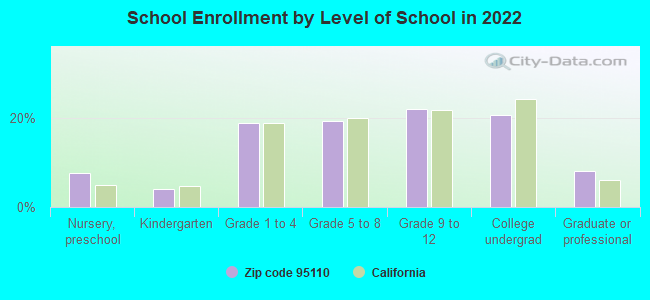
Private vs. public school enrollment:
Students in private schools in grades 1 to 8 (elementary and middle school): 123
Here:
7.4%
California:
10.5%
Students in private schools in grades 9 to 12 (high school): 67
Here:
6.9%
California:
8.5%
Students in private undergraduate colleges: 103
Here:
11.4%
California:
15.9%
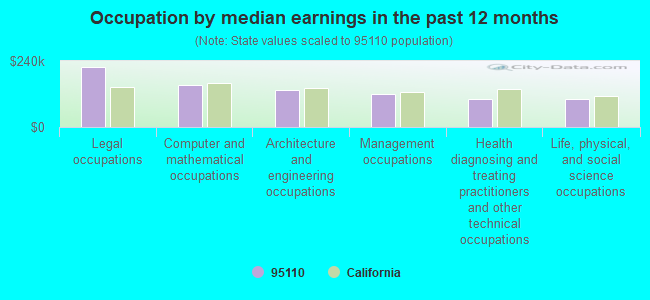
Occupation by median earnings in the past 12 months ($)
218,593Legal occupations
151,180Computer and mathematical occupations
133,890Architecture and engineering occupations
119,181Management occupations
102,792Health diagnosing and treating practitioners and other technical occupations
102,156Life, physical, and social science occupations
Companies with biggest federal contracts located in this zip code (SAN JOSE, CA):
UNITED DEFENSE INDUSTRIES, INC (1115 COLEMAN AVE) : $3,088,520 in 5 contractsfrom 2000 to 2002
Contracts for Electrical and Electronic Properties Measuring and Testing Instruments, Weapons Maintenance and Repair Shop Specialized Equipment by Army Signed by year:2000: $3,461,000; 2001: -$73,480; 2002: -$299,000; 2003: $0; 2004: $0; 2005: $0; 2006: $0.
Biggest contracts:
$1,975,000 with Army for Electrical and Electronic Properties Measuring and Testing Instruments. Signed on 2000-02-11. Completion date: 2000-12-15.
$1,092,000, same as above.Signed on 2000-08-23. Completion date: 2001-06-30.
$394,000 with Army for Weapons Maintenance and Repair Shop Specialized Equipment. Signed on 2000-07-04. Completion date: 2001-09-30.
-$73,480 with Army for Electrical and Electronic Properties Measuring and Testing Instruments. Signed on 2001-05-10. Completion date: 2001-05-30.
CCT TECHNOLOGIES INC (478 WEST SAN CARLOS STREET; small business) : $503,979 in 61 contractsfrom 2002 to 2006
Contracts for ADP Support Equipment, ADP Software, X-Ray Equipment and Supplies: Medical, Dental, Veterinary, Batteries, Rechargeable, and moreby Army Signed by year:2000: $0; 2001: $0; 2002: $88,050; 2003: $51,447; 2004: $208,279; 2005: $84,270; 2006: $71,933.
Biggest contracts:
$56,400 with Army for ADP Support Equipment. Taking place in PA. Signed on 2002-09-16. Completion date: 2002-09-30.
$39,450 with Army for ADP Support Equipment. Signed on 2004-04-01. Completion date: 2004-04-23.
$31,650 with Army for ADP Support Equipment. Taking place in PA. Signed on 2002-09-17. Completion date: 2002-09-27.
$22,990 with Army for ADP Software. Signed on 2006-06-12. Effective on 2006-06-08. Completion date: 2006-06-30.
CASSATT CORPORATION (1740 TECHNOLOGY DR # 600; small business)
$272,775 with Navy for Life Sciences -- Applied Research and Exploratory Development (R&D). Taking place in VA. Signed on 2005-05-02. Completion date: 2005-08-02.
ACM AVIATION,INC. (1475 AIRPORT BLVD; small business)
$229,268 with Defense Logistics Agency for Liquid Propellants and Fuels, Petroleum Base. Signed on 2000-03-02. Completion date: 2003-03-31.
STEPHENS MEAT PRODUCTS (105 SO MONTGOMERY STREET; small business) : $201,765 in 12 contractsfrom 2004 to 2005
Contracts for Food Items For Resale, Non-Food Items For Resale by Defense Commissary Agency Signed by year:2000: $0; 2001: $0; 2002: $0; 2003: $0; 2004: $75,591; 2005: $126,174; 2006: $0.
Biggest contracts:
$66,347 with Defense Commissary Agency for Food Items For Resale. Signed on 2004-10-01. Completion date: 2005-02-28.
$61,330, same as above.Signed on 2005-04-01. Completion date: 2005-08-31.
$30,716, same as above.Signed on 2005-01-01. Completion date: 2005-03-31.
$12,229, same as above.Signed on 2005-09-01. Completion date: 2005-09-30.
MENTORWARE, INC (2001 GATEWAY PLACE; small business) : $184,200 in 4 contractsfrom 2001 to 2004
$69,200 with Navy for ADP Software. Signed on 2001-09-25. Completion date: 2002-09-30.
$63,000 with Navy for ADP Support Equipment. Signed on 2004-03-23. Completion date: 2004-09-30.
$32,000 with Navy for ADP Software. Signed on 2003-09-06. Completion date: 2003-09-30.
$20,000 with Navy for Education Services. Signed on 2003-01-08. Completion date: 2003-01-29.
QPR SOFTWARE, INC (1735 TECHNOLOGY DR, STE 74; small business) : $99,347 in 2 contractsfrom 2001 to 2004
$79,000 with Navy for ADP Software. Taking place in MN. Signed on 2001-08-17. Completion date: 2001-09-07.
$20,347, same as above.Signed on 2004-12-13. Completion date: 2005-09-30.
PRIMEDIA INFORMATION INC (1735 TECHNOLOGY DRIVE STE) : $79,873 in 7 contractsfrom 2002 to 2006
Contracts for ADP Data Conversion Services, Communications Services, Newspapers and Periodicals, Print/Binding Services by Army, U.S. Army Corps of Engineers - civil program financing only Signed by year:2000: $0; 2001: $0; 2002: $11,305; 2003: $11,305; 2004: $45,956; 2005: $0; 2006: $11,307.
Biggest contracts:
$12,000 with Army for ADP Data Conversion Services. Signed on 2004-03-18. Completion date: 2004-04-14.
$12,000 with U.S. Army Corps of Engineers - civil program financing only for ADP Data Conversion Services. Signed on 2004-03-18. Completion date: 2004-04-14.
$11,307 with Army for Communications Services. Taking place in WA. Signed on 2006-03-06. Completion date: 2006-04-01.
$11,305 with U.S. Army Corps of Engineers - civil program financing only for Newspapers and Periodicals. Taking place in WA. Signed on 2002-12-17. Completion date: 2003-12-31.
CAD DESIGN SERVICES, INC (1731 TECHNOLOGY DR SUITE; small business) : $68,255 in 4 contractsfrom 2005 to 2006
$50,555 with NASA for ADP Software. Signed on 2005-04-05. Completion date: 2005-04-11.
$7,778, same as above.Signed on 2006-03-01. Completion date: 2007-03-01.
$4,961 with Navy for Maintenance, Repair and Rebuilding of Equipment -- Automatic Data Processing Equipment (Including Firmware), Software, Supplies and Support Equipment. Signed on 2006-03-15. Completion date: 2007-02-05.
$4,961, same as above.Signed on 2005-02-18. Completion date: 2006-02-06.
SEASOLVE SOFTWARE INC (1778 TECHNOLOGY DR; small business)
$58,756 with Navy for Electrical and Electronic Properties Measuring and Testing Instruments. Signed on 2006-03-28. Completion date: 2006-04-27.
Top industries in this zip code by the number of employees in 2005:
Administrative and Support and Waste Management and Remediation Services: Temporary Help Services (250-499: 2, 100-249: 2, 50-99: 6, 20-49: 3, 10-19: 2, 1-4: 5)
Accommodation and Food Services: Food Service Contractors (500-999: 1, 100-249: 2, 5-9: 2, 1-4: 1)
Professional, Scientific, and Technical Services: Process, Physical Distribution, and Logistics Consulting Services (500-999: 1, 100-249: 1, 1-4: 2)
2007 - 2018 National Fire Incident Reporting System (NFIRS) incidents
Based on the data from the years 2007 - 2018 the average number of fire incidents per year is 26. The highest number of fire incidents - 82 took place in 2017, and the least - 0 in 2008. The data has a constant trend.
When looking into fire subcategories, the most reports belonged to: Outside Fires (71.6%), and Structure Fires (13.1%).
Fire incident types reported to NFIRS in Zip Code 95110


 Nearest zip codes: 95126, 95113, 95112, 95053, 95128, 95131.
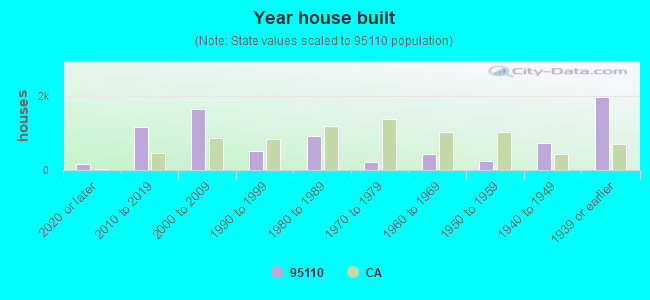


 . Federal Facility. UNDETERMINED OR UNKNOWN AGENCY AFFILIATION
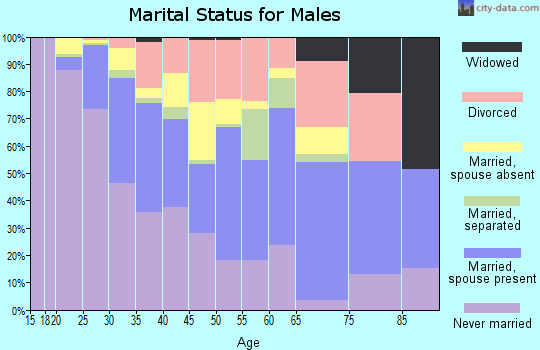

 Based on the data from the years 2007 - 2018 the average number of fire incidents per year is 26. The highest number of fire incidents - 82 took place in 2017, and the least - 0 in 2008. The data has a constant trend.
 When looking into fire subcategories, the most reports belonged to: Outside Fires (71.6%), and Structure Fires (13.1%).