Estimated zip code population in 2022: 58,287 Zip code population in 2010: 55,927 Zip code population in 2000: 52,331
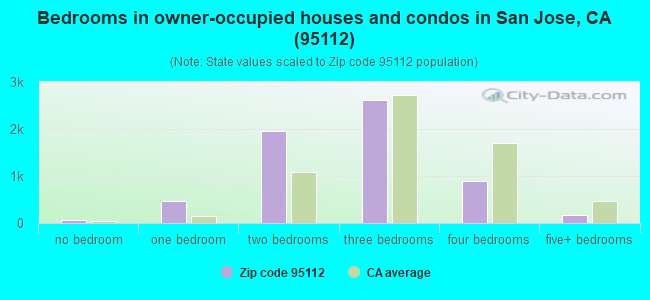
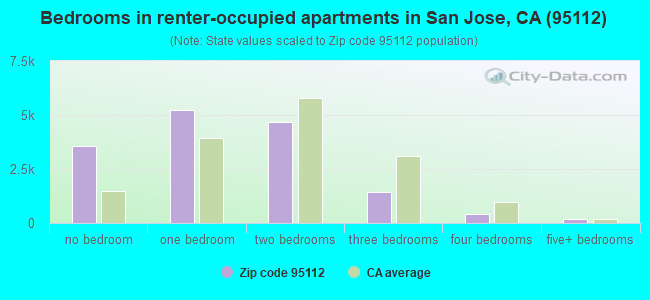
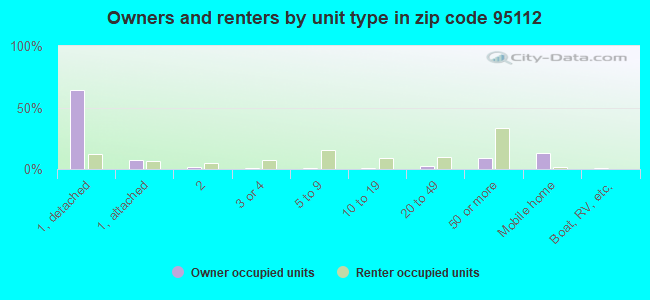
Houses and condos: 23,080 Renter-occupied apartments: 15,335
% of renters here:
71%
State:
44%
March 2022 cost of living index in zip code 95112: 125.3 (high, U.S. average is 100)
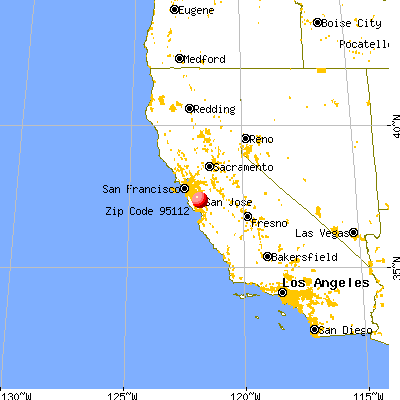
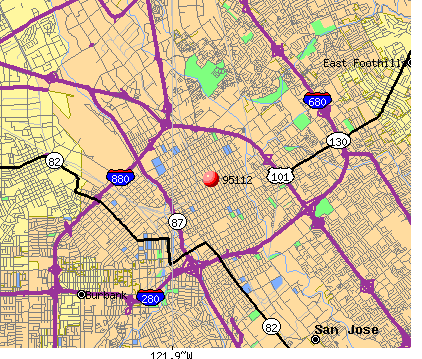
Land area: 7.1 sq. mi. Water area: 0.0 sq. mi.
Population density: 8,219 people per square mile
(high).
OSM Map
General Map
Google Map
MSN Map
OSM Map
General Map
Google Map
MSN Map
OSM Map
General Map
Google Map
MSN Map
OSM Map
General Map
Google Map
MSN Map
Please wait while loading the map...
Real estate property taxes paid for housing units in 2022:
This zip code:
0.7% ($6,992)
California:
0.7% ($4,831)
Median real estate property taxes paid for housing units with mortgages in 2022: $8,169 (0.8%) Median real estate property taxes paid for housing units with no mortgage in 2022: $4,075 (0.5%)
Averages for the 2020 tax year for zip code 95112, filed in 2021:
Average Adjusted Gross Income (AGI) in 2020: $82,876 (Individual Income Tax Returns)
Here:
$82,876
State:
$95,910
Salary/wage: $78,217 (reported on 87.4% of returns)
Here:
$78,217
State:
$77,331
(% of AGI for various income ranges: 1240.6% for AGIs below $25k, 4341.5% for AGIs $25k-50k, 7799.1% for AGIs $50k-75k, 11510.1% for AGIs $75k-100k, 22130.6% for AGIs $100k-200k, 124616.3% for AGIs over 200k)
Taxable interest for individuals: $1,084 (reported on 26.0% of returns)
This zip code:
$1,084
California:
$2,294
(% of AGI for various income ranges: 9.0% for AGIs below $25k, 9.7% for AGIs $25k-50k, 19.3% for AGIs $50k-75k, 42.8% for AGIs $75k-100k, 83.3% for AGIs $100k-200k, 655.0% for AGIs over 200k)
Ordinary dividends: $4,290 (reported on 17.8% of returns)
Here:
$4,290
State:
$10,949
(% of AGI for various income ranges: 13.8% for AGIs below $25k, 17.2% for AGIs $25k-50k, 42.4% for AGIs $50k-75k, 54.1% for AGIs $75k-100k, 193.3% for AGIs $100k-200k, 2274.4% for AGIs over 200k)
Net capital gain/loss in AGI: +$23,593 (reported on 18.6% of returns)
Here:
+$23,593
State:
+$49,306
(% of AGI for various income ranges: 9.3% for AGIs below $25k, 21.1% for AGIs $25k-50k, 66.2% for AGIs $50k-75k, 190.2% for AGIs $75k-100k, 500.0% for AGIs $100k-200k, 17875.4% for AGIs over 200k)
Profit/loss from business: +$11,895 (reported on 14.3% of returns)
Here:
+$11,895
State:
+$15,671
(% of AGI for various income ranges: 181.8% for AGIs below $25k, 166.1% for AGIs $25k-50k, 172.3% for AGIs $50k-75k, 253.4% for AGIs $75k-100k, 410.2% for AGIs $100k-200k, 2063.0% for AGIs over 200k)
Taxable individual retirement arrangement distribution: $19,373 (reported on 3.0% of returns)
95112:
$19,373
California:
$23,505
(% of AGI for various income ranges: 18.3% for AGIs below $25k, 28.8% for AGIs $25k-50k, 56.0% for AGIs $50k-75k, 93.0% for AGIs $75k-100k, 247.5% for AGIs $100k-200k, 946.3% for AGIs over 200k)
Self-employed (Keogh) retirement plans: $18,264 (reported on 0.4% of returns)
95112:
$18,264
California:
$30,163
(% of AGI for various income ranges: 11.5% for AGIs $50k-75k, 25.9% for AGIs $100k-200k, 217.4% for AGIs over 200k)
Total itemized deductions: $30,453 (reported on 11.0% of returns)
Here:
$30,453
State:
$39,517
(% of AGI for various income ranges: 45.4% for AGIs below $25k, 86.9% for AGIs $25k-50k, 275.5% for AGIs $50k-75k, 557.6% for AGIs $75k-100k, 1341.7% for AGIs $100k-200k, 6837.8% for AGIs over 200k)
Charity contributions: $5,879 (reported on 8.3% of returns)
Here:
$5,879
State:
$12,598
(% of AGI for various income ranges: 2.3% for AGIs below $25k, 6.7% for AGIs $25k-50k, 33.3% for AGIs $50k-75k, 58.2% for AGIs $75k-100k, 189.9% for AGIs $100k-200k, 1210.7% for AGIs over 200k)
Taxes paid: $9,161 (reported on 11.0% of returns)
95112:
$9,161
State:
$8,807
(% of AGI for various income ranges: 10.6% for AGIs below $25k, 24.3% for AGIs $25k-50k, 77.6% for AGIs $50k-75k, 184.9% for AGIs $75k-100k, 458.8% for AGIs $100k-200k, 1874.1% for AGIs over 200k)
Earned income credit: $1,691 (reported on 11.6% of returns)
Here:
$1,691
State:
$2,074
(% of AGI for various income ranges: 67.0% for AGIs below $25k, 42.8% for AGIs $25k-50k, 0.5% for AGIs $50k-75k)
Percentage of individuals using paid preparers for their 2020 taxes: 91.6%
Here:
92%
State:
92%
(% for various income ranges: 89.6% for AGIs below $25k, 91.5% for AGIs $25k-50k, 91.5% for AGIs $50k-75k, 92.9% for AGIs $75k-100k, 92.9% for AGIs $100k-200k, 95.3% for AGIs over 200k)
Averages for the 2012 tax year for zip code 95112, filed in 2013:
Average Adjusted Gross Income (AGI) in 2012: $52,529 (Individual Income Tax Returns)
Here:
$52,529
State:
$72,726
Salary/wage: $50,712 (reported on 88.7% of returns)
Here:
$50,712
State:
$59,079
(% of AGI for various income ranges: 80.8% for AGIs below $25k, 88.7% for AGIs $25k-50k, 88.8% for AGIs $50k-75k, 87.0% for AGIs $75k-100k, 88.5% for AGIs $100k-200k, 79.1% for AGIs over 200k)
Taxable interest for individuals: $802 (reported on 25.2% of returns)
This zip code:
$802
California:
$2,146
(% of AGI for various income ranges: 0.4% for AGIs below $25k, 0.3% for AGIs $25k-50k, 0.3% for AGIs $50k-75k, 0.3% for AGIs $75k-100k, 0.3% for AGIs $100k-200k, 0.6% for AGIs over 200k)
Ordinary dividends: $3,112 (reported on 12.8% of returns)
Here:
$3,112
State:
$9,308
(% of AGI for various income ranges: 0.5% for AGIs below $25k, 0.4% for AGIs $25k-50k, 0.5% for AGIs $50k-75k, 0.8% for AGIs $75k-100k, 0.7% for AGIs $100k-200k, 1.4% for AGIs over 200k)
Net capital gain/loss in AGI: +$6,738 (reported on 12.2% of returns)
Here:
+$6,738
State:
+$30,460
(% of AGI for various income ranges: 0.3% for AGIs $50k-75k, 0.5% for AGIs $75k-100k, 1.0% for AGIs $100k-200k, 5.7% for AGIs over 200k)
Profit/loss from business: +$14,162 (reported on 13.5% of returns)
Here:
+$14,162
State:
+$17,064
(% of AGI for various income ranges: 9.1% for AGIs below $25k, 3.4% for AGIs $25k-50k, 2.5% for AGIs $50k-75k, 2.2% for AGIs $75k-100k, 2.2% for AGIs $100k-200k, 4.4% for AGIs over 200k)
Taxable individual retirement arrangement distribution: $13,176 (reported on 3.6% of returns)
95112:
$13,176
California:
$19,557
(% of AGI for various income ranges: 1.1% for AGIs below $25k, 1.0% for AGIs $25k-50k, 0.8% for AGIs $50k-75k, 1.0% for AGIs $75k-100k, 1.1% for AGIs $100k-200k, 0.5% for AGIs over 200k)
Self-employment retirement plans: $17,490 (reported on 0.4% of returns)
95112:
$17,490
California:
$24,530
(% of AGI for various income ranges: 0.2% for AGIs $50k-75k, 0.1% for AGIs $100k-200k, 0.4% for AGIs over 200k)
Total itemized deductions: $26,610 (22% of AGI, reported on 24.4% of returns)
Here:
$26,610
State:
$34,004
Here:
21.6% of AGI
State:
22.7% of AGI
(% of AGI for various income ranges: 5.3% for AGIs below $25k, 6.2% for AGIs $25k-50k, 9.9% for AGIs $50k-75k, 14.9% for AGIs $75k-100k, 16.8% for AGIs $100k-200k, 15.8% for AGIs over 200k)
Charity contributions: $2,632 (reported on 17.5% of returns)
Here:
$2,632
State:
$4,659
(% of AGI for various income ranges: 0.2% for AGIs below $25k, 0.4% for AGIs $25k-50k, 0.7% for AGIs $50k-75k, 1.2% for AGIs $75k-100k, 1.1% for AGIs $100k-200k, 1.2% for AGIs over 200k)
Taxes paid: $11,922 (reported on 24.4% of returns)
95112:
$11,922
State:
$14,448
(% of AGI for various income ranges: 1.1% for AGIs below $25k, 1.5% for AGIs $25k-50k, 3.4% for AGIs $50k-75k, 5.6% for AGIs $75k-100k, 7.9% for AGIs $100k-200k, 9.5% for AGIs over 200k)
Earned income credit: $1,828 (reported on 18.6% of returns)
Here:
$1,828
State:
$2,286
(% of AGI for various income ranges: 4.8% for AGIs below $25k, 0.9% for AGIs $25k-50k)
Percentage of individuals using paid preparers for their 2012 taxes: 58.7%
Here:
59%
State:
64%
(% for various income ranges: 57.6% for AGIs below $25k, 63.8% for AGIs $25k-50k, 58.4% for AGIs $50k-75k, 55.7% for AGIs $75k-100k, 52.9% for AGIs $100k-200k, 59.4% for AGIs over 200k)
Averages for the 2004 tax year for zip code 95112, filed in 2005:
Average Adjusted Gross Income (AGI) in 2004: $43,286 (Individual Income Tax Returns)
Here:
$43,286
State:
$58,600
Salary/wage: $41,799 (reported on 89.2% of returns)
Here:
$41,799
State:
$49,455
(% of AGI for various income ranges: 183.8% for AGIs below $10k, 85.0% for AGIs $10k-25k, 91.1% for AGIs $25k-50k, 90.9% for AGIs $50k-75k, 88.8% for AGIs $75k-100k, 76.9% for AGIs over 100k)
Taxable interest for individuals: $1,031 (reported on 32.1% of returns)
This zip code:
$1,031
California:
$2,365
(% of AGI for various income ranges: 6.7% for AGIs below $10k, 0.8% for AGIs $10k-25k, 0.6% for AGIs $25k-50k, 0.6% for AGIs $50k-75k, 0.6% for AGIs $75k-100k, 0.8% for AGIs over 100k)
Taxable dividends: $1,895 (reported on 14.2% of returns)
Here:
$1,895
State:
$4,746
(% of AGI for various income ranges: 4.0% for AGIs below $10k, 0.6% for AGIs $10k-25k, 0.3% for AGIs $25k-50k, 0.4% for AGIs $50k-75k, 0.5% for AGIs $75k-100k, 0.9% for AGIs over 100k)
Net capital gain/loss: +$9,749 (reported on 14.4% of returns)
Here:
+$9,749
State:
+$23,418
(% of AGI for various income ranges: -0.4% for AGIs below $10k, 0.1% for AGIs $10k-25k, 0.1% for AGIs $25k-50k, 0.4% for AGIs $50k-75k, 0.9% for AGIs $75k-100k, 8.7% for AGIs over 100k)
Profit/loss from business: +$11,439 (reported on 12.3% of returns)
Here:
+$11,439
State:
+$16,826
(% of AGI for various income ranges: 1.7% for AGIs below $10k, 5.9% for AGIs $10k-25k, 2.8% for AGIs $25k-50k, 2.6% for AGIs $50k-75k, 2.8% for AGIs $75k-100k, 3.3% for AGIs over 100k)
IRA payment deduction: $2,763 (reported on 1.7% of returns)
95112:
$2,763
California:
$3,192
(% of AGI for various income ranges: 0.5% for AGIs below $10k, 0.1% for AGIs $10k-25k, 0.2% for AGIs $25k-50k, 0.1% for AGIs $50k-75k, 0.1% for AGIs $75k-100k, 0.1% for AGIs over 100k)
Self-employed pension: $13,385 (reported on 0.7% of returns)
Here:
$13,385
California:
$17,688
(% of AGI for various income ranges: 0.1% for AGIs $25k-50k, 0.1% for AGIs $50k-75k, 0.1% for AGIs $75k-100k, 0.5% for AGIs over 100k)
Total itemized deductions: $23,318 (26% of AGI, reported on 27.2% of returns)
Here:
$23,318
State:
$28,113
Here:
25.5% of AGI
State:
25.3% of AGI
(% of AGI for various income ranges: 21.5% for AGIs below $10k, 6.4% for AGIs $10k-25k, 9.5% for AGIs $25k-50k, 16.3% for AGIs $50k-75k, 18.7% for AGIs $75k-100k, 18.1% for AGIs over 100k)
Charity contributions deductions: $2,252 (2% of AGI, reported on 22.3% of returns)
Here:
$2,252
State:
$3,923
Here:
2.3% of AGI
State:
3.3% of AGI
(% of AGI for various income ranges: 0.8% for AGIs below $10k, 0.4% for AGIs $10k-25k, 0.7% for AGIs $25k-50k, 1.4% for AGIs $50k-75k, 1.5% for AGIs $75k-100k, 1.5% for AGIs over 100k)
Total tax: $6,977 (reported on 72.9% of returns)
95112:
$6,977
State:
$10,761
(% of AGI for various income ranges: 6.2% for AGIs below $10k, 4.0% for AGIs $10k-25k, 7.1% for AGIs $25k-50k, 10.2% for AGIs $50k-75k, 12.3% for AGIs $75k-100k, 18.0% for AGIs over 100k)
Earned income credit: $1,483 (reported on 14.2% of returns)
Here:
$1,483
State:
$1,763
Percentage of individuals using paid preparers for their 2004 taxes: 62.2%
Here:
62%
State:
66%
(% for various income ranges: 54.3% for AGIs below $10k, 66.5% for AGIs $10k-25k, 65.1% for AGIs $25k-50k, 61.4% for AGIs $50k-75k, 58.5% for AGIs $75k-100k, 59.5% for AGIs over 100k)
Likely homosexual households (counted as self-reported same-sex unmarried-partner households)
Lesbian couples: 0.2% of all households
Gay men: 0.6% of all households
Household received Food Stamps/SNAP in the past 12 months: 2,812 Household did not receive Food Stamps/SNAP in the past 12 months: 18,761
Women who had a birth in the past 12 months: 603 (328 now married, 276 unmarried) Women who did not have a birth in the past 12 months: 16,364 (4,199 now married, 12,260 unmarried)
Housing units in zip code 95112 with a mortgage: 4,144 (404 second mortgage, 266 both second mortgage and home equity loan) Houses without a mortgage: 45
Median monthly owner costs for units with a mortgage: $3,344 Median monthly owner costs for units without a mortgage: $844
Residents with income below the poverty level in 2022:
This zip code:
17.8%
Whole state:
12.2%
Residents with income below 50% of the poverty level in 2022:
This zip code:
7.3%
Whole state:
6.2%
Median number of rooms in houses and condos:
Here:
5.5
State:
6.0
Median number of rooms in apartments:
Here:
3.0
State:
3.9
Notable locations in this zip code not listed on our city pages
Notable locations in zip code 95112: Washington Square (A), Washington Square Hall (B), Washburn Hall (C), Wahlquist Library (D), Wahlquist Hall (E), Tower Hall (F), Sweeney Hall (G), Spartan Memorial (H), Spartan Complex (I), Royce Hall (J), Moulder Hall (K), Morris Dailey Auditorium (L), Markham Hall (M), MacQuarrie Hall (N), Joe West Hall (O), Hugh Gillis Hall (P), Hoover Hall (Q), Dwight Bentel Hall (R), Duncan Hall (S), Dudley Moorhead Hall (T). Display/hide their locations on the map
Churches in zip code 95112 include: Divine Love Christian Fellowship Church (A), Church of Scientology (B), Buddhist Church Betsuin (C), Church of Christ (D), Greater Church of Jesus Christ (E), Hoa Hao Buddhist Church (F), Holy Cross Church (G), Iglesia Misionera (H), Oriental Christian Center (I). Display/hide their locations on the map
Parks in zip code 95112 include: Backesto Park (1), San Jose Municipal Baseball Stadium (2), Saint James Square (3), Cadwallader Park (4), Spartan Stadium (5), Kelley Park (6), Saint James Square Historic District (7), Bernal Park (8), Hensely Historic District (9). Display/hide their locations on the map
4,451 married couples with children.
2,245 single-parent households (659 men, 1,586 women).
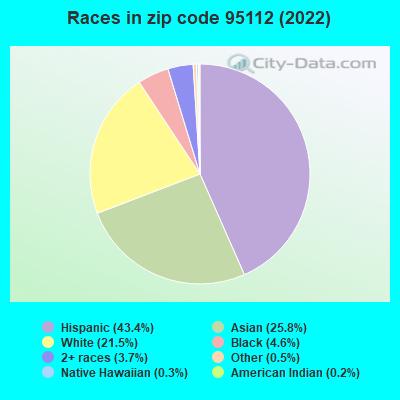
45.6% of residents of 95112 zip code speak English at home.
30.4% of residents speak Spanish at home (65% very well, 16% well, 16% not well, 4% not at all).
3.4% of residents speak other Indo-European language at home (77% very well, 21% well, 2% not well).
18.9% of residents speak Asian or Pacific Island language at home (47% very well, 22% well, 25% not well, 6% not at all).
1.4% of residents speak other language at home (73% very well, 27% well).
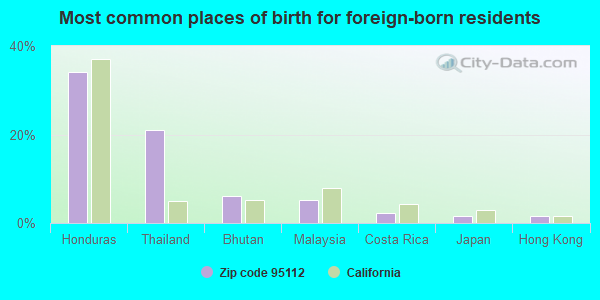
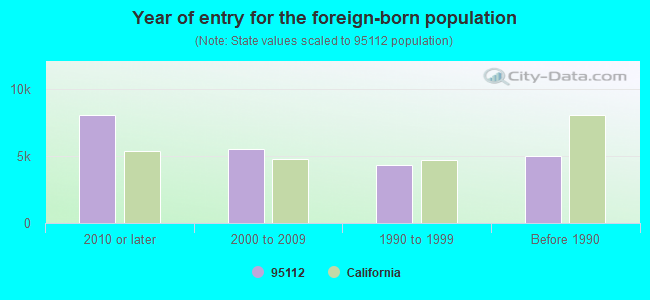
Foreign born population: 20,943 (35.9%) (52.3% of them are naturalized citizens)
Major facilities with environmental interests located in this zip code:
LORENTZ BARREL & DRUM CO INC (1515 S 10TH ST in SAN JOSE, CA)
SUPERFUND NPL (Superfund database) STATE MASTER (California - Hazardous Waste Tracking) - HAZARDOU WASTE PROGRAM (Integrated Compliance Information System) - ICIS-09-1996-0028, FORMAL ENFORCEMENT ACTION, ICIS-09-2002-0034, ICIS-09-2003-0005, ICIS-09-2002-0184, ICIS-09-2005-0079, ENFORCEMENT/COMPLIANCE ACTIVITY (Resource Conservation and Recovery Act (tracking hazardous waste)) Organizations: LORENTZ ERNEST (CONTACT/OWNER)
Alternative names: L B & D, LORENTZ BARREL & DRUM TRUST
HAROS METAL FINISHING INC (439 REYNOLDS CIRCLE in SAN JOSE, CA)
STATE MASTER (California - Hazardous Waste Tracking) - HAZARDOU WASTE PROGRAM (Integrated Compliance Information System) - ICIS-09-2002-0055, FORMAL ENFORCEMENT ACTION HAZARDOUS WASTE BIENNIAL REPORTER (Resource Conservation and Recovery Act (tracking hazardous waste)) Large Quantity Generators, more that 1000 kg of hazardous waste/month (Resource Conservation and Recovery Act (tracking hazardous waste)) TRI REPORTER (Tracking of toxic chemicals releasing facilities) Business SIC classification: ELECTROPLATING, PLATING, POLISHING, ANODIZING, AND COLORING Business NAICS classification: OTHER COMPUTER RELATED SERVICES.
NORANDA RECYCLING INC (1695 MONTEREY HIGHWAY in SAN JOSE, CA)
STATE MASTER (California - Hazardous Waste Tracking) - HAZARDOU WASTE PROGRAM CRITERIA AND HAZARDOUS AIR POLLUTANT INVENTORY (Inventory of air pollution sources) HAZARDOUS WASTE BIENNIAL REPORTER (Resource Conservation and Recovery Act (tracking hazardous waste)) Large Quantity Generators, more that 1000 kg of hazardous waste/month (Resource Conservation and Recovery Act (tracking hazardous waste)) TSD (Resource Conservation and Recovery Act (tracking hazardous waste)) TRI REPORTER (Tracking of toxic chemicals releasing facilities) Business SIC classification: SECONDARY SMELTING AND REFINING OF NONFERROUS METALS; SCRAP AND WASTE MATERIALS Organizations: NORANDA RECYCLING INC. (CONTACT/OPERATOR)
, PENINSULA DEVELOPERS LLP (CONTACT/OWNER)
Alternative names: MICRO METALLICS CORP.
CARDINAL INDUSTRIAL FINISHES INCORPORATED (890 COMMERCIAL ST. in SAN JOSE, CA)
STATE MASTER (California - Hazardous Waste Tracking) - HAZARDOU WASTE PROGRAM CRITERIA AND HAZARDOUS AIR POLLUTANT INVENTORY (Inventory of air pollution sources) HAZARDOUS WASTE BIENNIAL REPORTER (Resource Conservation and Recovery Act (tracking hazardous waste)) Large Quantity Generators, more that 1000 kg of hazardous waste/month (Resource Conservation and Recovery Act (tracking hazardous waste)) TRI REPORTER (Tracking of toxic chemicals releasing facilities) Business SIC classification: PAINTS, VARNISHES, LACQUERS, ENAMELS, AND ALLIED PRODUCTS Business NAICS classification: PAINT AND COATING MANUFACTURING. Organizations: EARL PELLEGRINI (CONTACT/OWNER)
Alternative names: CARDINAL IND FINISHES SAN JOSE
ADVANCED COMPONENT LABS U S A (270 EAST BROKAW ROAD in SAN JOSE, CA)
STATE MASTER (California - Hazardous Waste Tracking) - HAZARDOU WASTE PROGRAM CRITERIA AND HAZARDOUS AIR POLLUTANT INVENTORY (Inventory of air pollution sources) (Resource Conservation and Recovery Act (tracking hazardous waste)) Business SIC classification: PRINTED CIRCUIT BOARDS Alternative names: ADVANCED COMPONENT LABS INC
ALTERNATIVE MATERIALS TECHNOLOGY (520 PARROT STREET in SAN JOSE, CA)
STATE MASTER (California - Hazardous Waste Tracking) - HAZARDOU WASTE PROGRAM Small Quantity Generators, between 100 kg and 1000 kg of hazardous waste/month (Resource Conservation and Recovery Act (tracking hazardous waste)) - notification TRI REPORTER (Tracking of toxic chemicals releasing facilities) Business SIC classification: PAINTS, VARNISHES, LACQUERS, ENAMELS, AND ALLIED PRODUCTS Alternative names: U S CELLULOSE COMPANY INCORPORATED, U. S. CELLULOSE- ALTERNATIVE MATERIALS TECH. INC., US CELLULOSE CO, INC
A & E ANODIZING COMPANY INCORPORATED (652A CHARLES STREET in SAN JOSE, CA)
STATE MASTER (California - Hazardous Waste Tracking) - HAZARDOU WASTE PROGRAM HAZARDOUS WASTE BIENNIAL REPORTER (Resource Conservation and Recovery Act (tracking hazardous waste)) Small Quantity Generators, between 100 kg and 1000 kg of hazardous waste/month (Resource Conservation and Recovery Act (tracking hazardous waste)) - notification Organizations: EDUARDO IBANEZ (CONTACT/OPERATOR)
, W AND I INVESTMENTS (CONTACT/OWNER)
Alternative names: A AND E ANODIZING CO INC
CALTRANS - SAN JOSE MAINTENANCE & SHOP (500 QUEENS LANE in SAN JOSE, CA)
STATE MASTER (California - Hazardous Waste Tracking) - HAZARDOU WASTE PROGRAM HAZARDOUS WASTE BIENNIAL REPORTER (Resource Conservation and Recovery Act (tracking hazardous waste)) Large Quantity Generators, more that 1000 kg of hazardous waste/month (Resource Conservation and Recovery Act (tracking hazardous waste)) Alternative names: CALTRANS DISTRICT 4
NOTRE DAME HIGH SCHOOL (596 SOUTH SECOND STREET in SAN JOSE, CA)
STATE MASTER (California - Hazardous Waste Tracking) - HAZARDOU WASTE PROGRAM Large Quantity Generators, more that 1000 kg of hazardous waste/month (Resource Conservation and Recovery Act (tracking hazardous waste)) - notification Organizations: SISTERS OF NOTRE DAME (CONTACT/OWNER)
MAC CAL COMPANY (1737 JUNCTION AVE in SAN JOSE, CA)
STATE MASTER (California - Hazardous Waste Tracking) - HAZARDOU WASTE PROGRAM Small Quantity Generators, between 100 kg and 1000 kg of hazardous waste/month (Resource Conservation and Recovery Act (tracking hazardous waste)) Small Quantity Generators, between 100 kg and 1000 kg of hazardous waste/month (Resource Conservation and Recovery Act (tracking hazardous waste)) - notification Organizations: MICHAEL HALL (CONTACT/OWNER)
Alternative names: HY-LINE INDUSTRIAL COATINGS
BABBITT BEARING COMPANY INCORPORATED (1170 N 5TH STREET in SAN JOSE, CA)
STATE MASTER (California - Hazardous Waste Tracking) - HAZARDOU WASTE PROGRAM CRITERIA AND HAZARDOUS AIR POLLUTANT INVENTORY (Inventory of air pollution sources) Small Quantity Generators, between 100 kg and 1000 kg of hazardous waste/month (Resource Conservation and Recovery Act (tracking hazardous waste)) - notification TRI REPORTER (Tracking of toxic chemicals releasing facilities) Business SIC classification: ELECTROPLATING, PLATING, POLISHING, ANODIZING, AND COLORING; INDUSTRIAL AND COMMERCIAL MACHINERY AND EQUIPMENT Organizations: STANLEY SINN AND JERRY MANN (CONTACT/OWNER)
Alternative names: BABBIT BEARING
HITEK PRODUCT FINISHING INCORPORATED (1704 SOUTH 7TH STREET in SAN JOSE, CA)
STATE MASTER (California - Hazardous Waste Tracking) - HAZARDOU WASTE PROGRAM HAZARDOUS WASTE BIENNIAL REPORTER (Resource Conservation and Recovery Act (tracking hazardous waste)) Large Quantity Generators, more that 1000 kg of hazardous waste/month (Resource Conservation and Recovery Act (tracking hazardous waste)) Business NAICS classification: ELECTROPLATING, PLATING, POLISHING, ANODIZING, AND COLORING. Alternative names: SAUSEDO METAL PRODUCTS PLATING
ADVANCE CIRCUIT SERVICES (1181 N FOURTH ST STE B in SAN JOSE, CA) . Federal Facility
STATE MASTER (California - Hazardous Waste Tracking) - HAZARDOU WASTE PROGRAM HAZARDOUS WASTE BIENNIAL REPORTER (Resource Conservation and Recovery Act (tracking hazardous waste)) Small Quantity Generators, between 100 kg and 1000 kg of hazardous waste/month (Resource Conservation and Recovery Act (tracking hazardous waste)) - notification Business NAICS classification: BARE PRINTED CIRCUIT BOARD MANUFACTURING. Organizations: ADVANCED SURFACE FINISHING INC (CONTACT/OPERATOR)
, DEFRANCO ENTERPRISES (CONTACT/OWNER)
Alternative names: ADVANCE CICUIT SERVICES
Housing units lacking complete plumbing facilities: 1.5% Housing units lacking complete kitchen facilities: 2.2%
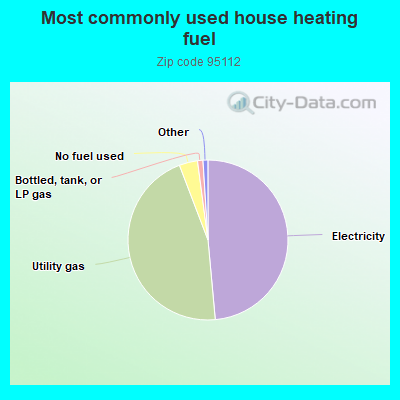
48.6%Electricity
45.7%Utility gas
3.7%No fuel used
1.1%Bottled, tank, or LP gas
Population in 1990: 46,470. Population change in the 1990s: +5,861 (+12.6%).
Place of birth for U.S.-born residents:
This state: 29,211
Northeast: 1,659
Midwest: 1,612
South: 2,279
West: 1,330
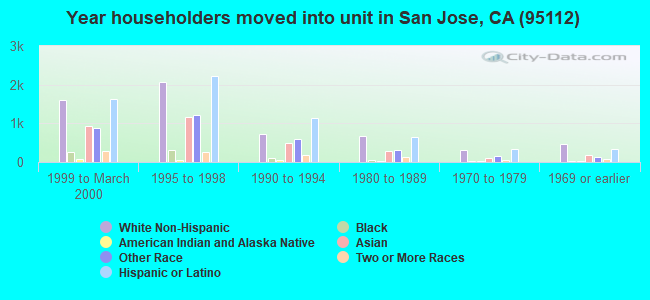
47% of the 95112 zip code residents lived in the same house 5 years ago. Out of people who lived in different houses, 67% lived in this county. Out of people who lived in different counties, 50% lived in California.
82% of the 95112 zip code residents lived in the same house 1 year ago. Out of people who lived in different houses, 62% moved from this county. Out of people who lived in different houses, 23% moved from different county within same state. Out of people who lived in different houses, 6% moved from different state. Out of people who lived in different houses, 6% moved from abroad.
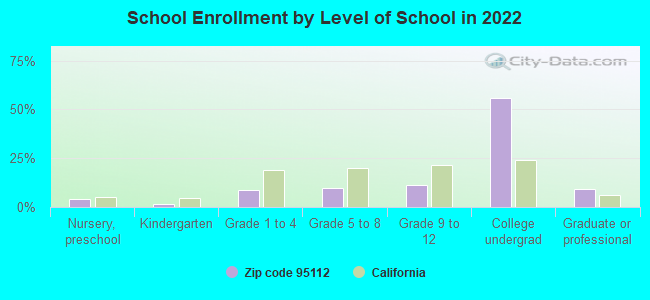
Private vs. public school enrollment:
Students in private schools in grades 1 to 8 (elementary and middle school): 332
Here:
9.9%
California:
10.5%
Students in private schools in grades 9 to 12 (high school): 192
Here:
9.6%
California:
8.5%
Students in private undergraduate colleges: 1,133
Here:
11.3%
California:
15.9%
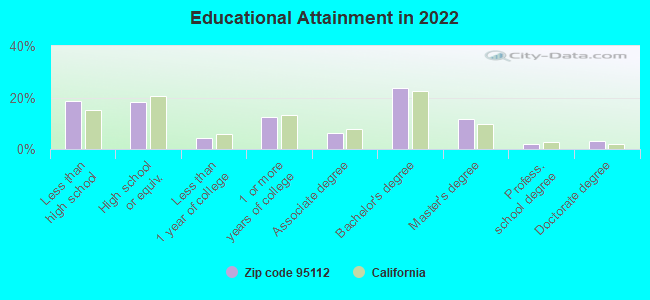
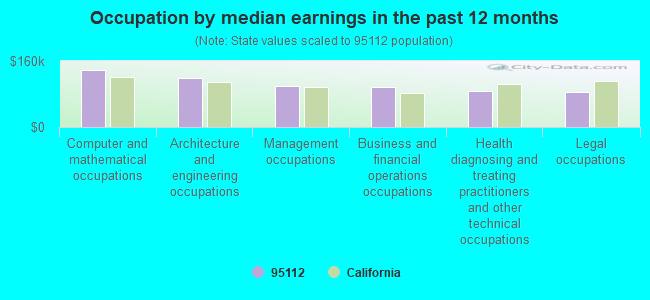
Occupation by median earnings in the past 12 months ($)
138,887Computer and mathematical occupations
118,120Architecture and engineering occupations
99,350Management occupations
96,398Business and financial operations occupations
87,946Health diagnosing and treating practitioners and other technical occupations
85,760Legal occupations
Companies with biggest federal contracts located in this zip code (SAN JOSE, CA):
KED CONSTRUCTION (1192 S 2ND ST; small business) : $8,422,159 in 48 contractsfrom 2000 to 2006
Contracts for Maintenance, Repair or Alteration of Real Property -- Ship Construction and Repair Facilities, Maintenance, Repair or Alteration of Real Property -- Miscellaneous Buildings, Maintenance, Repair or Alteration of Real Property -- Other Non-Building Facilities, Construction of Structures and Facilities -- Other Non-Building Facilities, and moreby NASA, Army, U.S. Army Corps of Engineers - civil program financing only, Bureau of Reclamation, and others Signed by year:2000: $447,719; 2001: $1,226,937; 2002: $686,183; 2003: $1,090,000; 2004: $2,773,370; 2005: $2,018,771; 2006: $179,179.
Biggest contracts:
$1,218,500 with NASA for Maintenance, Repair or Alteration of Real Property -- Ship Construction and Repair Facilities. Signed on 2004-02-10. Completion date: 2004-09-07.
$920,100 with Army for Maintenance, Repair or Alteration of Real Property -- Miscellaneous Buildings. Signed on 2004-08-12. Completion date: 2004-10-15.
$910,457 with U.S. Army Corps of Engineers - civil program financing only for Maintenance, Repair or Alteration of Real Property -- Other Non-Building Facilities. Signed on 2001-07-17. Completion date: 2001-11-30.
$714,341 with Army for Maintenance, Repair or Alteration of Real Property -- Other Non-Building Facilities. Signed on 2005-09-07. Completion date: 2006-11-30.
BURKE INDUSTRIES INC (2250 S TENTH STREET; small business) : $6,123,875 in 176 contractsfrom 2000 to 2006
Contracts for Airframe Structural Components, Miscellaneous Aircraft Accessories and Components, Packing and Gasket Materials, Miscellaneous Fabricated Nonmetallic Materials, and moreby Navy, Defense Logistics Agency, Bureau of Prisoners/Federal Prison System Signed by year:2000: $280,708; 2001: $2,011,219; 2002: $1,127,022; 2003: $1,633,020; 2004: $423,132; 2005: $614,239; 2006: $34,535.
Biggest contracts:
$1,066,050 with Navy for Airframe Structural Components. Taking place in MA. Signed on 2003-03-05. Completion date: 2004-03-05.
$819,180, same as above.Signed on 2001-10-11. Completion date: 2002-04-15.
$789,210, same as above.Signed on 2001-11-07. Completion date: 2001-11-07.
$499,800, same as above.Signed on 2002-11-19. Completion date: 2003-11-19.
PEMSTAR PACIFIC CONSULTANTS, I (2020 SOUTH 10TH STREET; small business) : $3,655,500 in 7 contractsfrom 2001 to 2006
Contracts for Other Defense -- Operational Systems Development (R&D), Engineering and Technical Services, Communications Security Equipment and Components, Fire Control Computing Sights and Devices by Army Signed by year:2000: $0; 2001: $1,800,000; 2002: $7,500; 2003: $0; 2004: $0; 2005: $491,700; 2006: $1,356,300.
Biggest contracts:
$1,800,000 with Army for Other Defense -- Operational Systems Development (R&D). Taking place in VA. Signed on 2001-08-30. Completion date: 2002-08-01.
$713,300 with Army for Engineering and Technical Services. Signed on 2006-06-14. Effective on 2006-06-13. Completion date: 2007-03-31.
$567,000 with Army for Communications Security Equipment and Components. Signed on 2006-03-02. Completion date: 2005-12-09.
$491,700, same as above.Signed on 2005-08-03. Completion date: 2005-12-09.
GENERAL LASERTRONICS CORP (830 JURY COURT; small business) : $1,014,890 in 5 contractsfrom 2001 to 2004
Contracts for Other Research and Development -- Management and Support (R&D), Other Defense -- Management and Support (R&D), Miscellaneous Maintenance and Repair Shop Specialized Equipment by Air Force, Navy Signed by year:2000: $0; 2001: $99,891; 2002: $440,000; 2003: $374,999; 2004: $100,000; 2005: $0; 2006: $0.
Biggest contracts:
$375,000 with Air Force for Other Research and Development -- Management and Support (R&D). Signed on 2002-10-02. Completion date: 2005-02-09.
$374,999, same as above.Signed on 2003-01-13. Completion date: 2005-02-09.
$100,000, same as above.Signed on 2004-03-01. Completion date: 2005-05-02.
$99,891 with Air Force for Other Defense -- Management and Support (R&D). Signed on 2001-05-01. Completion date: 2002-01-23.
DICAR, INCORPORATED (1285 ALMA COURT; small business) : $827,562 in 7 contractsfrom 1999 to 2006
Contracts for Cable, Cord, and Wire Assemblies: Communications Equipment by Defense Logistics Agency Signed by year:2000: $0; 2001: $0; 2002: $384,000; 2003: $0; 2004: $72,038; 2005: $216,960; 2006: $66,560.
Biggest contracts:
$384,000 with Defense Logistics Agency for Cable, Cord, and Wire Assemblies: Communications Equipment. Signed on 2002-08-28. Completion date: 2002-11-06.
$216,960, same as above.Signed on 2005-05-05. Completion date: 2005-10-02.
$88,004, same as above.Signed on 1999-10-25. Completion date: 2000-01-23.
$72,038, same as above.Signed on 2004-10-22. Completion date: 2005-03-21.
SIGNASYS INC (749 N 10TH ST; small business)
$822,551 with Department of Defense for Radio and Television Communication Equipment, Except Airborne. Signed on 2002-08-16. Completion date: 2003-04-14.
SVMC (696 KINGS ROW UNIT 30; small business) 50 employees, $0 revenue: $556,574 in 15 contractsfrom 2004 to 2006
Contracts for Guns, over 30 mm up to 75 mm, Vehicular Brake, Steering, Axle, Wheel, and Track Components, Airframe Structural Components, Vehicular Furniture and Accessories, and moreby Defense Logistics Agency Signed by year:2000: $0; 2001: $0; 2002: $0; 2003: $0; 2004: $487,181; 2005: $61,525; 2006: $7,868.
Biggest contracts:
$201,375 with Defense Logistics Agency for Guns, over 30 mm up to 75 mm. Signed on 2004-08-20. Completion date: 2005-04-30.
$97,903, same as above.Signed on 2004-07-30. Completion date: 2005-01-26.
$60,000 with Defense Logistics Agency for Vehicular Brake, Steering, Axle, Wheel, and Track Components. Signed on 2004-04-08. Completion date: 2004-06-07.
$47,600 with Defense Logistics Agency for Airframe Structural Components. Signed on 2005-02-25. Completion date: 2006-01-26.
OFFICE AUTOMATION GROUP, INC (1771A SMITH AVE; small business) : $447,759 in 7 contractsfrom 2003 to 2005
Contracts for Communications Security Equipment and Components, Telephone and Telegraph Equipment, Miscellaneous Communication Equipment by Navy Signed by year:2000: $0; 2001: $0; 2002: $0; 2003: $127,105; 2004: $270,654; 2005: $50,000; 2006: $0.
Biggest contracts:
$180,000 with Navy for Communications Security Equipment and Components. Signed on 2004-08-25. Completion date: 2004-09-20.
$127,105, same as above.Signed on 2003-09-30. Completion date: 2003-10-31.
$50,000 with Navy for Telephone and Telegraph Equipment. Signed on 2005-03-25. Completion date: 2005-04-25.
$50,000 with Navy for Communications Security Equipment and Components. Signed on 2004-09-11. Completion date: 2005-01-11.
MULTICHIP ASSEMBLY INCORPORATE (535 E BROKAW; small business)
$344,240 with Air Force for Electrical and Electronic assemblies, Boards, Cards, and Associated Hardware. Signed on 2003-12-02. Completion date: 2004-02-06.
DVK INTEGRATED SERVICES, INC (1710 ZANKER ROAD; small business) : $234,376 in 6 contractsfrom 2003 to 2005
Contracts for Flight Instruments, Engineering and Technical Services, ADP Components by Department of Defense, Defense Microelectronics Activity Signed by year:2000: $0; 2001: $0; 2002: $0; 2003: $129,724; 2004: $71,570; 2005: $33,082; 2006: $0.
Biggest contracts:
$75,949 with Department of Defense for Flight Instruments. Signed on 2003-09-18. Completion date: 2004-02-25.
$53,775 with Department of Defense for Engineering and Technical Services. Signed on 2003-09-05. Completion date: 2003-11-15.
$47,410 with Defense Microelectronics Activity for ADP Components. Signed on 2004-01-22. Completion date: 2004-04-15.
$24,160 with Defense Microelectronics Activity for Flight Instruments. Signed on 2004-01-13. Completion date: 2004-08-09.
Top industries in this zip code by the number of employees in 2005:
Administrative and Support and Waste Management and Remediation Services: Temporary Help Services (500-999: 1, 100-249: 2, 50-99: 3, 20-49: 3, 10-19: 1, 5-9: 1)
2010 - 2017 National Fire Incident Reporting System (NFIRS) incidents
Based on the data from the years 2010 - 2017 the average number of fire incidents per year is 218. The highest number of fire incidents - 613 took place in 2017, and the least - 0 in 2014. The data has a growing trend.
When looking into fire subcategories, the most incidents belonged to: Outside Fires (67.3%), and Structure Fires (14.6%).
Fire incident types reported to NFIRS in Zip Code 95112


 Nearest zip codes: 95113, 95110, 95116, 95133, 95126, 95131.


 Based on the data from the years 2010 - 2017 the average number of fire incidents per year is 218. The highest number of fire incidents - 613 took place in 2017, and the least - 0 in 2014. The data has a growing trend.
 When looking into fire subcategories, the most incidents belonged to: Outside Fires (67.3%), and Structure Fires (14.6%).