Jackson (Taylor) neighborhood in San Jose, California (CA), 95112 detailed profile
Settings
X

Business Search - 14 Million verified businesses
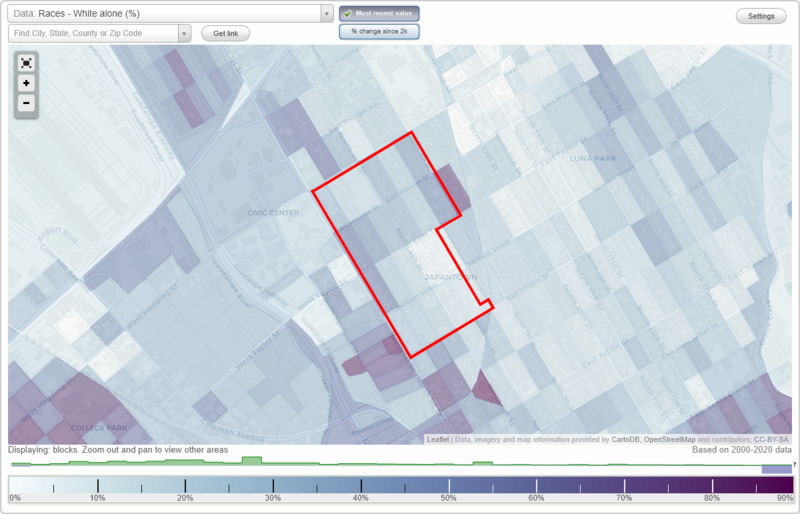
Area: 0.245 square miles
Population: 3,707
Population density:
| Jackson (Taylor): | 15,114 people per square mile |
| San Jose: | 5,554 people per square mile |

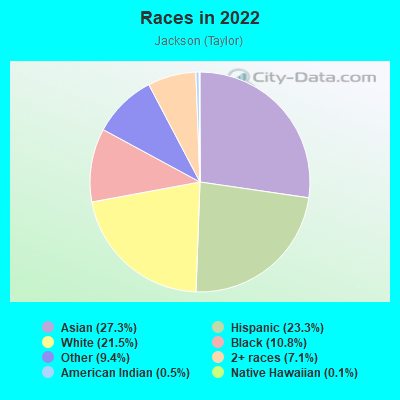
- 1,08827.3%Asian
- 92623.3%Hispanic or Latino
- 85421.5%White
- 42910.8%Black
- 3759.4%Some other race
- 2847.1%Two or more races
- 180.5%American Indian
- 50.1%Native Hawaiian and Other
Pacific Islander
Median household income in 2022:
| Jackson (Taylor): | $164,384 |
| San Jose: | $133,835 |
Distribution of median household income
![Distribution of median household income]()
- 54Less than $10,000
- 98$10,000 to $19,999
- 64$20,000 to $29,999
- 39$30,000 to $39,999
- 47$40,000 to $49,999
- 106$50,000 to $59,999
- 43$60,000 to $74,999
- 244$75,000 to $99,999
- 69$100,000 to $124,999
- 94$125,000 to $149,999
- 276$150,000 to $199,999
- 676$200,000 or more

Distribution of owner-occupied house/condo value
![Distribution of owner-occupied house/condo value]()
- 33$100,000 to $149,999
- 120$500,000 to $749,999
- 100$750,000 to $999,999
- 282$1,000,000 or more

Distribution of rent paid by renters
![Distribution of rent paid by renters]()
- 91Less than $100
- 66$300 to $399
- 45$400 to $499
- 14$500 to $599
- 15$600 to $699
- 10$800 to $899
- 42$900 to $999
- 24$1,000 to $1,249
- 23$1,250 to $1,499
- 85$1,500 to $1,999
- 897$2,000 or more

Median rent in 2022:
| Jackson (Taylor): | $2,447 |
| San Jose: | $2,001 |
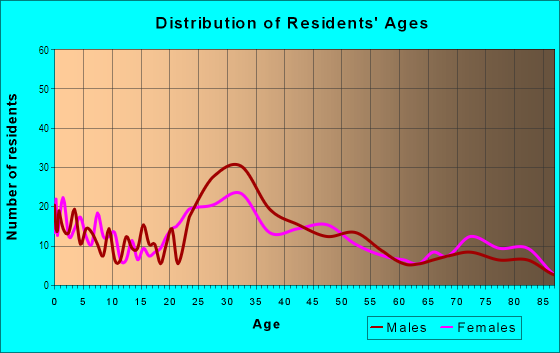
| Males: | 2,075 |
| Females: | 1,632 |
Males:
| This neighborhood: | 31.4 years |
| Whole city: | 37.6 years |
| This neighborhood: | 32.6 years |
| Whole city: | 39.1 years |
Average household size:
| Jackson (Taylor): | 10.2 people |
| San Jose: | 2.9 people |
Percentage of family households:
| Jackson (Taylor): | 43.1% |
| San Jose: | 49.9% |
| Here: | 42.8% |
| San Jose: | 53.0% |
Percentage of married-couple families with children (among all households):
| Jackson (Taylor): | 33.9% |
| San Jose: | 25.8% |
Percentage of single-mother households (among all households):
| Jackson (Taylor): | 12.5% |
| San Jose: | 5.2% |
Percentage of never married males 15 years old and over:
Percentage of never married females 15 years old and over:
| Jackson (Taylor): | 25.7% |
| San Jose: | 20.9% |
Percentage of never married females 15 years old and over:
| Jackson (Taylor): | 17.3% |
| city: | 16.7% |
Percentage of people that speak English not well or not at all:
| Jackson (Taylor): | 4.7% |
| San Jose: | 11.4% |
Percentage of people born in this state:
Percentage of people born in another U.S. state:
Percentage of native residents but born outside the U.S.:
Percentage of foreign born residents:
| Here: | 49.9% |
| San Jose: | 46.1% |
Percentage of people born in another U.S. state:
| Jackson (Taylor): | 15.7% |
| San Jose: | 10.4% |
Percentage of native residents but born outside the U.S.:
| Here: | 1.1% |
| city: | 1.7% |
Percentage of foreign born residents:
| Here: | 33.2% |
| San Jose: | 41.8% |
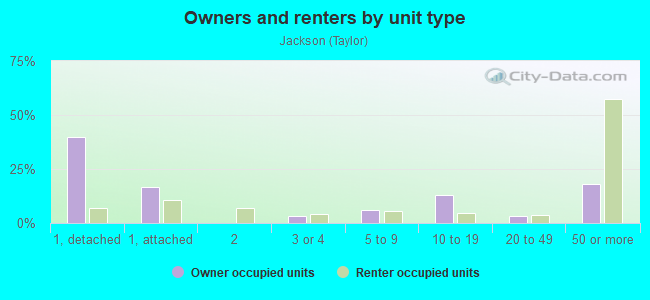
Owner-occupied
Renter-occupied

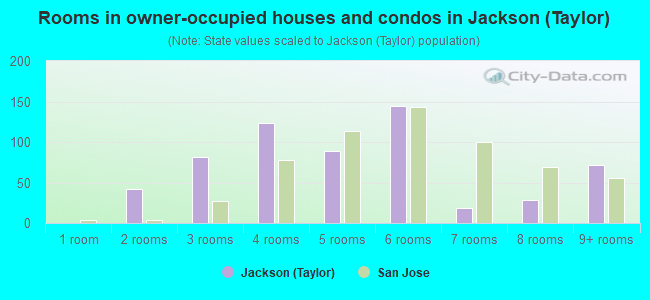
- Rooms in owner-occupied houses and condos in Jackson <
> - 01 room
- 422 rooms
- 813 rooms
- 1234 rooms
- 895 rooms
- 1446 rooms
- 187 rooms
- 288 rooms
- 729+ rooms
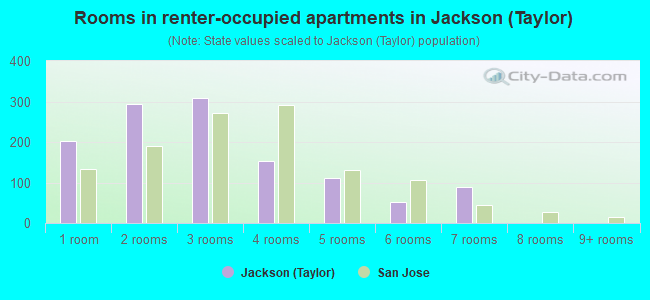
- Rooms in renter-occupied apartments in Jackson <
> - 2021 room
- 2952 rooms
- 3093 rooms
- 1524 rooms
- 1105 rooms
- 526 rooms
- 907 rooms
- 08 rooms
- 09+ rooms
Owner-occupied
Renter-occupied
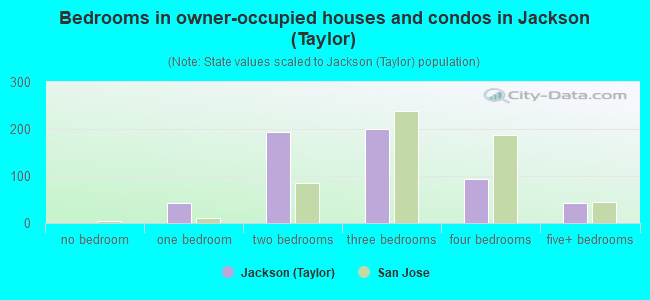
- Bedrooms in owner-occupied houses and condos in Jackson <
> - 0no bedroom
- 421 bedroom
- 1932 bedrooms
- 2013 bedrooms
- 934 bedrooms
- 435+ bedrooms
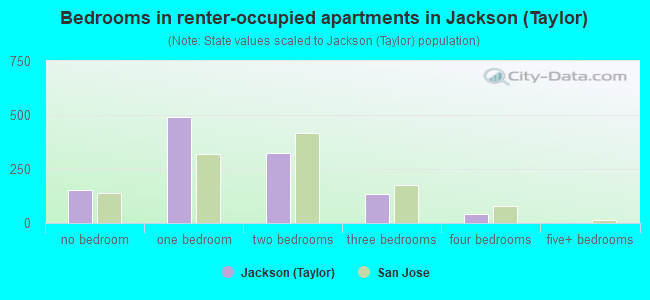
- Bedrooms in renter-occupied apartments in Jackson <
> - 154no bedroom
- 4931 bedroom
- 3232 bedrooms
- 1333 bedrooms
- 404 bedrooms
- 05+ bedrooms
Average number of cars or other vehicles available in houses/condos:
Average number of cars or other vehicles available in apartments:
| This neighborhood: | 2.0 |
| San Jose: | 2.3 |
Average number of cars or other vehicles available in apartments:
| Here: | 1.4 |
| city: | 1.6 |
Percentage of units with a mortgage:
| Jackson (Taylor): | 85.0% |
| San Jose: | 66.9% |
Housing prices:
- Average estimated value of detached houses in 2022 (22.6% of all units):
Jackson (Taylor): $1,172,502 San Jose: $1,532,815
- Average estimated value of townhouses or other attached units in 2022 (15.5% of all units):
This neighborhood: $3,469,720 city: $1,024,857
- Average estimated '22 value of housing units in 5-or-more-unit structures (61.9% of all units):
Jackson (Taylor): $960,266 San Jose: $791,954
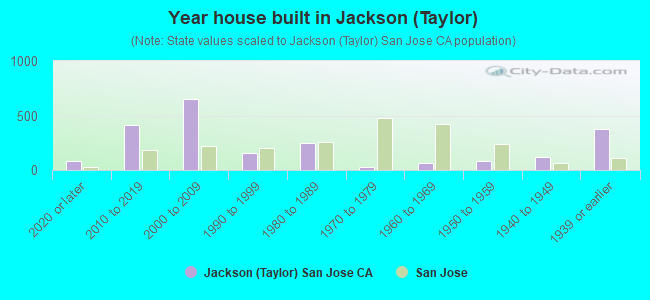
- Year house built in Jackson <
> - 782020 or later
- 4122010 to 2019
- 6502000 to 2009
- 1571990 to 1999
- 2461980 to 1989
- 281970 to 1979
- 611960 to 1969
- 801950 to 1959
- 1221940 to 1949
- 3741939 or earlier
City-data.com crime index for city in 2020 (higher means more crime):
| City: | 268.4 |
| U.S. average: | 219.5 |
Travel time to work (commute)
![Travel time to work (commute)]()
- 25Less than 5 minutes
- 1025 to 9 minutes
- 19010 to 14 minutes
- 28315 to 19 minutes
- 20320 to 24 minutes
- 7225 to 29 minutes
- 22630 to 34 minutes
- 5235 to 39 minutes
- 10740 to 44 minutes
- 9845 to 59 minutes
- 16260 to 89 minutes
- 2390 or more minutes

Means of transportation to work
![Means of transportation to work]()
- 54.9%1,363Drove a car alone
- 14.6%364Carpooled
- 0.8%20Bus
- 1.3%32Long-distance train or commuter rail
- 1.4%36Light rail, streetcar or trolley
- 0.8%20Taxi
- 0.8%20Motorcycle
- 0.7%18Bicycle
- 4.7%117Walked
- 1.1%28Other means
- 22.4%556Worked at home

Time leaving home to go to work
![Time leaving home to go to work]()
- 8512:00 a.m. to 4:59 a.m.
- 45:00 a.m. to 5:29 a.m.
- 1295:30 a.m. to 5:59 a.m.
- 1156:00 a.m. to 6:29 a.m.
- 426:30 a.m. to 6:59 a.m.
- 2937:00 a.m. to 7:29 a.m.
- 1067:30 a.m. to 7:59 a.m.
- 2098:00 a.m. to 8:29 a.m.
- 1238:30 a.m. to 8:59 a.m.
- 2479:00 a.m. to 9:59 a.m.
- 8810:00 a.m. to 10:59 a.m.
- 5011:00 a.m. to 11:59 a.m.
- 3012:00 p.m. to 3:59 p.m.
- 534:00 p.m. to 11:59 p.m.

Occupations of males:
- Percentage of males in management occupations (except farmers):
Here: 11.4% city: 13.0%
- Percentage of males in business and financial operations occupations:
Here: 13.7% city: 4.6%
- Percentage of males in computer and mathematical occupations:
Here: 15.2% city: 13.6%
- Percentage of males in architecture and engineering occupations:
Here: 17.8% city: 10.2%
- Percentage of males in legal occupations:
Here: 1.6% city: 0.8%
- Percentage of males in education, training, and library occupations:
Here: 6.8% city: 2.8%
- Percentage of males in arts, design, entertainment, sports, and media occupations:
Here: 1.5% city: 1.8%
- Percentage of males in healthcare practitioners and technical occupations:
Here: 3.1% city: 2.0%
- Percentage of males in service occupations:
Here: 5.1% city: 12.7%
- Percentage of males in sales and office occupations:
Here: 13.2% city: 12.8%
- Percentage of males in construction, extraction, and maintenance occupations:
Here: 4.5% city: 7.8%
- Percentage of males in transportation occupations:
Here: 2.4% city: 3.6%
- Percentage of males in material moving occupations:
Here: 1.2% city: 3.1%
Occupations of females:
- Percentage of females in management occupations (except farmers):
Here: 11.3% city: 11.0%
- Percentage of females in business and financial operations occupations:
Here: 11.6% city: 8.6%
- Percentage of females in computer and mathematical occupations:
Here: 13.9% city: 5.4%
- Percentage of females in architecture and engineering occupations:
Here: 5.1% city: 2.8%
- Percentage of females in life, physical, and social science occupations:
Here: 5.3% city: 1.7%
- Percentage of females in community and social services occupations:
Here: 2.4% city: 1.8%
- Percentage of females in education, training, and library occupations:
Here: 7.5% city: 8.1%
- Percentage of females in healthcare practitioners and technical occupations:
Here: 8.3% city: 6.8%
- Percentage of females in service occupations:
Here: 8.0% city: 21.7%
- Percentage of females in sales and office occupations:
Here: 27.0% city: 22.0%
- Percentage of females in production occupations:
Here: 2.2% city: 4.0%
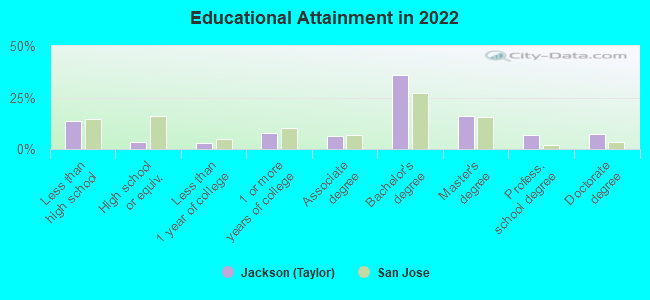
Education in this neighborhood (subdivision or community):
- Percentage of people 3 years and older in K-12 schools:
Jackson (Taylor): 14.6% San Jose: 16.1%
- Percentage of people 3 years and older in undergraduate colleges:
Jackson (Taylor): 7.3% San Jose: 6.5%
- Percentage of people 3 years and older in grad. or professional schools:
Jackson (Taylor): 4.0% San Jose: 2.0%
- Percentage of students K-12 enrolled in private schools:
Jackson (Taylor): 22.2% San Jose: 14.9%
Percentage of population below poverty level:
| Jackson (Taylor): | 9.2% |
| San Jose: | 9.0% |
Median year owner moved in (as recorded in 2022):
Median year renter moved in (as recorded in 2022):
| Jackson (Taylor): | 2015 |
| San Jose: | 2008 |
Median year renter moved in (as recorded in 2022):
| Jackson (Taylor): | 2019 |
| San Jose: | 2020 |
Percentage of married-couple families with both working:
| Jackson (Taylor): | 82.6% |
| San Jose: | 72.5% |
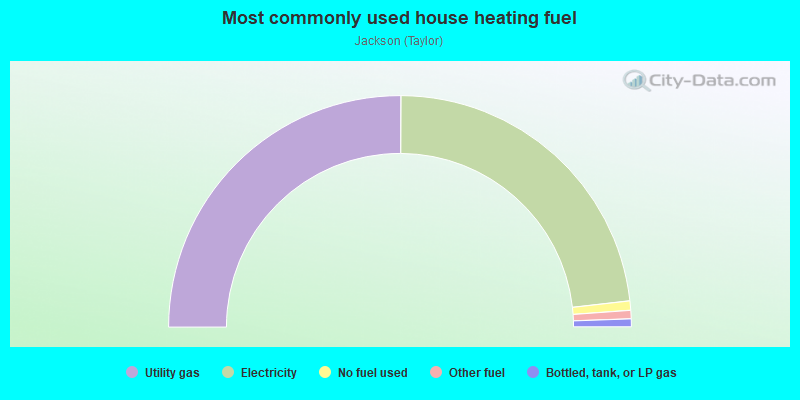
- 50.1%Utility gas
- 46.2%Electricity
- 1.3%No fuel used
- 1.2%Other fuel
- 1.1%Bottled, tank, or LP gas
Roads and streets:
N 5th St
Length: 0.55 miles
Direction: SE-NW
Address range: 500 to 799
Direction: SE-NW
Address range: 500 to 799
N 3rd St
Length: 0.55 miles
Direction: SE-NW
Address range: 500 to 799
Direction: SE-NW
Address range: 500 to 799
N 4th St
Length: 0.55 miles
Direction: SE-NW
Address range: 500 to 799
Direction: SE-NW
Address range: 500 to 799
N 2nd St
Length: 0.55 miles
Direction: SE-NW
Address range: 500 to 799
Direction: SE-NW
Address range: 500 to 799
E Mission St
Length: 0.41 miles
Direction: SW-NE
Address range: 45 to 299
Direction: SW-NE
Address range: 45 to 299
E Taylor St
Length: 0.41 miles
Direction: SW-NE
Address range: 50 to 299
Direction: SW-NE
Address range: 50 to 299
E Empire St
Length: 0.33 miles
Direction: SW-NE
Address range: 50 to 251
Direction: SW-NE
Address range: 50 to 251
N 7th St
Length: 0.27 miles
Direction: SE-NW
Address range: 700 to 848
Direction: SE-NW
Address range: 700 to 848
Jackson St
Length: 0.24 miles
Direction: SW-NE
Address range: 51 to 199
Direction: SW-NE
Address range: 51 to 199
N 6th St
Length: 0.18 miles
Direction: SE-NW
Address range: 700 to 799
Direction: SE-NW
Address range: 700 to 799