Estimated zip code population in 2022: 36,688 Zip code population in 2010: 31,049 Zip code population in 2000: 27,021
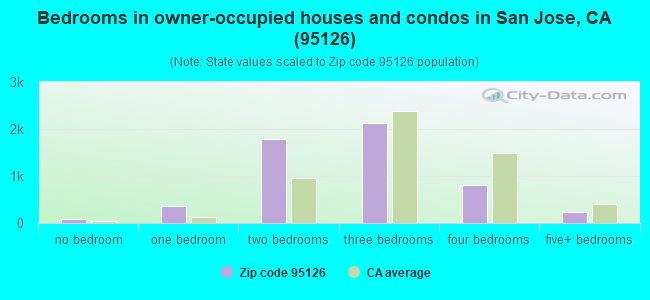
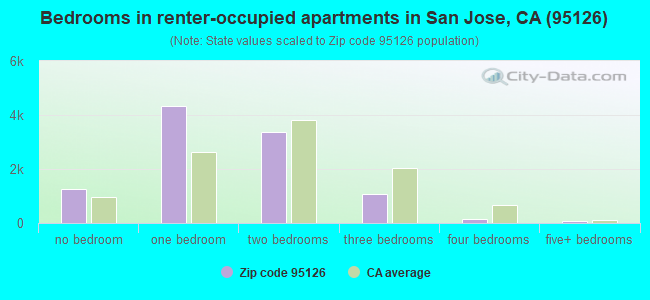
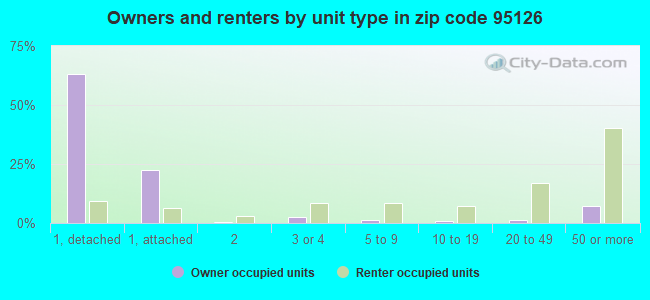
Houses and condos: 16,642 Renter-occupied apartments: 10,237
% of renters here:
65%
State:
44%
March 2022 cost of living index in zip code 95126: 124.7 (high, U.S. average is 100)
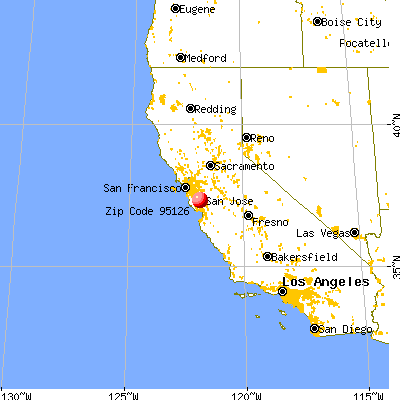
Land area: 3.3 sq. mi. Water area: 0.0 sq. mi.
Population density: 11,167 people per square mile
(high).
OSM Map
General Map
Google Map
MSN Map
OSM Map
General Map
Google Map
MSN Map
OSM Map
General Map
Google Map
MSN Map
OSM Map
General Map
Google Map
MSN Map
Please wait while loading the map...
Real estate property taxes paid for housing units in 2022:
This zip code:
0.8% ($9,765)
California:
0.7% ($4,831)
Median real estate property taxes paid for housing units with mortgages in 2022: $10,330 (0.8%) Median real estate property taxes paid for housing units with no mortgage in 2022: $6,585 (0.5%)
Averages for the 2020 tax year for zip code 95126, filed in 2021:
Average Adjusted Gross Income (AGI) in 2020: $132,649 (Individual Income Tax Returns)
Here:
$132,649
State:
$95,910
Salary/wage: $123,222 (reported on 87.2% of returns)
Here:
$123,222
State:
$77,331
(% of AGI for various income ranges: 1235.0% for AGIs below $25k, 4322.9% for AGIs $25k-50k, 7680.4% for AGIs $50k-75k, 11455.1% for AGIs $75k-100k, 22028.8% for AGIs $100k-200k, 153412.0% for AGIs over 200k)
Taxable interest for individuals: $1,492 (reported on 35.7% of returns)
This zip code:
$1,492
California:
$2,294
(% of AGI for various income ranges: 17.0% for AGIs below $25k, 14.6% for AGIs $25k-50k, 30.5% for AGIs $50k-75k, 43.2% for AGIs $75k-100k, 107.1% for AGIs $100k-200k, 794.3% for AGIs over 200k)
Ordinary dividends: $6,535 (reported on 30.1% of returns)
Here:
$6,535
State:
$10,949
(% of AGI for various income ranges: 27.9% for AGIs below $25k, 40.3% for AGIs $25k-50k, 87.7% for AGIs $50k-75k, 148.8% for AGIs $75k-100k, 298.2% for AGIs $100k-200k, 3411.2% for AGIs over 200k)
Net capital gain/loss in AGI: +$31,366 (reported on 29.8% of returns)
Here:
+$31,366
State:
+$49,306
(% of AGI for various income ranges: 14.2% for AGIs below $25k, 56.2% for AGIs $25k-50k, 67.8% for AGIs $50k-75k, 188.6% for AGIs $75k-100k, 491.5% for AGIs $100k-200k, 21160.7% for AGIs over 200k)
Profit/loss from business: +$18,696 (reported on 15.4% of returns)
Here:
+$18,696
State:
+$15,671
(% of AGI for various income ranges: 204.9% for AGIs below $25k, 214.6% for AGIs $25k-50k, 195.0% for AGIs $50k-75k, 271.5% for AGIs $75k-100k, 505.9% for AGIs $100k-200k, 3532.0% for AGIs over 200k)
Taxable individual retirement arrangement distribution: $21,026 (reported on 5.0% of returns)
95126:
$21,026
California:
$23,505
(% of AGI for various income ranges: 45.5% for AGIs below $25k, 59.7% for AGIs $25k-50k, 111.4% for AGIs $50k-75k, 152.1% for AGIs $75k-100k, 317.7% for AGIs $100k-200k, 925.1% for AGIs over 200k)
Self-employed (Keogh) retirement plans: $25,095 (reported on 1.1% of returns)
95126:
$25,095
California:
$30,163
(% of AGI for various income ranges: 13.2% for AGIs $25k-50k, 48.3% for AGIs $100k-200k, 508.9% for AGIs over 200k)
Total itemized deductions: $34,682 (reported on 16.6% of returns)
Here:
$34,682
State:
$39,517
(% of AGI for various income ranges: 88.6% for AGIs below $25k, 135.8% for AGIs $25k-50k, 268.0% for AGIs $50k-75k, 548.5% for AGIs $75k-100k, 1320.1% for AGIs $100k-200k, 8531.8% for AGIs over 200k)
Charity contributions: $8,963 (reported on 13.1% of returns)
Here:
$8,963
State:
$12,598
(% of AGI for various income ranges: 3.4% for AGIs below $25k, 14.0% for AGIs $25k-50k, 30.2% for AGIs $50k-75k, 83.7% for AGIs $75k-100k, 158.0% for AGIs $100k-200k, 2241.8% for AGIs over 200k)
Taxes paid: $9,335 (reported on 16.6% of returns)
95126:
$9,335
State:
$8,807
(% of AGI for various income ranges: 18.1% for AGIs below $25k, 34.0% for AGIs $25k-50k, 69.1% for AGIs $50k-75k, 176.2% for AGIs $75k-100k, 448.3% for AGIs $100k-200k, 2041.9% for AGIs over 200k)
Earned income credit: $1,733 (reported on 7.9% of returns)
Here:
$1,733
State:
$2,074
(% of AGI for various income ranges: 66.8% for AGIs below $25k, 38.4% for AGIs $25k-50k)
Percentage of individuals using paid preparers for their 2020 taxes: 92.6%
Here:
93%
State:
92%
(% for various income ranges: 89.4% for AGIs below $25k, 91.8% for AGIs $25k-50k, 93.2% for AGIs $50k-75k, 93.4% for AGIs $75k-100k, 93.7% for AGIs $100k-200k, 95.4% for AGIs over 200k)
Averages for the 2012 tax year for zip code 95126, filed in 2013:
Average Adjusted Gross Income (AGI) in 2012: $83,999 (Individual Income Tax Returns)
Here:
$83,999
State:
$72,726
Salary/wage: $76,631 (reported on 88.3% of returns)
Here:
$76,631
State:
$59,079
(% of AGI for various income ranges: 78.5% for AGIs below $25k, 86.9% for AGIs $25k-50k, 86.9% for AGIs $50k-75k, 86.8% for AGIs $75k-100k, 86.9% for AGIs $100k-200k, 71.0% for AGIs over 200k)
Taxable interest for individuals: $1,243 (reported on 36.2% of returns)
This zip code:
$1,243
California:
$2,146
(% of AGI for various income ranges: 0.8% for AGIs below $25k, 0.5% for AGIs $25k-50k, 0.5% for AGIs $50k-75k, 0.3% for AGIs $75k-100k, 0.4% for AGIs $100k-200k, 0.7% for AGIs over 200k)
Ordinary dividends: $5,509 (reported on 23.1% of returns)
Here:
$5,509
State:
$9,308
(% of AGI for various income ranges: 1.6% for AGIs below $25k, 0.8% for AGIs $25k-50k, 1.1% for AGIs $50k-75k, 0.9% for AGIs $75k-100k, 1.1% for AGIs $100k-200k, 2.3% for AGIs over 200k)
Net capital gain/loss in AGI: +$16,912 (reported on 22.2% of returns)
Here:
+$16,912
State:
+$30,460
(% of AGI for various income ranges: 0.3% for AGIs $25k-50k, 0.3% for AGIs $50k-75k, 0.5% for AGIs $75k-100k, 1.3% for AGIs $100k-200k, 10.7% for AGIs over 200k)
Profit/loss from business: +$22,004 (reported on 14.9% of returns)
Here:
+$22,004
State:
+$17,064
(% of AGI for various income ranges: 10.5% for AGIs below $25k, 4.4% for AGIs $25k-50k, 3.2% for AGIs $50k-75k, 2.7% for AGIs $75k-100k, 3.1% for AGIs $100k-200k, 4.1% for AGIs over 200k)
Taxable individual retirement arrangement distribution: $17,087 (reported on 6.0% of returns)
95126:
$17,087
California:
$19,557
(% of AGI for various income ranges: 1.7% for AGIs below $25k, 0.8% for AGIs $25k-50k, 1.2% for AGIs $50k-75k, 1.5% for AGIs $75k-100k, 1.3% for AGIs $100k-200k, 1.2% for AGIs over 200k)
Self-employment retirement plans: $19,889 (reported on 1.1% of returns)
95126:
$19,889
California:
$24,530
(% of AGI for various income ranges: 0.4% for AGIs $50k-75k, 0.3% for AGIs $100k-200k, 0.4% for AGIs over 200k)
Total itemized deductions: $32,731 (20% of AGI, reported on 38.4% of returns)
Here:
$32,731
State:
$34,004
Here:
20.3% of AGI
State:
22.7% of AGI
(% of AGI for various income ranges: 8.9% for AGIs below $25k, 7.4% for AGIs $25k-50k, 11.3% for AGIs $50k-75k, 15.6% for AGIs $75k-100k, 17.4% for AGIs $100k-200k, 16.7% for AGIs over 200k)
Charity contributions: $3,402 (reported on 29.3% of returns)
Here:
$3,402
State:
$4,659
(% of AGI for various income ranges: 0.5% for AGIs below $25k, 0.5% for AGIs $25k-50k, 1.0% for AGIs $50k-75k, 1.7% for AGIs $75k-100k, 1.1% for AGIs $100k-200k, 1.4% for AGIs over 200k)
Taxes paid: $16,178 (reported on 38.4% of returns)
95126:
$16,178
State:
$14,448
(% of AGI for various income ranges: 1.8% for AGIs below $25k, 1.7% for AGIs $25k-50k, 3.6% for AGIs $50k-75k, 6.2% for AGIs $75k-100k, 8.3% for AGIs $100k-200k, 10.2% for AGIs over 200k)
Earned income credit: $1,814 (reported on 10.9% of returns)
Here:
$1,814
State:
$2,286
(% of AGI for various income ranges: 4.0% for AGIs below $25k, 0.6% for AGIs $25k-50k)
Percentage of individuals using paid preparers for their 2012 taxes: 55.7%
Here:
56%
State:
64%
(% for various income ranges: 57.3% for AGIs below $25k, 56.6% for AGIs $25k-50k, 52.0% for AGIs $50k-75k, 51.9% for AGIs $75k-100k, 53.3% for AGIs $100k-200k, 63.8% for AGIs over 200k)
Averages for the 2004 tax year for zip code 95126, filed in 2005:
Average Adjusted Gross Income (AGI) in 2004: $67,071 (Individual Income Tax Returns)
Here:
$67,071
State:
$58,600
Salary/wage: $60,029 (reported on 87.2% of returns)
Here:
$60,029
State:
$49,455
(% of AGI for various income ranges: 131.5% for AGIs below $10k, 81.6% for AGIs $10k-25k, 88.6% for AGIs $25k-50k, 86.9% for AGIs $50k-75k, 86.2% for AGIs $75k-100k, 70.7% for AGIs over 100k)
Taxable interest for individuals: $1,690 (reported on 43.9% of returns)
This zip code:
$1,690
California:
$2,365
(% of AGI for various income ranges: 7.3% for AGIs below $10k, 1.5% for AGIs $10k-25k, 0.9% for AGIs $25k-50k, 0.9% for AGIs $50k-75k, 1.0% for AGIs $75k-100k, 1.1% for AGIs over 100k)
Taxable dividends: $3,913 (reported on 24.2% of returns)
Here:
$3,913
State:
$4,746
(% of AGI for various income ranges: 17.4% for AGIs below $10k, 1.3% for AGIs $10k-25k, 0.8% for AGIs $25k-50k, 0.8% for AGIs $50k-75k, 0.8% for AGIs $75k-100k, 1.7% for AGIs over 100k)
Net capital gain/loss: +$15,970 (reported on 24.1% of returns)
Here:
+$15,970
State:
+$23,418
(% of AGI for various income ranges: 21.4% for AGIs below $10k, 0.1% for AGIs $10k-25k, 0.5% for AGIs $25k-50k, 0.5% for AGIs $50k-75k, 1.1% for AGIs $75k-100k, 9.7% for AGIs over 100k)
Profit/loss from business: +$21,901 (reported on 14.9% of returns)
Here:
+$21,901
State:
+$16,826
(% of AGI for various income ranges: 11.9% for AGIs below $10k, 7.4% for AGIs $10k-25k, 4.1% for AGIs $25k-50k, 4.0% for AGIs $50k-75k, 4.5% for AGIs $75k-100k, 5.0% for AGIs over 100k)
IRA payment deduction: $3,008 (reported on 2.2% of returns)
95126:
$3,008
California:
$3,192
(% of AGI for various income ranges: 0.2% for AGIs $10k-25k, 0.2% for AGIs $25k-50k, 0.1% for AGIs $50k-75k, 0.1% for AGIs $75k-100k, 0.1% for AGIs over 100k)
Self-employed pension: $17,536 (reported on 1.8% of returns)
Here:
$17,536
California:
$17,688
(% of AGI for various income ranges: 0.9% for AGIs below $10k, 0.1% for AGIs $25k-50k, 0.2% for AGIs $50k-75k, 0.3% for AGIs $75k-100k, 0.7% for AGIs over 100k)
Total itemized deductions: $28,989 (23% of AGI, reported on 38.1% of returns)
Here:
$28,989
State:
$28,113
Here:
22.7% of AGI
State:
25.3% of AGI
(% of AGI for various income ranges: 36.4% for AGIs below $10k, 9.9% for AGIs $10k-25k, 10.3% for AGIs $25k-50k, 15.2% for AGIs $50k-75k, 19.6% for AGIs $75k-100k, 18.1% for AGIs over 100k)
Charity contributions deductions: $3,175 (2% of AGI, reported on 33.0% of returns)
Here:
$3,175
State:
$3,923
Here:
2.4% of AGI
State:
3.3% of AGI
(% of AGI for various income ranges: 1.4% for AGIs below $10k, 0.7% for AGIs $10k-25k, 1.0% for AGIs $25k-50k, 1.3% for AGIs $50k-75k, 1.5% for AGIs $75k-100k, 1.9% for AGIs over 100k)
Total tax: $12,594 (reported on 80.5% of returns)
95126:
$12,594
State:
$10,761
(% of AGI for various income ranges: 5.9% for AGIs below $10k, 4.7% for AGIs $10k-25k, 8.0% for AGIs $25k-50k, 11.5% for AGIs $50k-75k, 12.7% for AGIs $75k-100k, 19.4% for AGIs over 100k)
Earned income credit: $1,445 (reported on 9.5% of returns)
Here:
$1,445
State:
$1,763
Percentage of individuals using paid preparers for their 2004 taxes: 59.6%
Here:
60%
State:
66%
(% for various income ranges: 55.4% for AGIs below $10k, 62.5% for AGIs $10k-25k, 60.0% for AGIs $25k-50k, 54.0% for AGIs $50k-75k, 57.9% for AGIs $75k-100k, 64.6% for AGIs over 100k)
Likely homosexual households (counted as self-reported same-sex unmarried-partner households)
Lesbian couples: 0.7% of all households
Gay men: 0.6% of all households
Household received Food Stamps/SNAP in the past 12 months: 1,241 Household did not receive Food Stamps/SNAP in the past 12 months: 14,300
Women who had a birth in the past 12 months: 499 (395 now married, 103 unmarried) Women who did not have a birth in the past 12 months: 9,213 (3,629 now married, 5,585 unmarried)
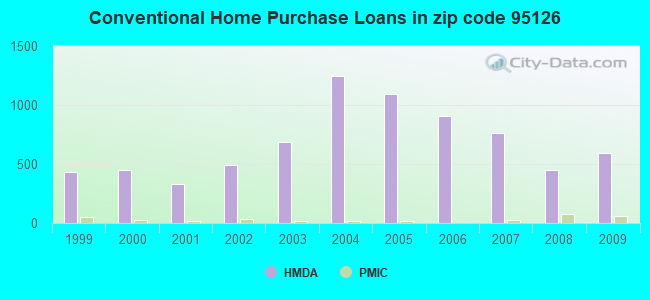
Housing units in zip code 95126 with a mortgage: 3,887 (453 second mortgage, 5 home equity loan, 403 both second mortgage and home equity loan) Houses without a mortgage: 29
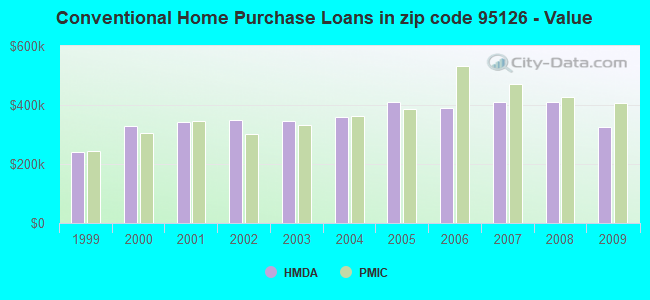
Median monthly owner costs for units with a mortgage: $3,847 Median monthly owner costs for units without a mortgage: $1,104
Residents with income below the poverty level in 2022:
This zip code:
10.1%
Whole state:
12.2%
Residents with income below 50% of the poverty level in 2022:
This zip code:
3.0%
Whole state:
6.2%
Median number of rooms in houses and condos:
Here:
5.6
State:
6.0
Median number of rooms in apartments:
Here:
3.3
State:
3.9
Notable locations in this zip code not listed on our city pages
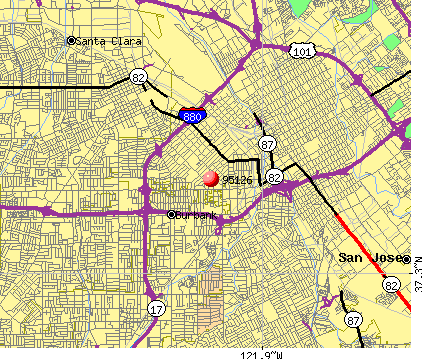
Notable locations in zip code 95126: Rosicrucian Museum and Planetarium (A), American Indian Center Library of Santa Clara Valley (B), Rosicrucian Order Research Library (C), Rosegarden Branch San Jose Public Library (D), San Jose Fire Department Station 30 (E), San Jose Fire Department Station 7 (F). Display/hide their locations on the map
Churches in zip code 95126 include: Calvary United Methodist Church (A), Christ Unity Church (B), First Church of Christ Scientist (C), Heart of the Valley Baptist Church (D), Holy Redeemer Lutheran Church (E), Hosanna Presbyterian Church (F), Saint Nicholas Greek Orthodox Church (G), San Jose Friends Church (H), Chinmaya Mission (I). Display/hide their locations on the map
Parks in zip code 95126 include: Municipal Rose Garden (1), Hester Park (2), Rosicrucian Park (3), Hamline Community Garden (4). Display/hide their locations on the map
3,764 married couples with children.
1,785 single-parent households (912 men, 873 women).
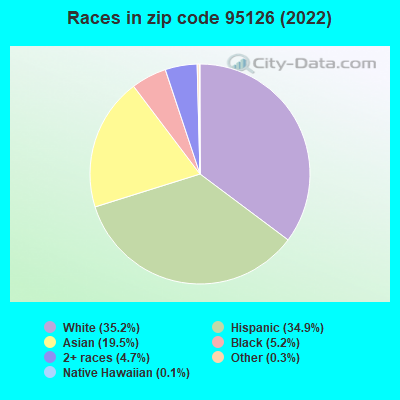
51.3% of residents of 95126 zip code speak English at home.
26.1% of residents speak Spanish at home (61% very well, 19% well, 16% not well, 4% not at all).
6.8% of residents speak other Indo-European language at home (74% very well, 10% well, 8% not well, 8% not at all).
12.0% of residents speak Asian or Pacific Island language at home (64% very well, 22% well, 11% not well, 2% not at all).
3.2% of residents speak other language at home (64% very well, 15% well, 14% not well, 8% not at all).
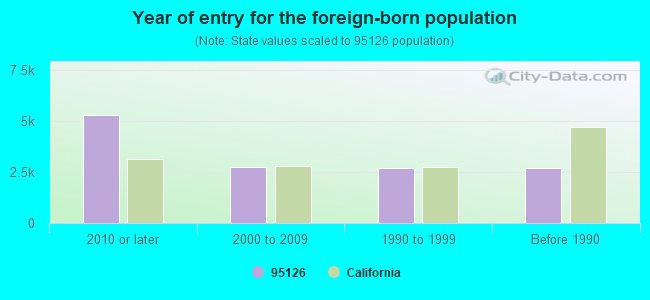
Foreign born population: 12,528 (34.1%) (41.8% of them are naturalized citizens)
Major facilities with environmental interests located in this zip code:
CHEVRON STATION NO 93314 (1030 LEIGH AVENUE in SAN JOSE, CA)
STATE MASTER (California - Hazardous Waste Tracking) - HAZARDOU WASTE PROGRAM Small Quantity Generators, between 100 kg and 1000 kg of hazardous waste/month (Resource Conservation and Recovery Act (tracking hazardous waste)) - notification Small Quantity Generators, between 100 kg and 1000 kg of hazardous waste/month (Resource Conservation and Recovery Act (tracking hazardous waste)) - notification Organizations: CHEVRON PRODUCTS CO (CONTACT/OWNER)
, EQUILON ENTERPRISES L L C (CONTACT/OWNER)
Alternative names: SHELL SERVICE STATION
MIRACLE AUTO PAINTING (850 THE ALAMEDA in SAN JOSE, CA)
STATE MASTER (California - Hazardous Waste Tracking) - HAZARDOU WASTE PROGRAM CRITERIA AND HAZARDOUS AIR POLLUTANT INVENTORY (Inventory of air pollution sources) Small Quantity Generators, between 100 kg and 1000 kg of hazardous waste/month (Resource Conservation and Recovery Act (tracking hazardous waste)) Business SIC classification: TOP, BODY, AND UPHOLSTERY REPAIR SHOPS AND PAINT SHOPS
MICHAEL AND COMPANY (351 LINCOLN AVE in SAN JOSE, CA)
STATE MASTER (California - Hazardous Waste Tracking) - HAZARDOU WASTE PROGRAM CRITERIA AND HAZARDOUS AIR POLLUTANT INVENTORY (Inventory of air pollution sources) Small Quantity Generators, between 100 kg and 1000 kg of hazardous waste/month (Resource Conservation and Recovery Act (tracking hazardous waste)) - notification Business SIC classification: TOP, BODY, AND UPHOLSTERY REPAIR SHOPS AND PAINT SHOPS Organizations: MICHAEL LAMANTIA (CONTACT/OWNER)
GRAHAM CONTRACTORS INC (860 LONUS in SAN JOSE, CA)
STATE MASTER (California - Hazardous Waste Tracking) - HAZARDOU WASTE PROGRAM Small Quantity Generators, between 100 kg and 1000 kg of hazardous waste/month (Resource Conservation and Recovery Act (tracking hazardous waste))
CHEVRON STATION NO 93093 (395 BIRD AVENUE in SAN JOSE, CA)
STATE MASTER (California - Hazardous Waste Tracking) - HAZARDOU WASTE PROGRAM Small Quantity Generators, between 100 kg and 1000 kg of hazardous waste/month (Resource Conservation and Recovery Act (tracking hazardous waste)) - notification Organizations: CHEVRON PRODUCTS CO (CONTACT/OWNER)
LINCOLN (ABRAHAM) HIGH (555 DANA AVE. in SAN JOSE, CA)
(National Center for Education Statistics) - STATE ID-4333795 Organizations: SAN JOSE UNIFIED (SCHOOL DISTRICT)
FOUNDRY (258 SUNOL ST. in SAN JOSE, CA)
(National Center for Education Statistics) - STATE ID-4330577 Organizations: SANTA CLARA CO. OFF. OF EDUCATION (SCHOOL DISTRICT)
HESTER ELEMENTARY (1460 THE ALAMEDA in SAN JOSE, CA)
(National Center for Education Statistics) - STATE ID-6048581 Organizations: SAN JOSE UNIFIED (SCHOOL DISTRICT)
HOOVER (HERBERT) MIDDLE (1635 PARK AVE. in SAN JOSE, CA)
(National Center for Education Statistics) - STATE ID-6062111 Organizations: SAN JOSE UNIFIED (SCHOOL DISTRICT)
AMERICAN CUSTOM MARBLE INCORPORATED (806 WEST HOME STREET in SAN JOSE, CA)
CRITERIA AND HAZARDOUS AIR POLLUTANT INVENTORY (Inventory of air pollution sources) Small Quantity Generators, between 100 kg and 1000 kg of hazardous waste/month (Resource Conservation and Recovery Act (tracking hazardous waste)) - notification TRI REPORTER (Tracking of toxic chemicals releasing facilities) Business SIC classification: CUSTOM COMPOUNDING OF PURCHASED PLASTICS RESINS; ELECTRICAL MACHINERY, EQUIPMENT, AND SUPPLIES Organizations: JOHN A BUTLER JR (CONTACT/OWNER)
Alternative names: APEX MARBLE INC
MAGNESYS (1255A PARKMOOR AVE in SAN JOSE, CA)
(Resource Conservation and Recovery Act (tracking hazardous waste))
MCCLINTOCK METAL FABRICATORS (534 STOCKTON AVE in SAN JOSE, CA)
(Resource Conservation and Recovery Act (tracking hazardous waste)) Organizations: E M WELSH (CONTACT/OWNER)
GSS ARRAY TECHNOLOGY INCORPORATED (1297 PARKMOOR AVE. in SAN JOSE, CA)
Large Quantity Generators, more that 1000 kg of hazardous waste/month (Resource Conservation and Recovery Act (tracking hazardous waste)) TRI REPORTER (Tracking of toxic chemicals releasing facilities) Business SIC classification: PRINTED CIRCUIT BOARDS Business NAICS classification: BARE PRINTED CIRCUIT BOARD MANUFACTURING. Alternative names: ICI ARRAY TECHNOLOGY INC
Housing units lacking complete plumbing facilities: 0.3% Housing units lacking complete kitchen facilities: 2.1%
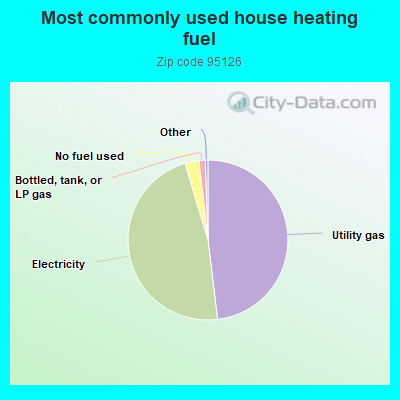
48.1%Utility gas
47.3%Electricity
2.8%No fuel used
1.3%Bottled, tank, or LP gas
Population in 1990: 24,778. Population change in the 1990s: +2,243 (+9.1%).
Place of birth for U.S.-born residents:
This state: 18,209
Northeast: 1,714
Midwest: 1,169
South: 1,237
West: 1,386
44% of the 95126 zip code residents lived in the same house 5 years ago. Out of people who lived in different houses, 72% lived in this county. Out of people who lived in different counties, 50% lived in California.
80% of the 95126 zip code residents lived in the same house 1 year ago. Out of people who lived in different houses, 54% moved from this county. Out of people who lived in different houses, 21% moved from different county within same state. Out of people who lived in different houses, 13% moved from different state. Out of people who lived in different houses, 10% moved from abroad.
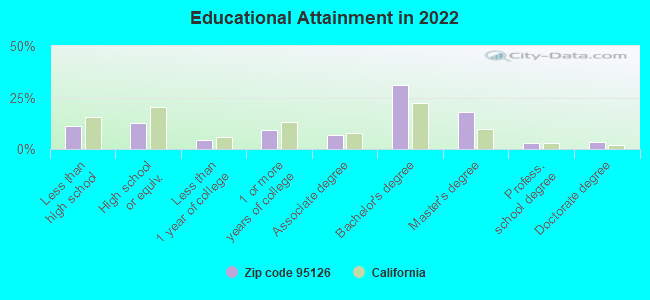
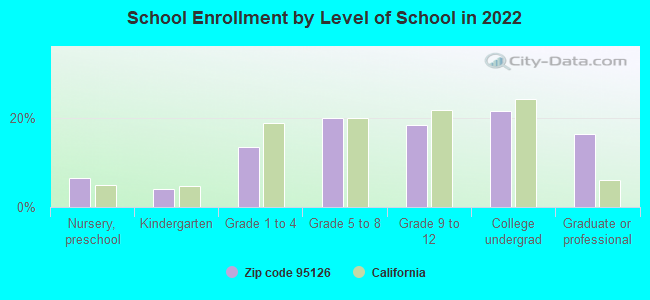
Private vs. public school enrollment:
Students in private schools in grades 1 to 8 (elementary and middle school): 615
Here:
21.8%
California:
10.5%
Students in private schools in grades 9 to 12 (high school): 403
Here:
26.5%
California:
8.5%
Students in private undergraduate colleges: 329
Here:
18.5%
California:
15.9%
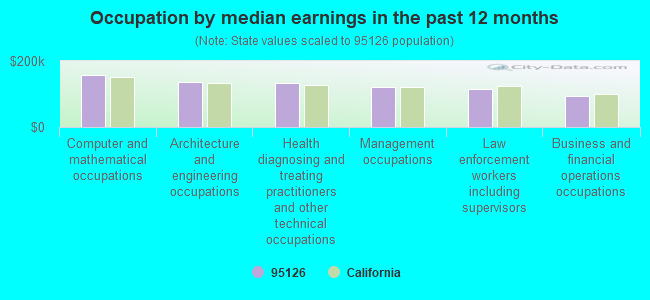
Occupation by median earnings in the past 12 months ($)
157,763Computer and mathematical occupations
136,109Architecture and engineering occupations
133,118Health diagnosing and treating practitioners and other technical occupations
121,360Management occupations
115,772Law enforcement workers including supervisors
94,012Business and financial operations occupations
Companies with federal contracts located in this zip code (SAN JOSE, CA):
GEOMETRIX, INC (1590 THE ALAMEDA, SUITE 20; small business) : $654,736 in 3 contractsfrom 1999 to 2003
$374,470 with Air Force for Other Defense -- Basic Research (R&D). Signed on 1999-12-28. Completion date: 2001-07-01.
$181,284 with Air Force for Defense Electronics and Communication Equipment -- Applied Research and Exploratory Development (R&D). Signed on 2003-05-09. Completion date: 2004-03-31.
$98,982 with Army for Other Defense -- Applied Research and Exploratory Development (R&D). Signed on 2002-10-22. Completion date: 2003-06-22.
YMCA OF SANTA CLARA VALLEY (1717 THE ALAMEDA) : $67,482 in 2 contractsfrom 2001 to 2002
$37,422 with Navy for Recreational Services. Signed on 2002-10-07. Completion date: 2003-09-30.
$30,060 with Navy for Care of Remains and/or Funeral Services. Signed on 2001-10-11. Completion date: 2002-09-30.
YOUNG MENS CHRISTIAN ASSOCIATI (1922 THE ALAMEDA, 3RD FLOO) : $50,920 in 2 contractsfrom 2003 to 2004
$32,200 with Navy for Recreational Services. Signed on 2004-09-28. Completion date: 2005-09-30.
$18,720, same as above.Signed on 2003-09-30. Completion date: 2004-09-30.
ALLCARE RESTORATION (782 AUZERAIS AVE; small business) : $20,084 in 2 contractsfrom 2002 to 2003
$19,084 with Navy for Maintenance, Repair or Alteration of Real Property -- Miscellaneous Buildings. Signed on 2002-09-30. Completion date: 2002-11-08.
$1,000, same as above.Signed on 2003-02-27. Completion date: 2003-03-31.
INTEGRATED SYSTEMS CONSULTANTS (1252 SHASTA AVE STE 1; small business)
$10,500 with Navy for Engineering and Technical Services. Signed on 2005-03-17. Completion date: 2005-04-18.
ECHELON CORPORATION (550 MERIDIAN AVE)
$7,757 with Navy for Miscellaneous Communication Equipment. Signed on 2005-02-23. Completion date: 2005-03-08.
PIERCE SIGNS & DISPLAY, INC (307 MERIDIAN AVENUE; small business)
$6,995 with Army for Wrapping and Packaging Machinery. Signed on 2003-04-14. Completion date: 2003-04-28.
CHESTER C LEHMANN CO , INC (1135 AUZERAIS AVE; small business) : $2,975 in 2 contractsin 2004
$2,965 with Navy for Resistors. Signed on 2004-07-06. Completion date: 2004-07-28.
$10, same as above.Signed on 2004-07-28. Completion date: 2004-07-28.
Top industries in this zip code by the number of employees in 2005:
Administrative and Support and Waste Management and Remediation Services: Temporary Help Services (500-999 employees: 1 establishment, 50-99 employees: 3 establishments, 20-49 employees: 1 establishment, 1-4 employees: 1 establishment)
Professional, Scientific, and Technical Services: Offices of Lawyers (20-49: 4, 10-19: 7, 5-9: 11, 1-4: 105)
2010 - 2017 National Fire Incident Reporting System (NFIRS) incidents
Based on the data from the years 2010 - 2017 the average number of fire incidents per year is 70. The highest number of fire incidents - 202 took place in 2017, and the least - 0 in 2012. The data has a growing trend.
When looking into fire subcategories, the most incidents belonged to: Outside Fires (69.9%), and Mobile Property/Vehicle Fires (14.7%).
Fire incident types reported to NFIRS in Zip Code 95126


 Nearest zip codes: 95110, 95128, 95113, 95053, 95112, 95125.


 Based on the data from the years 2010 - 2017 the average number of fire incidents per year is 70. The highest number of fire incidents - 202 took place in 2017, and the least - 0 in 2012. The data has a growing trend.
 When looking into fire subcategories, the most incidents belonged to: Outside Fires (69.9%), and Mobile Property/Vehicle Fires (14.7%).