Estimated zip code population in 2022: 52,890 Zip code population in 2010: 51,939 Zip code population in 2000: 46,184
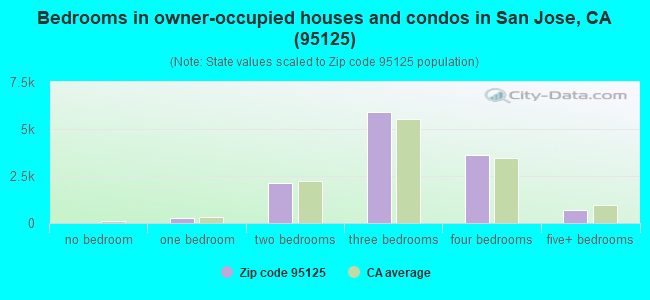
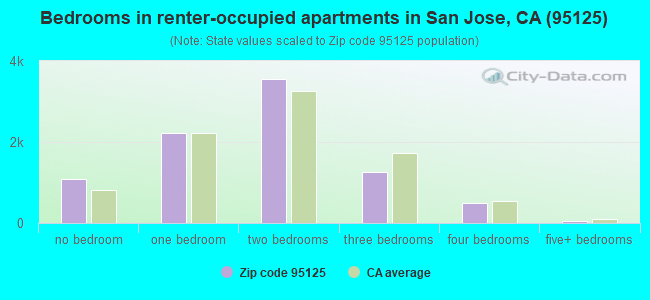
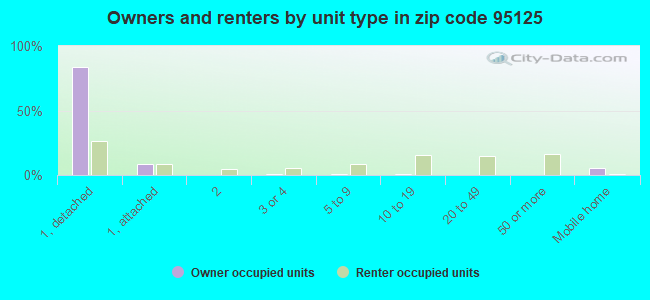
Houses and condos: 22,337 Renter-occupied apartments: 8,688
% of renters here:
41%
State:
44%
March 2022 cost of living index in zip code 95125: 126.8 (high, U.S. average is 100)
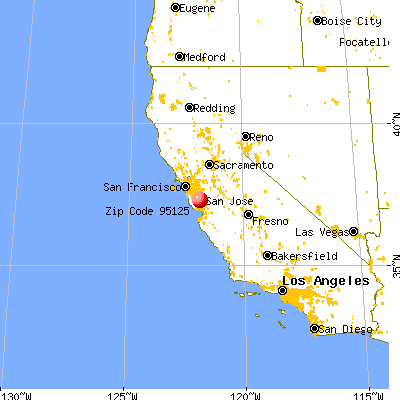
Land area: 8.0 sq. mi. Water area: 0.0 sq. mi.
Population density: 6,619 people per square mile
(high).
OSM Map
General Map
Google Map
MSN Map
OSM Map
General Map
Google Map
MSN Map
OSM Map
General Map
Google Map
MSN Map
OSM Map
General Map
Google Map
MSN Map
Please wait while loading the map...
Real estate property taxes paid for housing units in 2022:
This zip code:
0.6% ($10,292)
California:
0.7% ($4,831)
Median real estate property taxes paid for housing units with mortgages in 2022: $10,330 (0.6%) Median real estate property taxes paid for housing units with no mortgage in 2022: $5,091 (0.4%)
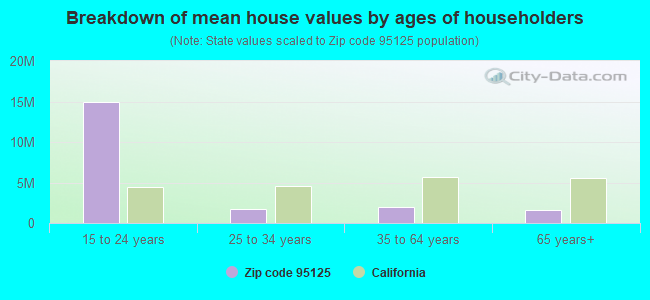
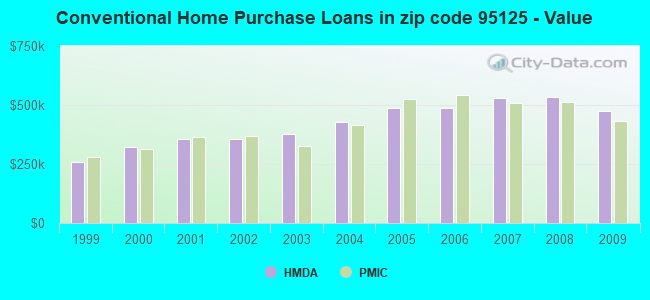
Estimated median house/condo value in 2022: $1,715,315
95125:
$1,715,315
California:
$715,900
According to our research of California and other state lists, there were 74 registered sex offenders living in 95125 zip code as of April 27, 2024. The ratio of all residents to sex offenders in zip code 95125 is 739 to 1. The ratio of registered sex offenders to all residents in this zip code is near the state average.
Median resident age:
This zip code:
42.2 years
California median age:
37.9 years
Average household size:
This zip code:
2.4 people
California:
2.8 people
Averages for the 2020 tax year for zip code 95125, filed in 2021:
Average Adjusted Gross Income (AGI) in 2020: $206,778 (Individual Income Tax Returns)
Here:
$206,778
State:
$95,910
Salary/wage: $188,249 (reported on 79.9% of returns)
Here:
$188,249
State:
$77,331
(% of AGI for various income ranges: 1232.1% for AGIs below $25k, 4031.8% for AGIs $25k-50k, 7276.3% for AGIs $50k-75k, 10716.7% for AGIs $75k-100k, 20445.8% for AGIs $100k-200k, 185930.6% for AGIs over 200k)
Taxable interest for individuals: $2,373 (reported on 49.8% of returns)
This zip code:
$2,373
California:
$2,294
(% of AGI for various income ranges: 40.1% for AGIs below $25k, 44.1% for AGIs $25k-50k, 74.7% for AGIs $50k-75k, 154.9% for AGIs $75k-100k, 246.5% for AGIs $100k-200k, 1196.8% for AGIs over 200k)
Ordinary dividends: $10,012 (reported on 42.1% of returns)
Here:
$10,012
State:
$10,949
(% of AGI for various income ranges: 73.9% for AGIs below $25k, 107.2% for AGIs $25k-50k, 205.4% for AGIs $50k-75k, 403.3% for AGIs $75k-100k, 751.2% for AGIs $100k-200k, 4830.0% for AGIs over 200k)
Net capital gain/loss in AGI: +$51,974 (reported on 40.9% of returns)
Here:
+$51,974
State:
+$49,306
(% of AGI for various income ranges: 48.1% for AGIs below $25k, 90.0% for AGIs $25k-50k, 177.5% for AGIs $50k-75k, 344.5% for AGIs $75k-100k, 994.2% for AGIs $100k-200k, 31738.5% for AGIs over 200k)
Profit/loss from business: +$30,032 (reported on 16.8% of returns)
Here:
+$30,032
State:
+$15,671
(% of AGI for various income ranges: 180.9% for AGIs below $25k, 223.9% for AGIs $25k-50k, 257.0% for AGIs $50k-75k, 498.1% for AGIs $75k-100k, 1111.1% for AGIs $100k-200k, 5140.2% for AGIs over 200k)
Taxable individual retirement arrangement distribution: $23,492 (reported on 10.0% of returns)
95125:
$23,492
California:
$23,505
(% of AGI for various income ranges: 81.7% for AGIs below $25k, 135.4% for AGIs $25k-50k, 259.4% for AGIs $50k-75k, 455.7% for AGIs $75k-100k, 931.1% for AGIs $100k-200k, 1467.0% for AGIs over 200k)
Self-employed (Keogh) retirement plans: $33,381 (reported on 2.4% of returns)
95125:
$33,381
California:
$30,163
(% of AGI for various income ranges: 6.1% for AGIs below $25k, 17.6% for AGIs $50k-75k, 28.7% for AGIs $75k-100k, 112.8% for AGIs $100k-200k, 1061.5% for AGIs over 200k)
Total itemized deductions: $38,856 (reported on 28.9% of returns)
Here:
$38,856
State:
$39,517
(% of AGI for various income ranges: 197.1% for AGIs below $25k, 320.0% for AGIs $25k-50k, 543.5% for AGIs $50k-75k, 1262.8% for AGIs $75k-100k, 2556.9% for AGIs $100k-200k, 11889.6% for AGIs over 200k)
Charity contributions: $8,994 (reported on 24.3% of returns)
Here:
$8,994
State:
$12,598
(% of AGI for various income ranges: 7.5% for AGIs below $25k, 29.5% for AGIs $25k-50k, 60.9% for AGIs $50k-75k, 129.1% for AGIs $75k-100k, 307.7% for AGIs $100k-200k, 2831.3% for AGIs over 200k)
Taxes paid: $9,417 (reported on 28.8% of returns)
95125:
$9,417
State:
$8,807
(% of AGI for various income ranges: 41.2% for AGIs below $25k, 72.6% for AGIs $25k-50k, 142.3% for AGIs $50k-75k, 358.3% for AGIs $75k-100k, 733.0% for AGIs $100k-200k, 2688.6% for AGIs over 200k)
Earned income credit: $1,673 (reported on 5.6% of returns)
Here:
$1,673
State:
$2,074
(% of AGI for various income ranges: 50.6% for AGIs below $25k, 37.7% for AGIs $25k-50k)
Percentage of individuals using paid preparers for their 2020 taxes: 92.6%
Here:
93%
State:
92%
(% for various income ranges: 89.0% for AGIs below $25k, 91.8% for AGIs $25k-50k, 92.8% for AGIs $50k-75k, 91.9% for AGIs $75k-100k, 93.5% for AGIs $100k-200k, 95.2% for AGIs over 200k)
Averages for the 2012 tax year for zip code 95125, filed in 2013:
Average Adjusted Gross Income (AGI) in 2012: $125,906 (Individual Income Tax Returns)
Here:
$125,906
State:
$72,726
Salary/wage: $116,213 (reported on 80.7% of returns)
Here:
$116,213
State:
$59,079
(% of AGI for various income ranges: 68.1% for AGIs below $25k, 75.2% for AGIs $25k-50k, 71.7% for AGIs $50k-75k, 69.2% for AGIs $75k-100k, 76.0% for AGIs $100k-200k, 74.9% for AGIs over 200k)
Taxable interest for individuals: $2,004 (reported on 50.5% of returns)
This zip code:
$2,004
California:
$2,146
(% of AGI for various income ranges: 1.7% for AGIs below $25k, 1.1% for AGIs $25k-50k, 1.1% for AGIs $50k-75k, 1.0% for AGIs $75k-100k, 0.8% for AGIs $100k-200k, 0.7% for AGIs over 200k)
Ordinary dividends: $7,216 (reported on 36.8% of returns)
Here:
$7,216
State:
$9,308
(% of AGI for various income ranges: 3.4% for AGIs below $25k, 1.9% for AGIs $25k-50k, 2.1% for AGIs $50k-75k, 2.5% for AGIs $75k-100k, 1.9% for AGIs $100k-200k, 2.1% for AGIs over 200k)
Net capital gain/loss in AGI: +$18,016 (reported on 34.7% of returns)
Here:
+$18,016
State:
+$30,460
(% of AGI for various income ranges: 0.5% for AGIs $25k-50k, 0.8% for AGIs $50k-75k, 1.0% for AGIs $75k-100k, 1.6% for AGIs $100k-200k, 7.8% for AGIs over 200k)
Profit/loss from business: +$28,710 (reported on 17.2% of returns)
Here:
+$28,710
State:
+$17,064
(% of AGI for various income ranges: 9.8% for AGIs below $25k, 5.5% for AGIs $25k-50k, 4.9% for AGIs $50k-75k, 4.7% for AGIs $75k-100k, 4.9% for AGIs $100k-200k, 3.0% for AGIs over 200k)
Taxable individual retirement arrangement distribution: $20,173 (reported on 11.3% of returns)
95125:
$20,173
California:
$19,557
(% of AGI for various income ranges: 4.0% for AGIs below $25k, 2.9% for AGIs $25k-50k, 3.3% for AGIs $50k-75k, 3.1% for AGIs $75k-100k, 2.2% for AGIs $100k-200k, 1.2% for AGIs over 200k)
Self-employment retirement plans: $23,211 (reported on 2.3% of returns)
95125:
$23,211
California:
$24,530
(% of AGI for various income ranges: 0.3% for AGIs below $25k, 0.2% for AGIs $50k-75k, 0.3% for AGIs $75k-100k, 0.4% for AGIs $100k-200k, 0.5% for AGIs over 200k)
Total itemized deductions: $42,868 (20% of AGI, reported on 50.9% of returns)
Here:
$42,868
State:
$34,004
Here:
20.2% of AGI
State:
22.7% of AGI
(% of AGI for various income ranges: 17.7% for AGIs below $25k, 12.4% for AGIs $25k-50k, 15.5% for AGIs $50k-75k, 18.2% for AGIs $75k-100k, 20.7% for AGIs $100k-200k, 16.5% for AGIs over 200k)
Charity contributions: $3,989 (reported on 43.0% of returns)
Here:
$3,989
State:
$4,659
(% of AGI for various income ranges: 0.8% for AGIs below $25k, 0.9% for AGIs $25k-50k, 1.3% for AGIs $50k-75k, 1.6% for AGIs $75k-100k, 1.6% for AGIs $100k-200k, 1.3% for AGIs over 200k)
Taxes paid: $21,947 (reported on 50.8% of returns)
95125:
$21,947
State:
$14,448
(% of AGI for various income ranges: 3.5% for AGIs below $25k, 2.9% for AGIs $25k-50k, 4.6% for AGIs $50k-75k, 6.9% for AGIs $75k-100k, 9.0% for AGIs $100k-200k, 10.2% for AGIs over 200k)
Earned income credit: $1,740 (reported on 8.2% of returns)
Here:
$1,740
State:
$2,286
(% of AGI for various income ranges: 3.4% for AGIs below $25k, 0.6% for AGIs $25k-50k)
Percentage of individuals using paid preparers for their 2012 taxes: 59.7%
Here:
60%
State:
64%
(% for various income ranges: 54.2% for AGIs below $25k, 59.3% for AGIs $25k-50k, 58.6% for AGIs $50k-75k, 61.3% for AGIs $75k-100k, 61.6% for AGIs $100k-200k, 66.8% for AGIs over 200k)
Averages for the 2004 tax year for zip code 95125, filed in 2005:
Average Adjusted Gross Income (AGI) in 2004: $91,710 (Individual Income Tax Returns)
Here:
$91,710
State:
$58,600
Salary/wage: $82,684 (reported on 78.9% of returns)
Here:
$82,684
State:
$49,455
(% of AGI for various income ranges: 392.0% for AGIs below $10k, 64.9% for AGIs $10k-25k, 74.5% for AGIs $25k-50k, 73.4% for AGIs $50k-75k, 77.3% for AGIs $75k-100k, 69.4% for AGIs over 100k)
Taxable interest for individuals: $2,674 (reported on 61.0% of returns)
This zip code:
$2,674
California:
$2,365
(% of AGI for various income ranges: 42.2% for AGIs below $10k, 3.9% for AGIs $10k-25k, 2.4% for AGIs $25k-50k, 1.9% for AGIs $50k-75k, 1.6% for AGIs $75k-100k, 1.6% for AGIs over 100k)
Taxable dividends: $3,770 (reported on 40.3% of returns)
Here:
$3,770
State:
$4,746
(% of AGI for various income ranges: 38.1% for AGIs below $10k, 3.4% for AGIs $10k-25k, 2.1% for AGIs $25k-50k, 2.0% for AGIs $50k-75k, 1.6% for AGIs $75k-100k, 1.4% for AGIs over 100k)
Net capital gain/loss: +$21,282 (reported on 37.8% of returns)
Here:
+$21,282
State:
+$23,418
(% of AGI for various income ranges: -5.3% for AGIs below $10k, 0.2% for AGIs $10k-25k, 0.9% for AGIs $25k-50k, 0.9% for AGIs $50k-75k, 2.1% for AGIs $75k-100k, 12.0% for AGIs over 100k)
Profit/loss from business: +$28,276 (reported on 17.0% of returns)
Here:
+$28,276
State:
+$16,826
(% of AGI for various income ranges: 40.2% for AGIs below $10k, 7.4% for AGIs $10k-25k, 5.8% for AGIs $25k-50k, 6.0% for AGIs $50k-75k, 5.2% for AGIs $75k-100k, 4.9% for AGIs over 100k)
IRA payment deduction: $3,264 (reported on 2.8% of returns)
95125:
$3,264
California:
$3,192
(% of AGI for various income ranges: 1.6% for AGIs below $10k, 0.3% for AGIs $10k-25k, 0.2% for AGIs $25k-50k, 0.2% for AGIs $50k-75k, 0.2% for AGIs $75k-100k, 0.1% for AGIs over 100k)
Self-employed pension: $16,801 (reported on 3.0% of returns)
Here:
$16,801
California:
$17,688
(% of AGI for various income ranges: 0.2% for AGIs $10k-25k, 0.3% for AGIs $25k-50k, 0.4% for AGIs $50k-75k, 0.5% for AGIs $75k-100k, 0.6% for AGIs over 100k)
Total itemized deductions: $33,117 (22% of AGI, reported on 52.1% of returns)
Here:
$33,117
State:
$28,113
Here:
22.3% of AGI
State:
25.3% of AGI
(% of AGI for various income ranges: 158.2% for AGIs below $10k, 17.5% for AGIs $10k-25k, 15.6% for AGIs $25k-50k, 20.1% for AGIs $50k-75k, 23.0% for AGIs $75k-100k, 18.3% for AGIs over 100k)
Charity contributions deductions: $3,595 (2% of AGI, reported on 47.0% of returns)
Here:
$3,595
State:
$3,923
Here:
2.3% of AGI
State:
3.3% of AGI
(% of AGI for various income ranges: 4.8% for AGIs below $10k, 1.2% for AGIs $10k-25k, 1.5% for AGIs $25k-50k, 1.9% for AGIs $50k-75k, 2.2% for AGIs $75k-100k, 1.8% for AGIs over 100k)
Total tax: $17,798 (reported on 83.8% of returns)
95125:
$17,798
State:
$10,761
(% of AGI for various income ranges: 20.8% for AGIs below $10k, 4.7% for AGIs $10k-25k, 8.1% for AGIs $25k-50k, 10.9% for AGIs $50k-75k, 11.5% for AGIs $75k-100k, 19.0% for AGIs over 100k)
Earned income credit: $1,292 (reported on 6.0% of returns)
Here:
$1,292
State:
$1,763
Percentage of individuals using paid preparers for their 2004 taxes: 62.9%
Here:
63%
State:
66%
(% for various income ranges: 53.9% for AGIs below $10k, 63.2% for AGIs $10k-25k, 61.8% for AGIs $25k-50k, 66.1% for AGIs $50k-75k, 64.9% for AGIs $75k-100k, 65.7% for AGIs over 100k)
Likely homosexual households (counted as self-reported same-sex unmarried-partner households)
Lesbian couples: 0.2% of all households
Gay men: 0.2% of all households
Household received Food Stamps/SNAP in the past 12 months: 1,212 Household did not receive Food Stamps/SNAP in the past 12 months: 19,770
Women who had a birth in the past 12 months: 606 (494 now married, 110 unmarried) Women who did not have a birth in the past 12 months: 11,556 (5,142 now married, 6,390 unmarried)
Housing units in zip code 95125 with a mortgage: 9,014 (1,303 second mortgage, 5 home equity loan, 1,284 both second mortgage and home equity loan) Houses without a mortgage: 355
Median monthly owner costs for units with a mortgage: $3,876 Median monthly owner costs for units without a mortgage: $1,058
Residents with income below the poverty level in 2022:
This zip code:
5.9%
Whole state:
12.2%
Residents with income below 50% of the poverty level in 2022:
This zip code:
3.1%
Whole state:
6.2%
Median number of rooms in houses and condos:
Here:
6.3
State:
6.0
Median number of rooms in apartments:
Here:
3.7
State:
3.9
Notable locations in this zip code not listed on our city pages
Notable locations in zip code 95125: Lincoln Glen Manor for Seniors (A), Willow Glen Branch San Jose Public Library (B), San Jose Fire Department Station 6 (C). Display/hide their locations on the map
Churches in zip code 95125 include: Ethopian Christian Fellowship Church (A), Kingdom Hall of Jehovahs Witnesses (B), Lincoln Glen Church (C), Saint Christophers Church (D), Willow Glen Assembly of God Church (E), Willow Glen United Methodist Church (F), Elim Presbyterian Church (G), First Congregational Church (H), Southbay Iranian Church (I). Display/hide their locations on the map
Parks in zip code 95125 include: Palm Haven Park (1), Biebrach Park (2), Willow Glen Park (3), Kirk Park (4), Lincoln Glen Park (5), River Glen Park (6), Wallenberg Park (7), Wilcox Park (8). Display/hide their locations on the map
7,529 married couples with children.
2,477 single-parent households (1,137 men, 1,340 women).
65.8% of residents of 95125 zip code speak English at home.
17.8% of residents speak Spanish at home (60% very well, 18% well, 15% not well, 7% not at all).
5.8% of residents speak other Indo-European language at home (82% very well, 8% well, 8% not well, 1% not at all).
9.8% of residents speak Asian or Pacific Island language at home (58% very well, 24% well, 16% not well, 2% not at all).
0.8% of residents speak other language at home (71% very well, 23% well, 6% not well).
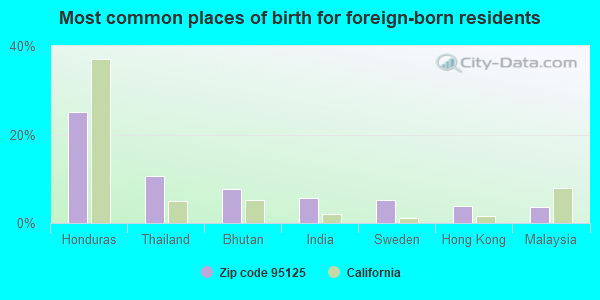
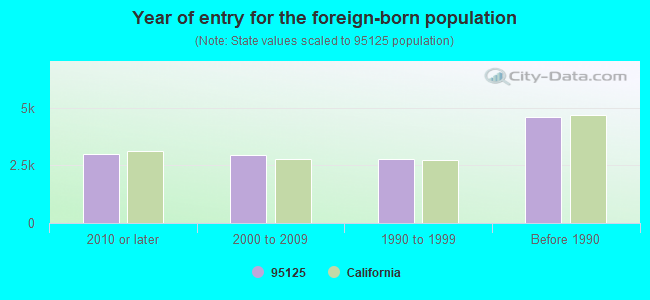
Foreign born population: 12,716 (24.0%) (59.0% of them are naturalized citizens)
Major facilities with environmental interests located in this zip code:
GENERAL ELECTRIC NUCLEAR ENERGY (175 CURTNER AVENUE MC 402 in SAN JOSE, CA)
STATE MASTER (California - Hazardous Waste Tracking) - HAZARDOU WASTE PROGRAM COMPLIANCE ACTIVITY (Tracking inspections of insecticide, fungicide, and rodenticide, and toxic substances) CRITERIA AND HAZARDOUS AIR POLLUTANT INVENTORY (Inventory of air pollution sources) (Resource Conservation and Recovery Act (tracking hazardous waste)) HAZARDOUS WASTE BIENNIAL REPORTER (Resource Conservation and Recovery Act (tracking hazardous waste)) Large Quantity Generators, more that 1000 kg of hazardous waste/month (Resource Conservation and Recovery Act (tracking hazardous waste)) TRI REPORTER (Tracking of toxic chemicals releasing facilities) Business SIC classification: MEASURING AND CONTROLLING DEVICES; COMMERCIAL PHYSICAL AND BIOLOGICAL RESEARCH Business NAICS classification: INSTRUMENTS AND RELATED PRODUCTS MANUFACTURING FOR MEASURING, DISPLAYING, AND CONTROLLING INDUSTRIAL PROCESS VARIABLES. Organizations: GENERAL ELECTRIC CO (CONTACT/OPERATOR)
Alternative names: G E NUCLEAR ENERGY, GE CO. NUCLEAR ENERGY, GE NUCLEAR ENERGY
GLASFORMS INCORPORATED (271 BARNARD AVENUE in SAN JOSE, CA)
STATE MASTER (California - Hazardous Waste Tracking) - HAZARDOU WASTE PROGRAM CRITERIA AND HAZARDOUS AIR POLLUTANT INVENTORY (Inventory of air pollution sources) Small Quantity Generators, between 100 kg and 1000 kg of hazardous waste/month (Resource Conservation and Recovery Act (tracking hazardous waste)) TRI REPORTER (Tracking of toxic chemicals releasing facilities) Business SIC classification: PLASTICS PRODUCTS Business NAICS classification: OTHER PRESSED AND BLOWN GLASS AND GLASSWARE MANUFACTURING. Alternative names: GLASSFORMS, INC
A AND WILTZ AUTO BODY (1815 ANGELA ST in SAN JOSE, CA)
STATE MASTER (California - Hazardous Waste Tracking) - HAZARDOU WASTE PROGRAM CRITERIA AND HAZARDOUS AIR POLLUTANT INVENTORY (Inventory of air pollution sources) Small Quantity Generators, between 100 kg and 1000 kg of hazardous waste/month (Resource Conservation and Recovery Act (tracking hazardous waste)) - notification Business SIC classification: TOP, BODY, AND UPHOLSTERY REPAIR SHOPS AND PAINT SHOPS Organizations: RAY ACUNA AND WILLIAM WILTZ (CONTACT/OWNER)
Alternative names: A & WILLTZ AUTO BODY
LINCOLN AVENUE CLEANERS (990 COE AVENUE in SAN JOSE, CA)
STATE MASTER (California - Hazardous Waste Tracking) - HAZARDOU WASTE PROGRAM CRITERIA AND HAZARDOUS AIR POLLUTANT INVENTORY (Inventory of air pollution sources) Small Quantity Generators, between 100 kg and 1000 kg of hazardous waste/month (Resource Conservation and Recovery Act (tracking hazardous waste)) Business SIC classification: DRYCLEANING PLANTS, EXCEPT RUG CLEANING Alternative names: ONE HOUR CLEANERS
FULLER EXCAVATING & DEMOLITION INC (2190 STONE AVE in SAN JOSE, CA)
STATE MASTER (California - Hazardous Waste Tracking) - HAZARDOU WASTE PROGRAM TRANSPORTER (Resource Conservation and Recovery Act (tracking hazardous waste)) Organizations: PAT FULLER (CONTACT/OWNER)
CHEVRON STATION NO 96139 (2252 LINCOLN AVE in SAN JOSE, CA)
STATE MASTER (California - Hazardous Waste Tracking) - HAZARDOU WASTE PROGRAM Small Quantity Generators, between 100 kg and 1000 kg of hazardous waste/month (Resource Conservation and Recovery Act (tracking hazardous waste)) - notification Organizations: CHEVRON PRODUCTS CO (CONTACT/OWNER)
LIBERTY HIGH (ALTERNATIVE) (2177 COTTLE AVE. in SAN JOSE, CA)
(National Center for Education Statistics) - STATE ID-4330502 Organizations: SAN JOSE UNIFIED (SCHOOL DISTRICT)
GARDNER ELEMENTARY (502 ILLINOIS AVE. in SAN JOSE, CA)
(National Center for Education Statistics) - STATE ID-6048532 Organizations: SAN JOSE UNIFIED (SCHOOL DISTRICT)
CANOAS ELEMENTARY (800 WREN DR. in SAN JOSE, CA)
(National Center for Education Statistics) - STATE ID-6048490 Organizations: SAN JOSE UNIFIED (SCHOOL DISTRICT)
ERNESTO GALARZA ELEMENTARY (1610 BIRD AVENUE in SAN JOSE, CA)
(National Center for Education Statistics) - STATE ID-6119010 Organizations: SAN JOSE UNIFIED (SCHOOL DISTRICT)
MAACO AUTO PAINTING AND BODYWORKS (1712 STONE AVE in SAN JOSE, CA)
Small Quantity Generators, between 100 kg and 1000 kg of hazardous waste/month (Resource Conservation and Recovery Act (tracking hazardous waste)) - notification Small Quantity Generators, between 100 kg and 1000 kg of hazardous waste/month (Resource Conservation and Recovery Act (tracking hazardous waste)) - notification Organizations: MORT VOSSOUGHI (CONTACT/OWNER)
Alternative names: AUTO INVEST, INC DBA MAACO AUTO
KORMET (460 LANO STREET in SAN JOSE, CA)
(Resource Conservation and Recovery Act (tracking hazardous waste)) Organizations: DAVID & ANA PAYNE (CONTACT/OWNER)
NITREX INC. (441 PERRYMONT AVENUE in SAN JOSE, CA)
CRITERIA AND HAZARDOUS AIR POLLUTANT INVENTORY (Inventory of air pollution sources) Small Quantity Generators, between 100 kg and 1000 kg of hazardous waste/month (Resource Conservation and Recovery Act (tracking hazardous waste)) - notification TRI REPORTER (Tracking of toxic chemicals releasing facilities) Business SIC and NAICS classification: METAL HEAT TREATING Organizations: ALLOY HARD SURFACING INC (CONTACT/OWNER)
Alternative names: ALLOY HARD SURFACING INC
Housing units lacking complete plumbing facilities: 0.8% Housing units lacking complete kitchen facilities: 2.3%
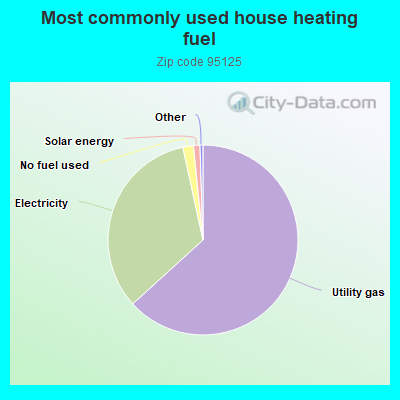
63.2%Utility gas
33.3%Electricity
1.8%No fuel used
1.1%Solar energy
Population in 1990: 42,573. Population change in the 1990s: +3,611 (+8.5%).
Place of birth for U.S.-born residents:
This state: 29,483
Northeast: 2,651
Midwest: 2,879
South: 2,299
West: 2,148
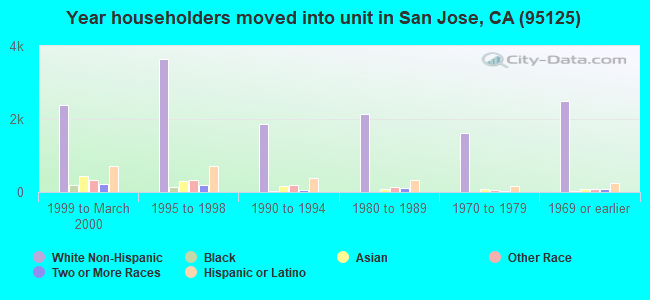
56% of the 95125 zip code residents lived in the same house 5 years ago. Out of people who lived in different houses, 68% lived in this county. Out of people who lived in different counties, 50% lived in California.
87% of the 95125 zip code residents lived in the same house 1 year ago. Out of people who lived in different houses, 62% moved from this county. Out of people who lived in different houses, 22% moved from different county within same state. Out of people who lived in different houses, 9% moved from different state. Out of people who lived in different houses, 5% moved from abroad.
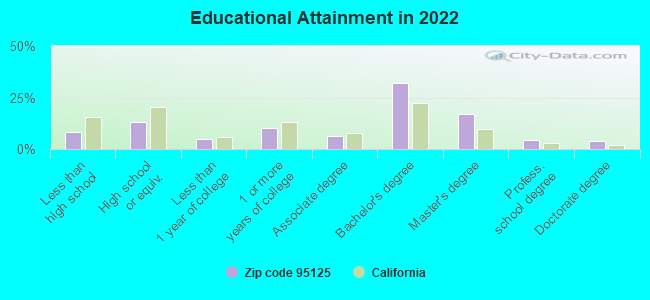
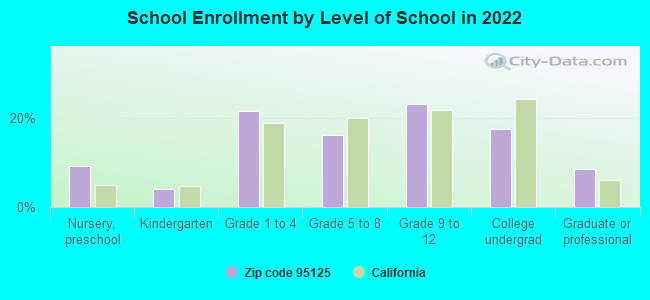
Private vs. public school enrollment:
Students in private schools in grades 1 to 8 (elementary and middle school): 1,435
Here:
31.8%
California:
10.5%
Students in private schools in grades 9 to 12 (high school): 1,118
Here:
41.1%
California:
8.5%
Students in private undergraduate colleges: 390
Here:
19.0%
California:
15.9%
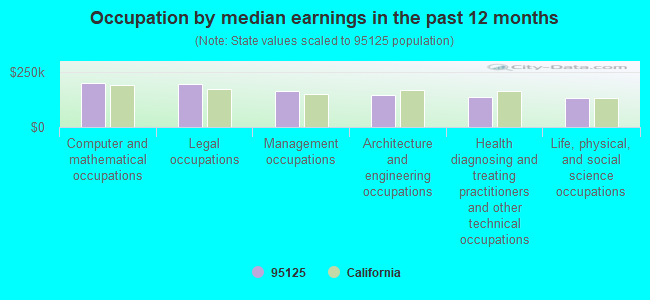
Occupation by median earnings in the past 12 months ($)
198,334Computer and mathematical occupations
195,585Legal occupations
162,584Management occupations
145,080Architecture and engineering occupations
134,688Health diagnosing and treating practitioners and other technical occupations
130,564Life, physical, and social science occupations
Companies with federal contracts located in this zip code (SAN JOSE, CA):
PCM MECHANICAL, INC (12 SAN JOSE AVE; small business) : $530,998 in 2 contractsin 2000
$379,169 with Army for Maintenance, Repair and Rebuilding of Equipment -- Furnace, Steam Plant, and Drying Equipment; and Nuclear Reactors. Signed on 2000-02-12. Completion date: 1999-08-17.
$151,829, same as above.Signed on 2000-02-14. Completion date: 2003-08-01.
INTERTEST EQUIPMENT SERVICES I (2175 STONE AVE STE 10; small business)
$69,845 with Navy for Electrical and Electronic Properties Measuring and Testing Instruments. Signed on 2005-05-20. Completion date: 2005-06-30.
RICAHRD A ELLESEN (1131 RUTH DR; small business) : $60,000 in 2 contractsfrom 2004 to 2005
$30,000 with Army for Land Surveys, Cadastral Services (non-construction). Signed on 2005-05-06. Completion date: 2006-05-05.
$30,000, same as above.Signed on 2004-01-11. Completion date: 2005-01-11.
FILLMORE GROUP, THE (1062 WILLOW ST; small business) : $37,600 in 2 contractsin 2004
$18,800 with U.S. Army Corps of Engineers - civil program financing only for Other Professional Services. Taking place in DC. Signed on 2004-01-07. Completion date: 2004-01-30.
$18,800 with Army for Other Professional Services. Taking place in DC. Signed on 2004-01-07. Completion date: 2004-01-30.
SHELF-RACK WHOLE SALE PRODUCTS (1616 SPRKLING WAY; small business)
$31,809 with Army for Household Furniture. Signed on 2001-06-18. Completion date: 2001-08-01.
GLOBAL ELECTRO SYSTEMS INC (270-C CIMINO ST; small business) : $21,112 in 2 contractsin 2004
$20,000 with Navy for Switches. Signed on 2004-09-13. Completion date: 2004-09-22.
$1,112, same as above.Signed on 2004-12-08. Completion date: 2004-09-22.
MODULAR INDUSTRIAL SOLUTIONS I (1729 LITTLE ORCHARD ST; small business) : $13,983 in 2 contractsin 2005
$7,503 with Air Force for ADP Central Processing Unit (CPU, Computer), Analog. Signed on 2005-04-04. Completion date: 2005-05-04.
$6,480 with Air Force for ADP Input/Output and Storage Devices. Signed on 2005-06-13. Completion date: 2005-07-10.
DANCE EQUIPMENT INTERNATIONAL (2103 LINCOLN AVE STE C; small business) : $13,039 in 3 contractsfrom 2005 to 2006
$5,737 with Army for Recreational and Gymnastic Equipment. Signed on 2005-08-17. Completion date: 2005-09-12.
$4,501 with Air Force for Recreational and Gymnastic Equipment. Taking place in TX. Signed on 2006-04-04. Completion date: 2006-06-26.
$2,801 with Bureau of Prisoners/Federal Prison System for Recreational and Gymnastic Equipment. Signed on 2005-08-15. Completion date: 2005-09-30.
DRE COMMUNICATIONS CO (1723-D LITTLE ORCHARD STR; small business)
$7,340 with Army for Telephone and Telegraph Equipment. Signed on 2004-10-06. Completion date: 2004-11-12.
Top industries in this zip code by the number of employees in 2005:
Administrative and Support and Waste Management and Remediation Services: Office Administrative Services (500-999 employees: 1 establishment, 100-249 employees: 1 establishment, 50-99 employees: 2 establishments, 5-9 employees: 1 establishment, 1-4 employees: 2 establishments)
Administrative and Support and Waste Management and Remediation Services: Temporary Help Services (500-999: 1, 5-9: 1)
Other Services (except Public Administration): Religious Organizations (100-249: 3, 20-49: 1, 10-19: 3, 5-9: 5, 1-4: 10)
2005 - 2017 National Fire Incident Reporting System (NFIRS) incidents
Based on the data from the years 2005 - 2017 the average number of fire incidents per year is 14. The highest number of fire incidents - 54 took place in 2017, and the least - 0 in 2009. The data has a growing trend.
When looking into fire subcategories, the most incidents belonged to: Outside Fires (56.8%), and Structure Fires (25.4%).
Fire incident types reported to NFIRS in Zip Code 95125


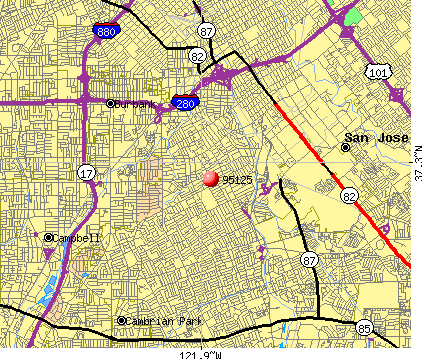 Nearest zip codes: 95113, 95118, 95126, 95136, 95124, 95128.


 Based on the data from the years 2005 - 2017 the average number of fire incidents per year is 14. The highest number of fire incidents - 54 took place in 2017, and the least - 0 in 2009. The data has a growing trend.
 When looking into fire subcategories, the most incidents belonged to: Outside Fires (56.8%), and Structure Fires (25.4%).