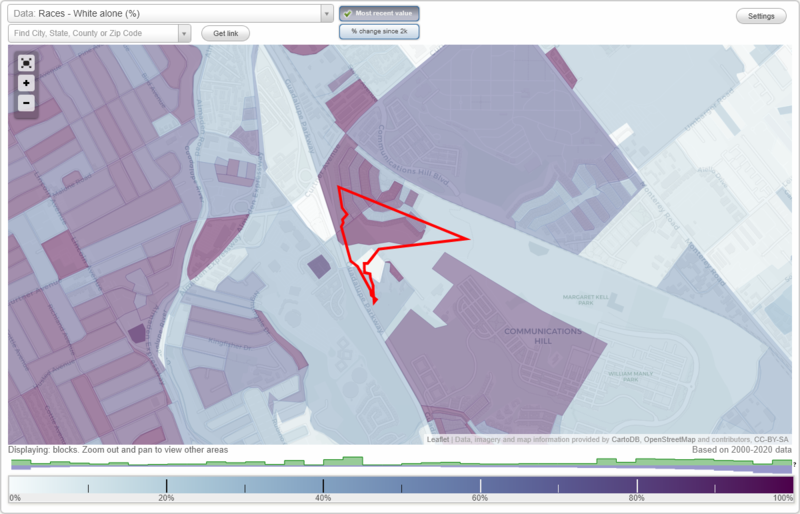
Carol Drive neighborhood in San Jose, California (CA), 95125 detailed profile
Settings
X

Business Search - 14 Million verified businesses
Area: 0.050 square miles
Population: 214
Population density:
Carol Drive: | 4,256 people per square mile |
San Jose: | 5,843 people per square mile |
- 8037.7%White
- 7836.8%Asian
- 4320.3%Hispanic or Latino
- 83.8%Two or more races
- 31.4%Black

Median household income in 2019:
Carol Drive: | $105,929 |
San Jose: | $115,893 |
Distribution of median household income
- 2Less than $10,000
- 5$10,000 to $19,999
- 5$20,000 to $29,999
- 8$30,000 to $39,999
- 7$40,000 to $49,999
- 5$50,000 to $59,999
- 4$60,000 to $74,999
- 8$75,000 to $99,999
- 12$100,000 to $124,999
- 6$125,000 to $149,999
- 12$150,000 to $199,999
- 20$200,000 or more
Distribution of owner-occupied house/condo value
- 1Less than $50,000
- 4$50,000 to $99,999
- 5$100,000 to $149,999
- 2$150,000 to $199,999
- 10$200,000 to $249,999
- 6$250,000 to $299,999
- 2$300,000 to $399,999
- 4$400,000 to $499,999
- 20$500,000 to $749,999
- 15$750,000 to $999,999
- 6$1,000,000 or more
Distribution of rent paid by renters
- 2$200 to $299
- 1$500 to $599
- 2$1,000 to $1,249
- 3$1,250 to $1,499
- 5$1,500 to $1,999
- 8$2,000 or more
Median rent in 2019:
Carol Drive: | $1,850 |
San Jose: | $2,001 |
Males: | 100 |
Females: | 114 |
Males:
This neighborhood: | 35.0 years |
Whole city: | 36.5 years |
This neighborhood: | 40.7 years |
Whole city: | 38.4 years |
Average household size:
Carol Drive: | 2.4 people |
San Jose: | 37.0 people |
Percentage of family households:
Carol Drive: | 49.2% |
San Jose: | 51.8% |
Here: | 44.6% |
San Jose: | 53.3% |
Percentage of married-couple families with children (among all households):
Carol Drive: | 27.5% |
San Jose: | 25.6% |
Percentage of single-mother households (among all households):
Carol Drive: | 12.3% |
San Jose: | 4.4% |
Percentage of never married males 15 years old and over:
Percentage of never married females 15 years old and over:
Carol Drive: | 13.3% |
San Jose: | 20.3% |
Percentage of never married females 15 years old and over:
Carol Drive: | 14.7% |
city: | 16.0% |
Percentage of people that speak English not well or not at all:
Carol Drive: | 3.0% |
San Jose: | 11.5% |
Percentage of people born in this state:
Percentage of people born in another U.S. state:
Percentage of native residents but born outside the U.S.:
Percentage of foreign born residents:
Here: | 52.9% |
San Jose: | 45.8% |
Percentage of people born in another U.S. state:
Carol Drive: | 18.0% |
San Jose: | 11.3% |
Percentage of native residents but born outside the U.S.:
Here: | 1.4% |
city: | 1.8% |
Percentage of foreign born residents:
Here: | 27.7% |
San Jose: | 41.1% |
Owner-occupied
Renter-occupied
- Rooms in owner-occupied houses and condos in Carol Drive
- 01 room
- 02 rooms
- 103 rooms
- 134 rooms
- 185 rooms
- 156 rooms
- 47 rooms
- 48 rooms
- 19+ rooms
- Rooms in renter-occupied apartments in Carol Drive
- 01 room
- 12 rooms
- 23 rooms
- 34 rooms
- 95 rooms
- 16 rooms
- 07 rooms
- 08 rooms
- 09+ rooms
Owner-occupied
Renter-occupied
- Bedrooms in owner-occupied houses and condos in Carol Drive
- 0no bedroom
- 21 bedroom
- 312 bedrooms
- 263 bedrooms
- 64 bedrooms
- 05+ bedrooms
- Bedrooms in renter-occupied apartments in Carol Drive
- 0no bedroom
- 11 bedroom
- 92 bedrooms
- 53 bedrooms
- 14 bedrooms
- 05+ bedrooms
Average number of cars or other vehicles available in houses/condos:
Average number of cars or other vehicles available in apartments:
This neighborhood: | 1.8 |
San Jose: | 2.3 |
Average number of cars or other vehicles available in apartments:
Here: | 1.9 |
city: | 1.6 |
Percentage of units with a mortgage:
Carol Drive: | 60.2% |
San Jose: | 68.0% |
- Year house built in Carol Drive
- 72014 or later
- 52010 to 2013
- 432000 to 2009
- 61990 to 1999
- 71980 to 1989
- 181970 to 1979
- 11960 to 1969
- 01950 to 1959
- 01940 to 1949
- 01939 or earlier
City-data.com crime index for city in 2019 (higher means more crime):
City: | 277.0 |
U.S. average: | 211.9 |
Travel time to work (commute)
- 2Less than 5 minutes
- 810 to 14 minutes
- 1715 to 19 minutes
- 1320 to 24 minutes
- 525 to 29 minutes
- 2030 to 34 minutes
- 335 to 39 minutes
- 440 to 44 minutes
- 1645 to 59 minutes
- 1060 to 89 minutes
- 990 or more minutes
Means of transportation to work
- 75.9%92Drove a car alone
- 7.4%9Carpooled
- 4.1%5Bus
- 0.8%1Long-distance train or commuter rail
- 1.6%2Taxi
- 0.8%1Motorcycle
- 0.8%1Walked
- 5.8%7Worked at home
Time leaving home to go to work
- 112:00 a.m. to 4:59 a.m.
- 25:00 a.m. to 5:29 a.m.
- 85:30 a.m. to 5:59 a.m.
- 66:00 a.m. to 6:29 a.m.
- 66:30 a.m. to 6:59 a.m.
- 207:00 a.m. to 7:29 a.m.
- 137:30 a.m. to 7:59 a.m.
- 138:00 a.m. to 8:29 a.m.
- 98:30 a.m. to 8:59 a.m.
- 129:00 a.m. to 9:59 a.m.
- 310:00 a.m. to 10:59 a.m.
- 212:00 p.m. to 3:59 p.m.
- 104:00 p.m. to 11:59 p.m.
Occupations of males:
- Percentage of males in management occupations (except farmers):
Here: 19.5% city: 12.5%
- Percentage of males in business and financial operations occupations:
Here: 3.8% city: 4.8%
- Percentage of males in computer and mathematical occupations:
Here: 14.4% city: 12.2%
- Percentage of males in architecture and engineering occupations:
Here: 10.0% city: 8.4%
- Percentage of males in life, physical, and social science occupations:
Here: 1.2% city: 1.0%
- Percentage of males in legal occupations:
Here: 1.9% city: 0.7%
- Percentage of males in education, training, and library occupations:
Here: 3.3% city: 2.6%
- Percentage of males in arts, design, entertainment, sports, and media occupations:
Here: 1.1% city: 2.1%
- Percentage of males in service occupations:
Here: 14.5% city: 13.8%
- Percentage of males in sales and office occupations:
Here: 17.1% city: 13.6%
- Percentage of males in construction, extraction, and maintenance occupations:
Here: 7.7% city: 8.3%
- Percentage of males in production occupations:
Here: 2.3% city: 6.2%
- Percentage of males in material moving occupations:
Here: 1.8% city: 3.3%
Occupations of females:
- Percentage of females in management occupations (except farmers):
Here: 9.2% city: 10.4%
- Percentage of females in business and financial operations occupations:
Here: 5.5% city: 8.3%
- Percentage of females in computer and mathematical occupations:
Here: 1.6% city: 4.4%
- Percentage of females in community and social services occupations:
Here: 1.2% city: 1.7%
- Percentage of females in legal occupations:
Here: 2.2% city: 1.1%
- Percentage of females in education, training, and library occupations:
Here: 6.1% city: 8.4%
- Percentage of females in arts, design, entertainment, sports, and media occupations:
Here: 2.1% city: 2.0%
- Percentage of females in healthcare practitioners and technical occupations:
Here: 9.3% city: 6.8%
- Percentage of females in service occupations:
Here: 19.7% city: 22.3%
- Percentage of females in sales and office occupations:
Here: 41.3% city: 24.1%
Education in this neighborhood (subdivision or community):
- Percentage of people 3 years and older in K-12 schools:
Carol Drive: 13.4% San Jose: 16.8%
- Percentage of people 3 years and older in undergraduate colleges:
Carol Drive: 3.0% San Jose: 6.9%
- Percentage of people 3 years and older in grad. or professional schools:
Carol Drive: 0.5% San Jose: 1.6%
- Percentage of students K-12 enrolled in private schools:
Carol Drive: 11.1% San Jose: 13.9%
Percentage of population below poverty level:
Carol Drive: | 4.7% |
San Jose: | 7.1% |
Median year owner moved in (as recorded in 2019):
Median year renter moved in (as recorded in 2019):
Carol Drive: | 2011 |
San Jose: | 2005 |
Median year renter moved in (as recorded in 2019):
Carol Drive: | 2015 |
San Jose: | 2016 |
Percentage of married-couple families with both working:
Carol Drive: | 66.1% |
San Jose: | 67.7% |
- 62.5%Utility gas
- 37.0%Electricity
- 0.5%Bottled, tank, or LP gas
Roads and streets:
Carol Dr
Length: 0.22 miles
Directions: E-W, N-S, SE-NW, SW-NE
Address range: 2432 to 2799
Directions: E-W, N-S, SE-NW, SW-NE
Address range: 2432 to 2799