Averages for the 2020 tax year for zip code 95113, filed in 2021:
Average Adjusted Gross Income (AGI) in 2020: $177,958 (Individual Income Tax Returns)
Here:
$177,958
State:
$95,910
Salary/wage: $143,196 (reported on 88.6% of returns)
Here:
$143,196
State:
$77,331
(% of AGI for various income ranges: 1235.3% for AGIs below $25k, 4105.3% for AGIs $25k-50k, 8070.8% for AGIs $50k-75k, 11175.6% for AGIs $75k-100k, 22127.4% for AGIs $100k-200k, 177831.7% for AGIs over 200k)
Taxable interest for individuals: $1,902 (reported on 33.6% of returns)
This zip code:
$1,902
California:
$2,294
(% of AGI for various income ranges: 1.8% for AGIs below $25k, 13.5% for AGIs $25k-50k, 33.3% for AGIs $50k-75k, 27.8% for AGIs $75k-100k, 47.4% for AGIs $100k-200k, 1188.3% for AGIs over 200k)
Ordinary dividends: $10,852 (reported on 32.9% of returns)
Here:
$10,852
State:
$10,949
(% of AGI for various income ranges: 8.8% for AGIs below $25k, 70.0% for AGIs $50k-75k, 44.4% for AGIs $75k-100k, 172.6% for AGIs $100k-200k, 7541.7% for AGIs over 200k)
Net capital gain/loss in AGI: +$87,194 (reported on 36.4% of returns)
Here:
+$87,194
State:
+$49,306
(% of AGI for various income ranges: 12.4% for AGIs below $25k, 7.6% for AGIs $25k-50k, 166.7% for AGIs $50k-75k, 217.8% for AGIs $75k-100k, 791.6% for AGIs $100k-200k, 70891.7% for AGIs over 200k)
Profit/loss from business: +$14,827 (reported on 15.7% of returns)
Here:
+$14,827
State:
+$15,671
(% of AGI for various income ranges: 142.4% for AGIs below $25k, 333.5% for AGIs $25k-50k, 293.3% for AGIs $50k-75k, 280.0% for AGIs $100k-200k, 2615.0% for AGIs over 200k)
Taxable individual retirement arrangement distribution: $27,425 (reported on 2.9% of returns)
95113:
$27,425
California:
$23,505
(% of AGI for various income ranges: 577.4% for AGIs $100k-200k)
Total itemized deductions: $35,760 (reported on 14.3% of returns)
Here:
$35,760
State:
$39,517
(% of AGI for various income ranges: 846.7% for AGIs $50k-75k, 1196.3% for AGIs $100k-200k, 6438.3% for AGIs over 200k)
Charity contributions: $11,900 (reported on 10.7% of returns)
Here:
$11,900
State:
$12,598
(% of AGI for various income ranges: 88.8% for AGIs $25k-50k, 95.3% for AGIs $100k-200k, 2421.7% for AGIs over 200k)
Taxes paid: $9,035 (reported on 14.3% of returns)
95113:
$9,035
State:
$8,807
(% of AGI for various income ranges: 200.8% for AGIs $50k-75k, 347.4% for AGIs $100k-200k, 1510.0% for AGIs over 200k)
Earned income credit: $1,056 (reported on 6.4% of returns)
Here:
$1,056
State:
$2,074
(% of AGI for various income ranges: 34.7% for AGIs below $25k, 21.2% for AGIs $25k-50k)
Percentage of individuals using paid preparers for their 2020 taxes: 94.3%
Here:
94%
State:
92%
(% for various income ranges: 92.3% for AGIs below $25k, 91.3% for AGIs $25k-50k, 94.1% for AGIs $50k-75k, 100.0% for AGIs $75k-100k, 93.9% for AGIs $100k-200k, 96.4% for AGIs over 200k)
Averages for the 2012 tax year for zip code 95113, filed in 2013:
Average Adjusted Gross Income (AGI) in 2012: $103,568 (Individual Income Tax Returns)
Here:
$103,568
State:
$72,726
Salary/wage: $89,968 (reported on 86.2% of returns)
Here:
$89,968
State:
$59,079
(% of AGI for various income ranges: 85.9% for AGIs below $25k, 94.0% for AGIs $25k-50k, 84.8% for AGIs $50k-75k, 89.1% for AGIs $75k-100k, 89.5% for AGIs $100k-200k, 62.3% for AGIs over 200k)
Taxable interest for individuals: $2,641 (reported on 31.9% of returns)
This zip code:
$2,641
California:
$2,146
(% of AGI for various income ranges: 0.3% for AGIs below $25k, 0.3% for AGIs $25k-50k, 0.1% for AGIs $75k-100k, 0.6% for AGIs $100k-200k, 1.2% for AGIs over 200k)
Ordinary dividends: $15,227 (reported on 22.4% of returns)
Here:
$15,227
State:
$9,308
(% of AGI for various income ranges: 1.3% for AGIs below $25k, 0.9% for AGIs $50k-75k, 0.3% for AGIs $75k-100k, 0.8% for AGIs $100k-200k, 5.6% for AGIs over 200k)
Net capital gain/loss in AGI: +$42,212 (reported on 20.7% of returns)
Here:
+$42,212
State:
+$30,460
(% of AGI for various income ranges: 0.6% for AGIs $50k-75k, 1.6% for AGIs $100k-200k, 15.2% for AGIs over 200k)
Profit/loss from business: +$44,355 (reported on 17.2% of returns)
Here:
+$44,355
State:
+$17,064
(% of AGI for various income ranges: 13.5% for AGIs below $25k, 6.6% for AGIs $25k-50k, 6.3% for AGIs $50k-75k, 9.4% for AGIs $75k-100k, 3.5% for AGIs $100k-200k, 8.6% for AGIs over 200k)
Taxable individual retirement arrangement distribution: $21,025 (reported on 3.4% of returns)
95113:
$21,025
California:
$19,557
Self-employment retirement plans: $41,450 (reported on 1.7% of returns)
95113:
$41,450
California:
$24,530
Total itemized deductions: $38,115 (18% of AGI, reported on 39.7% of returns)
Here:
$38,115
State:
$34,004
Here:
18.0% of AGI
State:
22.7% of AGI
(% of AGI for various income ranges: 7.6% for AGIs $25k-50k, 8.3% for AGIs $50k-75k, 11.4% for AGIs $75k-100k, 15.8% for AGIs $100k-200k, 17.2% for AGIs over 200k)
Charity contributions: $9,021 (reported on 24.1% of returns)
Here:
$9,021
State:
$4,659
(% of AGI for various income ranges: 0.5% for AGIs $25k-50k, 0.6% for AGIs $50k-75k, 0.9% for AGIs $75k-100k, 1.3% for AGIs $100k-200k, 3.1% for AGIs over 200k)
Taxes paid: $23,132 (reported on 37.9% of returns)
95113:
$23,132
State:
$14,448
(% of AGI for various income ranges: 2.3% for AGIs $25k-50k, 3.7% for AGIs $50k-75k, 6.6% for AGIs $75k-100k, 9.1% for AGIs $100k-200k, 10.4% for AGIs over 200k)
Earned income credit: $1,656 (reported on 15.5% of returns)
Here:
$1,656
State:
$2,286
(% of AGI for various income ranges: 5.4% for AGIs below $25k, 0.7% for AGIs $25k-50k)
Percentage of individuals using paid preparers for their 2012 taxes: 46.6%
Here:
47%
State:
64%
(% for various income ranges: 46.2% for AGIs below $25k, 47.8% for AGIs $25k-50k, 41.7% for AGIs $50k-75k, 40.0% for AGIs $75k-100k, 40.0% for AGIs $100k-200k, 66.7% for AGIs over 200k)
Averages for the 2004 tax year for zip code 95113, filed in 2005:
Average Adjusted Gross Income (AGI) in 2004: $60,961 (Individual Income Tax Returns)
Here:
$60,961
State:
$58,600
Salary/wage: $44,627 (reported on 84.7% of returns)
Here:
$44,627
State:
$49,455
(% of AGI for various income ranges: 85.5% for AGIs $10k-25k, 95.3% for AGIs $25k-50k, 84.9% for AGIs $50k-75k, 82.4% for AGIs $75k-100k, 39.4% for AGIs over 100k)
Taxable interest for individuals: $4,306 (reported on 28.7% of returns)
This zip code:
$4,306
California:
$2,365
(% of AGI for various income ranges: 0.0% for AGIs $10k-25k, 0.1% for AGIs $25k-50k, 0.3% for AGIs $50k-75k, 2.7% for AGIs $75k-100k, 3.0% for AGIs over 100k)
Taxable dividends: $2,966 (reported on 14.7% of returns)
Here:
$2,966
State:
$4,746
(% of AGI for various income ranges: 0.0% for AGIs $10k-25k, 0.5% for AGIs $50k-75k, 1.0% for AGIs over 100k)
Net capital gain/loss: +$6,419 (reported on 14.5% of returns)
Here:
+$6,419
State:
+$23,418
(% of AGI for various income ranges: -0.3% for AGIs $10k-25k, -0.3% for AGIs $50k-75k, 2.8% for AGIs over 100k)
Profit/loss from business: +$74,011 (reported on 15.0% of returns)
Here:
+$74,011
State:
+$16,826
(% of AGI for various income ranges: 8.3% for AGIs $10k-25k, 19.3% for AGIs $50k-75k, 26.1% for AGIs over 100k)
Self-employed pension: $26,643 (reported on 2.4% of returns)
Here:
$26,643
California:
$17,688
Total itemized deductions: $29,627 (20% of AGI, reported on 28.0% of returns)
Here:
$29,627
State:
$28,113
Here:
19.6% of AGI
State:
25.3% of AGI
(% of AGI for various income ranges: 3.9% for AGIs $10k-25k, 8.1% for AGIs $25k-50k, 10.9% for AGIs $50k-75k, 6.9% for AGIs $75k-100k, 17.3% for AGIs over 100k)
Charity contributions deductions: $5,712 (3% of AGI, reported on 19.9% of returns)
Here:
$5,712
State:
$3,923
Here:
3.3% of AGI
State:
3.3% of AGI
Total tax: $14,340 (reported on 79.8% of returns)
95113:
$14,340
State:
$10,761
(% of AGI for various income ranges: 6.0% for AGIs $10k-25k, 9.2% for AGIs $25k-50k, 14.3% for AGIs $50k-75k, 16.9% for AGIs $75k-100k, 23.5% for AGIs over 100k)
Earned income credit: $774 (reported on 10.5% of returns)
Here:
$774
State:
$1,763
Percentage of individuals using paid preparers for their 2004 taxes: 53.5%
Here:
53%
State:
66%
(% for various income ranges: 51.7% for AGIs below $10k, 51.1% for AGIs $10k-25k, 52.3% for AGIs $25k-50k, 46.9% for AGIs $50k-75k, 40.0% for AGIs $75k-100k, 73.8% for AGIs over 100k)
Likely homosexual households (counted as self-reported same-sex unmarried-partner households)
Lesbian couples: 0.0% of all households
Gay men: 1.7% of all households
Household received Food Stamps/SNAP in the past 12 months: 130 Household did not receive Food Stamps/SNAP in the past 12 months: 1,147
Women who did not have a birth in the past 12 months: 569 (190 now married, 380 unmarried)
Housing units in zip code 95113 with a mortgage: 156 (7 second mortgage) Median monthly owner costs for units with a mortgage: $3,825 Median monthly owner costs for units without a mortgage: $1,556
Residents with income below the poverty level in 2022:
This zip code:
18.8%
Whole state:
12.2%
Residents with income below 50% of the poverty level in 2022:
This zip code:
11.4%
Whole state:
6.2%
Median number of rooms in houses and condos:
Here:
3.6
State:
6.0
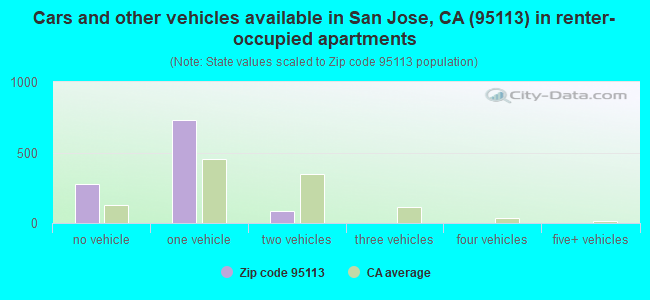
Median number of rooms in apartments:
Here:
2.4
State:
3.9
Notable locations in this zip code not listed on our city pages
Notable locations in zip code 95113: Santa Clara County Courthouse (A), San Jose Museum of Art (B), San Jose Community Theater (C), San Jose Civic Auditorium (D), Peralta Adobe (E), Tech Musuem of Innovation (F). Display/hide their locations on the map
Churches in zip code 95113 include: Apostolic Movement in the Name Church (A), Trinity Episcopal Church (B), Saint Josephs Roman Catholic Church (C), First Church of Christ Scientist (D). Display/hide their locations on the map
In group quarters: 115 (-1 institutionalized population)
Size of family households: 334 2-persons, 49 3-persons, 9 4-persons
Size of nonfamily households: 726 1-person, 162 2-persons, 25 5-persons
57.8% of residents of 95113 zip code speak English at home.
7.3% of residents speak Spanish at home (66% very well, 26% well, 8% not at all).
18.9% of residents speak other Indo-European language at home (89% very well, 9% well, 2% not well).
12.3% of residents speak Asian or Pacific Island language at home (36% very well, 20% well, 19% not well, 24% not at all).
3.6% of residents speak other language at home (66% very well, 22% well, 12% not well).
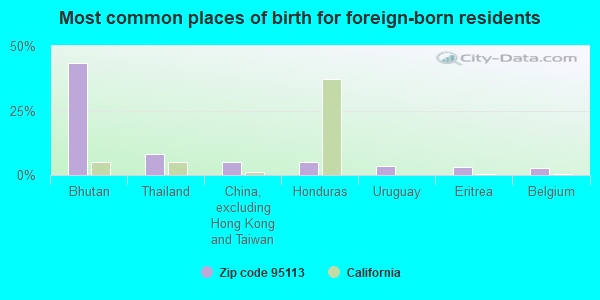
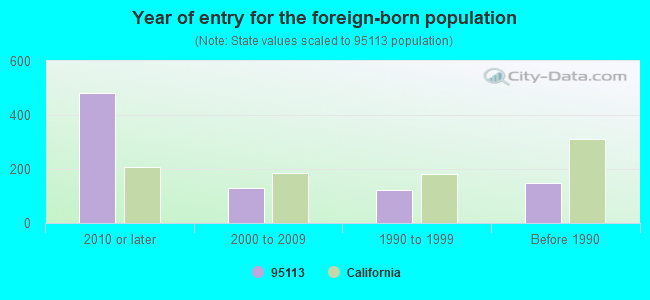
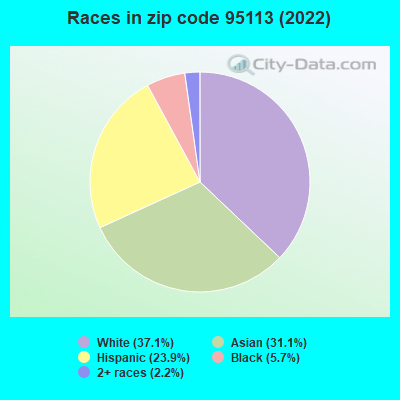
Foreign born population: 770 (36.0%) (39.7% of them are naturalized citizens)
Facilities with environmental interests located in this zip code:
CHEVRON STATION NO 94259 (147 E SANTA CLARA ST in SAN JOSE, CA)
STATE MASTER (California - Hazardous Waste Tracking) - HAZARDOU WASTE PROGRAM Large Quantity Generators, more that 1000 kg of hazardous waste/month (Resource Conservation and Recovery Act (tracking hazardous waste)) Organizations: CHEVRON PRODUCTS CO. (CONTACT/OPERATOR)
FAIRMONT HOTEL (170 SOUTH MARKER STREET in SAN JOSE, CA)
STATE MASTER (California - Hazardous Waste Tracking) - HAZARDOU WASTE PROGRAM CRITERIA AND HAZARDOUS AIR POLLUTANT INVENTORY (Inventory of air pollution sources) Small Quantity Generators, between 100 kg and 1000 kg of hazardous waste/month (Resource Conservation and Recovery Act (tracking hazardous waste)) Business SIC classification: DRYCLEANING PLANTS, EXCEPT RUG CLEANING Alternative names: FAIRMONT HOTEL - SAN JOSE
ABOVENET COMMUNICATIONS INC (150 S FIRST ST in SAN JOSE, CA)
STATE MASTER (California - Hazardous Waste Tracking) - HAZARDOU WASTE PROGRAM Small Quantity Generators, between 100 kg and 1000 kg of hazardous waste/month (Resource Conservation and Recovery Act (tracking hazardous waste)) - notification Organizations: METROMEDIA FIBER NETWORK (CONTACT/OWNER)
ABOVENET COMMUNICATIONS INC (50 W SAN FERNANDO ST in SAN JOSE, CA)
STATE MASTER (California - Hazardous Waste Tracking) - HAZARDOU WASTE PROGRAM Small Quantity Generators, between 100 kg and 1000 kg of hazardous waste/month (Resource Conservation and Recovery Act (tracking hazardous waste)) - notification Organizations: METROMEDIA FIBER NETWORK (CONTACT/OWNER)
ADOBE SYSTEMS INC (345 PARK AVE in SAN JOSE, CA)
STATE MASTER (California - Hazardous Waste Tracking) - HAZARDOU WASTE PROGRAM Small Quantity Generators, between 100 kg and 1000 kg of hazardous waste/month (Resource Conservation and Recovery Act (tracking hazardous waste)) - notification
HOTEL MONTGOMERY (211 S FIRST ST in SAN JOSE, CA)
STATE MASTER (California - Hazardous Waste Tracking) - HAZARDOU WASTE PROGRAM Small Quantity Generators, between 100 kg and 1000 kg of hazardous waste/month (Resource Conservation and Recovery Act (tracking hazardous waste)) - notification Organizations: MONTGOMERY HOTEL GROUP L L C (CONTACT/OWNER)
CENTURY CENTER (51 S THIRD ST in SAN JOSE, CA)
HAZARDOUS WASTE BIENNIAL REPORTER (Resource Conservation and Recovery Act (tracking hazardous waste)) Large Quantity Generators, more that 1000 kg of hazardous waste/month (Resource Conservation and Recovery Act (tracking hazardous waste))
ALL AUTO BODY AND FRAME (560 SOUTH FIRST STREET in SAN JOSE, CA)
Small Quantity Generators, between 100 kg and 1000 kg of hazardous waste/month (Resource Conservation and Recovery Act (tracking hazardous waste)) Organizations: TOM THOMPSON (CONTACT/OWNER)
ADOBE SYSTEMS INC (303 ALMADEN BLVD in SAN JOSE, CA)
Small Quantity Generators, between 100 kg and 1000 kg of hazardous waste/month (Resource Conservation and Recovery Act (tracking hazardous waste)) - notification
MUSEUM OF FINE ART (110 SOUTH MARKET STREET in SAN JOSE, CA)
Small Quantity Generators, between 100 kg and 1000 kg of hazardous waste/month (Resource Conservation and Recovery Act (tracking hazardous waste))
GENUITY INC (55 SO MARKET in SAN JOSE, CA)
CRITERIA AND HAZARDOUS AIR POLLUTANT INVENTORY (Inventory of air pollution sources) Business SIC classification: ELECTRICAL WORK
LEW SMITH (1545 ALMADEN in SAN JOSE, CA)
SUPERFUND (Superfund database)
Housing units lacking complete kitchen facilities: 0.6%
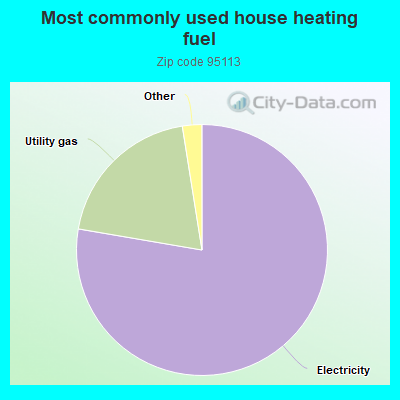
77.7%Electricity
19.8%Utility gas
1.0%No fuel used
0.8%Fuel oil, kerosene, etc.
0.8%Other fuel
Population in 1990: 1,265.
Place of birth for U.S.-born residents:
This state: 712
Northeast: 136
Midwest: 165
South: 231
West: 55
44% of the 95113 zip code residents lived in the same house 5 years ago. Out of people who lived in different houses, 76% lived in this county. Out of people who lived in different counties, 50% lived in California.
70% of the 95113 zip code residents lived in the same house 1 year ago. Out of people who lived in different houses, 52% moved from this county. Out of people who lived in different houses, 12% moved from different county within same state. Out of people who lived in different houses, 28% moved from different state. Out of people who lived in different houses, 5% moved from abroad.
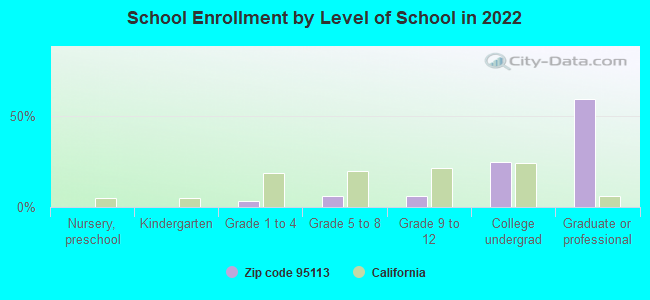
Private vs. public school enrollment:
Students in private schools in grades 1 to 8 (elementary and middle school):
Here:
0.0%
California:
10.5%
Students in private schools in grades 9 to 12 (high school):
Here:
0.0%
California:
8.5%
Students in private undergraduate colleges: 40
Here:
47.7%
California:
15.9%
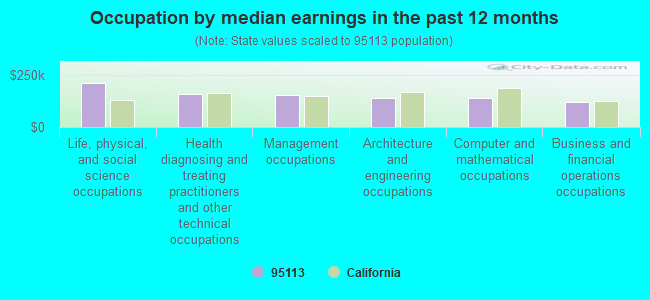
Occupation by median earnings in the past 12 months ($)
213,468Life, physical, and social science occupations
161,444Health diagnosing and treating practitioners and other technical occupations
155,966Management occupations
142,636Architecture and engineering occupations
140,382Computer and mathematical occupations
120,049Business and financial operations occupations
Companies with biggest federal contracts located in this zip code (SAN JOSE, CA):
CALPINE POWERAMERICA, LP (50 W SAN FERNANDO ST # 550)
$25,402,804 with Defense Logistics Agency for Electric Services. Signed on 2004-11-17. Completion date: 2007-01-01.
NEALS JANITORIAL SERVICE (31 NORTH 2ND STREET SUITE; small business) : $18,305,227 in 163 contractsfrom 1999 to 2005
Contracts for Other Housekeeping Services, Custodial Janitorial Services, Landscaping/Groundskeeping Services, Maintenance, Repair or Alteration of Real Property -- Office Buildings, and moreby Air Force, Public Buildings Service, Army, Department of Veterans Affairs, and others Signed by year:2000: $2,913,318; 2001: $2,913,809; 2002: $4,220,018; 2003: $3,483,448; 2004: $1,928,806; 2005: $1,268,471; 2006: $0.
Biggest contracts:
$1,073,475 with Air Force for Other Housekeeping Services. Taking place in CO. Signed on 2001-10-01. Completion date: 2002-09-30.
$1,040,000 with Public Buildings Service for Custodial Janitorial Services. Signed on 2000-08-15. Completion date: 2001-07-15.
$1,039,602 with Army for Custodial Janitorial Services. Taking place in DC. Signed on 2005-02-15. Completion date: 2005-10-31.
$830,126, same as above.Signed on 2004-02-18. Completion date: 2007-10-31.
REALIZATION TECHNOLOGIES, INC (2 N FIRST ST SUITE 406; small business) : $8,451,950 in 39 contractsfrom 2000 to 2006
Contracts for Automated Information System Design and Integration Services, Weapons -- Management and Support (R&D), ADPE System Configuration, ADP Software, and moreby Navy, Air Force, NASA Signed by year:2000: $94,900; 2001: $0; 2002: $685,000; 2003: $2,585,380; 2004: $3,112,540; 2005: $1,731,880; 2006: $242,250.
Biggest contracts:
$916,000 with Navy for Automated Information System Design and Integration Services. Signed on 2003-07-01. Completion date: 2003-09-30.
$774,500 with Air Force for Weapons -- Management and Support (R&D). Taking place in NM. Signed on 2004-09-25. Completion date: 2005-09-26.
$685,000 with Navy for ADPE System Configuration. Signed on 2002-09-27. Completion date: 2003-09-30.
$651,000 with Navy for Automated Information System Design and Integration Services. Taking place in VA. Signed on 2004-03-16. Completion date: 2004-08-10.
TBD NETWORKS, INC (2 N 1ST ST) : $253,952 in 4 contractsfrom 2002 to 2004
$162,072 with Air Force for ADPE System Configuration. Signed on 2002-09-13. Completion date: 2003-10-12.
$37,362 with Air Force for ADP Software. Signed on 2003-12-19. Completion date: 2004-12-18.
$29,610 with Air Force for ADPE System Configuration. Signed on 2003-04-02. Completion date: 2003-05-30.
$24,908 with Air Force for ADP Software. Signed on 2004-12-10. Completion date: 2004-12-19.
SAN JOSE, CITY OF (INC) (50 W SAN FERNANDO ST)
$99,960 with U.S. Army Corps of Engineers - civil program financing only for Other Professional Services. Signed on 2000-02-17. Completion date: 2000-09-30.
HULBERG & ASSOCIATES INC (1 ALMADEN BLVD STE 700; small business) : $72,000 in 5 contractsfrom 2000 to 2006
Contracts for Expert Witness, Real Estate Brokerage Services by Internal Revenue Service, Army Signed by year:2000: $5,000; 2001: $0; 2002: $0; 2003: $0; 2004: $0; 2005: $48,000; 2006: $19,000.
Biggest contracts:
$45,000 with Internal Revenue Service for Expert Witness. Signed on 2000-07-15. Completion date: 2001-06-15.
$29,000 with Army for Real Estate Brokerage Services. Signed on 2005-12-22. Completion date: 2005-12-14.
$19,000, same as above.Signed on 2006-01-11. Completion date: 2005-12-14.
$19,000, same as above.Signed on 2005-08-02. Completion date: 2005-09-30.
INTEGRATED SYSTEMS ENGINEERING (111 N MARKET ST STE 800)
$36,250 with Navy for ADP Software. Signed on 2003-07-23. Completion date: 2004-09-30.
KNIGHT-RIDDER, INC (50 W SAN FERNANDO ST; small business) : $35,993 in 3 contractsfrom 2002 to 2004
$31,000 with Animal and Plant Health Inspection Service (disused code) for Newspapers and Periodicals. Taking place in FL. Signed on 2002-08-15. Completion date: 2002-09-15.
$2,993 with Navy for Newspapers and Periodicals. Signed on 2004-11-18. Completion date: 2005-09-30.
$2,000, same as above.Signed on 2004-02-02. Completion date: 2004-09-30.
U S DISPLAY CONSORTIUM (84 W SANTA CLARA ST STE 79) : $16,400 in 2 contractsfrom 2005 to 2006
$8,200 with Navy for Other Defense -- Applied Research and Exploratory Development (R&D). Signed on 2006-03-23. Completion date: 2007-02-28.
$8,200, same as above.Signed on 2005-04-11. Completion date: 2006-02-28.
GLOBAL NETOPTEX, INC (100 PARK CENTER PLAZA; small business)
$14,160 with Army for Facilities Operations Support Services. Signed on 2006-06-16. Completion date: 2007-03-31.
Top industries in this zip code by the number of employees in 2005:
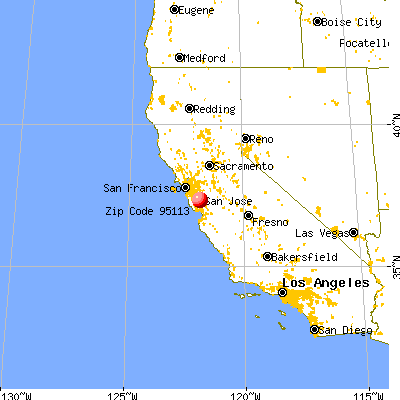


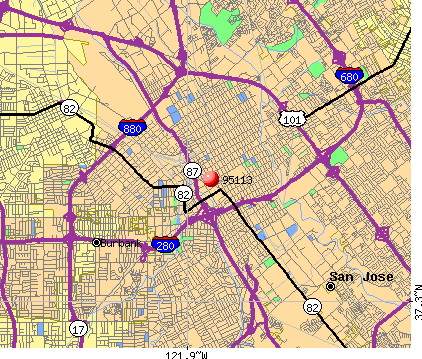 Nearest zip codes: 95112, 95110, 95126, 95125, 95116, 95133.