Estimated zip code population in 2022: 50,017
Zip code population in 2010: 51,496
Zip code population in 2000: 51,688
Houses and condos: 14,148
Renter-occupied apartments: 8,278
% of renters here:
60%State:
44%
March 2022 cost of living index in zip code 95116: 124.4
(high, U.S. average is 100)
Land area: 3.6
sq. mi.
Water area: 0.0
sq. mi.
Population density: 13,928 people per square mile (very high).
OSM Map
General Map
Google Map
MSN Map
OSM Map
General Map
Google Map
MSN Map
OSM Map
General Map
Google Map
MSN Map
OSM Map
General Map
Google Map
MSN Map
Please wait while loading the map...
Real estate property taxes paid for housing units in 2022:
This zip code:
0.7% ($6,204)California:
0.7% ($4,831)
Median real estate property taxes paid for housing units with mortgages in 2022: $7,133 (0.8%)
Median real estate property taxes paid for housing units with no mortgage in 2022: $3,636 (0.5%)
Profiles of local businesses
Business Search - 14 Million verified businesses
Males: 25,551 Females: 24,465
For population 25 years and over in 95116:
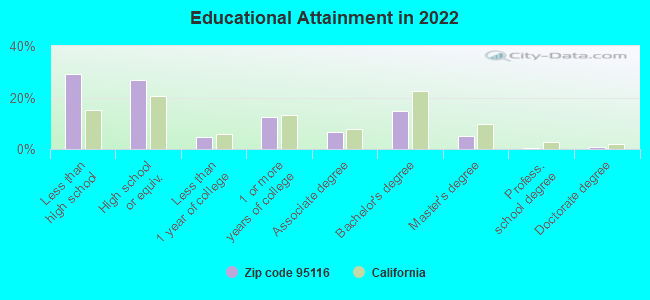
High school or higher: 70.6%Bachelor's degree or higher: 20.8%Graduate or professional degree: 6.2%Unemployed: 4.4%Mean travel time to work (commute): 26.5 minutes
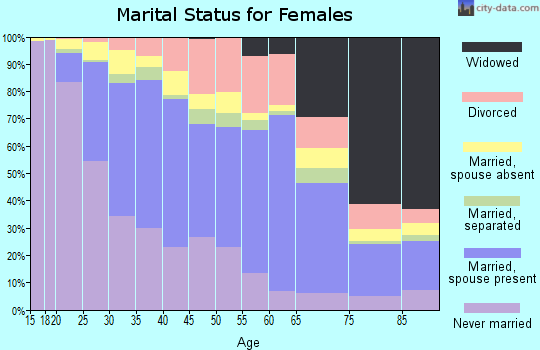
For population 15 years and over in 95116:
Never married: 43.7%Now married: 43.8%Separated: 2.1%Widowed: 4.3%Divorced: 6.1%
Zip code 95116 compared to state average:
Black race population percentage below state average. Foreign-born population percentage above state average. Length of stay since moving in significantly above state average. Percentage of population with a bachelor's degree or higher below state average. 29,741 59.5% Hispanic or Latino 14,055 28.1% Asian 3,898 7.8% White 939 1.9% Black 777 1.6% Two or more races 350 0.7% Native Hawaiian and Other 175 0.3% American Indian 80 0.2% Some other race
Data:
Median household income ($)
Median household income (% change since 2000)
Household income diversity
Ratio of average income to average house value (%)
Ratio of average income to average rent
Median household income ($) - White
Median household income ($) - Black or African American
Median household income ($) - Asian
Median household income ($) - Hispanic or Latino
Median household income ($) - American Indian and Alaska Native
Median household income ($) - Multirace
Median household income ($) - Other Race
Median household income for houses/condos with a mortgage ($)
Median household income for apartments without a mortgage ($)
Races - White alone (%)
Races - White alone (% change since 2000)
Races - Black alone (%)
Races - Black alone (% change since 2000)
Races - American Indian alone (%)
Races - American Indian alone (% change since 2000)
Races - Asian alone (%)
Races - Asian alone (% change since 2000)
Races - Hispanic (%)
Races - Hispanic (% change since 2000)
Races - Native Hawaiian and Other Pacific Islander alone (%)
Races - Native Hawaiian and Other Pacific Islander alone (% change since 2000)
Races - Two or more races (%)
Races - Two or more races (% change since 2000)
Races - Other race alone (%)
Races - Other race alone (% change since 2000)
Racial diversity
Unemployment (%)
Unemployment (% change since 2000)
Unemployment (%) - White
Unemployment (%) - Black or African American
Unemployment (%) - Asian
Unemployment (%) - Hispanic or Latino
Unemployment (%) - American Indian and Alaska Native
Unemployment (%) - Multirace
Unemployment (%) - Other Race
Population density (people per square mile)
Population - Males (%)
Population - Females (%)
Population - Males (%) - White
Population - Males (%) - Black or African American
Population - Males (%) - Asian
Population - Males (%) - Hispanic or Latino
Population - Males (%) - American Indian and Alaska Native
Population - Males (%) - Multirace
Population - Males (%) - Other Race
Population - Females (%) - White
Population - Females (%) - Black or African American
Population - Females (%) - Asian
Population - Females (%) - Hispanic or Latino
Population - Females (%) - American Indian and Alaska Native
Population - Females (%) - Multirace
Population - Females (%) - Other Race
Coronavirus confirmed cases (Apr 27, 2024)
Deaths caused by coronavirus (Apr 27, 2024)
Coronavirus confirmed cases (per 100k population) (Apr 27, 2024)
Deaths caused by coronavirus (per 100k population) (Apr 27, 2024)
Daily increase in number of cases (Apr 27, 2024)
Weekly increase in number of cases (Apr 27, 2024)
Cases doubled (in days) (Apr 27, 2024)
Hospitalized patients (Apr 18, 2022)
Negative test results (Apr 18, 2022)
Total test results (Apr 18, 2022)
COVID Vaccine doses distributed (per 100k population) (Sep 19, 2023)
COVID Vaccine doses administered (per 100k population) (Sep 19, 2023)
COVID Vaccine doses distributed (Sep 19, 2023)
COVID Vaccine doses administered (Sep 19, 2023)
Likely homosexual households (%)
Likely homosexual households (% change since 2000)
Likely homosexual households - Lesbian couples (%)
Likely homosexual households - Lesbian couples (% change since 2000)
Likely homosexual households - Gay men (%)
Likely homosexual households - Gay men (% change since 2000)
Cost of living index
Median gross rent ($)
Median contract rent ($)
Median monthly housing costs ($)
Median house or condo value ($)
Median house or condo value ($ change since 2000)
Mean house or condo value by units in structure - 1, detached ($)
Mean house or condo value by units in structure - 1, attached ($)
Mean house or condo value by units in structure - 2 ($)
Mean house or condo value by units in structure by units in structure - 3 or 4 ($)
Mean house or condo value by units in structure - 5 or more ($)
Mean house or condo value by units in structure - Boat, RV, van, etc. ($)
Mean house or condo value by units in structure - Mobile home ($)
Median house or condo value ($) - White
Median house or condo value ($) - Black or African American
Median house or condo value ($) - Asian
Median house or condo value ($) - Hispanic or Latino
Median house or condo value ($) - American Indian and Alaska Native
Median house or condo value ($) - Multirace
Median house or condo value ($) - Other Race
Median resident age
Resident age diversity
Median resident age - Males
Median resident age - Females
Median resident age - White
Median resident age - Black or African American
Median resident age - Asian
Median resident age - Hispanic or Latino
Median resident age - American Indian and Alaska Native
Median resident age - Multirace
Median resident age - Other Race
Median resident age - Males - White
Median resident age - Males - Black or African American
Median resident age - Males - Asian
Median resident age - Males - Hispanic or Latino
Median resident age - Males - American Indian and Alaska Native
Median resident age - Males - Multirace
Median resident age - Males - Other Race
Median resident age - Females - White
Median resident age - Females - Black or African American
Median resident age - Females - Asian
Median resident age - Females - Hispanic or Latino
Median resident age - Females - American Indian and Alaska Native
Median resident age - Females - Multirace
Median resident age - Females - Other Race
Commute - mean travel time to work (minutes)
Travel time to work - Less than 5 minutes (%)
Travel time to work - Less than 5 minutes (% change since 2000)
Travel time to work - 5 to 9 minutes (%)
Travel time to work - 5 to 9 minutes (% change since 2000)
Travel time to work - 10 to 19 minutes (%)
Travel time to work - 10 to 19 minutes (% change since 2000)
Travel time to work - 20 to 29 minutes (%)
Travel time to work - 20 to 29 minutes (% change since 2000)
Travel time to work - 30 to 39 minutes (%)
Travel time to work - 30 to 39 minutes (% change since 2000)
Travel time to work - 40 to 59 minutes (%)
Travel time to work - 40 to 59 minutes (% change since 2000)
Travel time to work - 60 to 89 minutes (%)
Travel time to work - 60 to 89 minutes (% change since 2000)
Travel time to work - 90 or more minutes (%)
Travel time to work - 90 or more minutes (% change since 2000)
Marital status - Never married (%)
Marital status - Now married (%)
Marital status - Separated (%)
Marital status - Widowed (%)
Marital status - Divorced (%)
Median family income ($)
Median family income (% change since 2000)
Median non-family income ($)
Median non-family income (% change since 2000)
Median per capita income ($)
Median per capita income (% change since 2000)
Median family income ($) - White
Median family income ($) - Black or African American
Median family income ($) - Asian
Median family income ($) - Hispanic or Latino
Median family income ($) - American Indian and Alaska Native
Median family income ($) - Multirace
Median family income ($) - Other Race
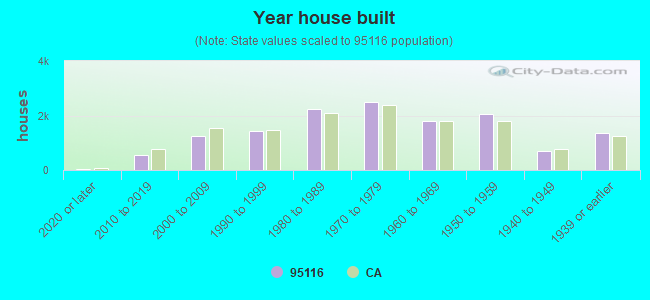
Median year house/condo built
Median year apartment built
Year house built - Built 2005 or later (%)
Year house built - Built 2000 to 2004 (%)
Year house built - Built 1990 to 1999 (%)
Year house built - Built 1980 to 1989 (%)
Year house built - Built 1970 to 1979 (%)
Year house built - Built 1960 to 1969 (%)
Year house built - Built 1950 to 1959 (%)
Year house built - Built 1940 to 1949 (%)
Year house built - Built 1939 or earlier (%)
Average household size
Household density (households per square mile)
Average household size - White
Average household size - Black or African American
Average household size - Asian
Average household size - Hispanic or Latino
Average household size - American Indian and Alaska Native
Average household size - Multirace
Average household size - Other Race
Occupied housing units (%)
Vacant housing units (%)
Owner occupied housing units (%)
Renter occupied housing units (%)
Vacancy status - For rent (%)
Vacancy status - For sale only (%)
Vacancy status - Rented or sold, not occupied (%)
Vacancy status - For seasonal, recreational, or occasional use (%)
Vacancy status - For migrant workers (%)
Vacancy status - Other vacant (%)
Residents with income below the poverty level (%)
Residents with income below 50% of the poverty level (%)
Children below poverty level (%)
Poor families by family type - Married-couple family (%)
Poor families by family type - Male, no wife present (%)
Poor families by family type - Female, no husband present (%)
Poverty status for native-born residents (%)
Poverty status for foreign-born residents (%)
Poverty among high school graduates not in families (%)
Poverty among people who did not graduate high school not in families (%)
Residents with income below the poverty level (%) - White
Residents with income below the poverty level (%) - Black or African American
Residents with income below the poverty level (%) - Asian
Residents with income below the poverty level (%) - Hispanic or Latino
Residents with income below the poverty level (%) - American Indian and Alaska Native
Residents with income below the poverty level (%) - Multirace
Residents with income below the poverty level (%) - Other Race
Air pollution - Air Quality Index (AQI)
Air pollution - CO
Air pollution - NO2
Air pollution - SO2
Air pollution - Ozone
Air pollution - PM10
Air pollution - PM25
Air pollution - Pb
Crime - Murders per 100,000 population
Crime - Rapes per 100,000 population
Crime - Robberies per 100,000 population
Crime - Assaults per 100,000 population
Crime - Burglaries per 100,000 population
Crime - Thefts per 100,000 population
Crime - Auto thefts per 100,000 population
Crime - Arson per 100,000 population
Crime - City-data.com crime index
Crime - Violent crime index
Crime - Property crime index
Crime - Murders per 100,000 population (5 year average)
Crime - Rapes per 100,000 population (5 year average)
Crime - Robberies per 100,000 population (5 year average)
Crime - Assaults per 100,000 population (5 year average)
Crime - Burglaries per 100,000 population (5 year average)
Crime - Thefts per 100,000 population (5 year average)
Crime - Auto thefts per 100,000 population (5 year average)
Crime - Arson per 100,000 population (5 year average)
Crime - City-data.com crime index (5 year average)
Crime - Violent crime index (5 year average)
Crime - Property crime index (5 year average)
1996 Presidential Elections Results (%) - Democratic Party (Clinton)
1996 Presidential Elections Results (%) - Republican Party (Dole)
1996 Presidential Elections Results (%) - Other
2000 Presidential Elections Results (%) - Democratic Party (Gore)
2000 Presidential Elections Results (%) - Republican Party (Bush)
2000 Presidential Elections Results (%) - Other
2004 Presidential Elections Results (%) - Democratic Party (Kerry)
2004 Presidential Elections Results (%) - Republican Party (Bush)
2004 Presidential Elections Results (%) - Other
2008 Presidential Elections Results (%) - Democratic Party (Obama)
2008 Presidential Elections Results (%) - Republican Party (McCain)
2008 Presidential Elections Results (%) - Other
2012 Presidential Elections Results (%) - Democratic Party (Obama)
2012 Presidential Elections Results (%) - Republican Party (Romney)
2012 Presidential Elections Results (%) - Other
2016 Presidential Elections Results (%) - Democratic Party (Clinton)
2016 Presidential Elections Results (%) - Republican Party (Trump)
2016 Presidential Elections Results (%) - Other
2020 Presidential Elections Results (%) - Democratic Party (Biden)
2020 Presidential Elections Results (%) - Republican Party (Trump)
2020 Presidential Elections Results (%) - Other
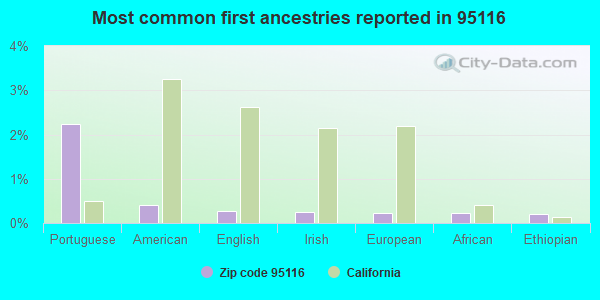
Ancestries Reported - Arab (%)
Ancestries Reported - Czech (%)
Ancestries Reported - Danish (%)
Ancestries Reported - Dutch (%)
Ancestries Reported - English (%)
Ancestries Reported - French (%)
Ancestries Reported - French Canadian (%)
Ancestries Reported - German (%)
Ancestries Reported - Greek (%)
Ancestries Reported - Hungarian (%)
Ancestries Reported - Irish (%)
Ancestries Reported - Italian (%)
Ancestries Reported - Lithuanian (%)
Ancestries Reported - Norwegian (%)
Ancestries Reported - Polish (%)
Ancestries Reported - Portuguese (%)
Ancestries Reported - Russian (%)
Ancestries Reported - Scotch-Irish (%)
Ancestries Reported - Scottish (%)
Ancestries Reported - Slovak (%)
Ancestries Reported - Subsaharan African (%)
Ancestries Reported - Swedish (%)
Ancestries Reported - Swiss (%)
Ancestries Reported - Ukrainian (%)
Ancestries Reported - United States (%)
Ancestries Reported - Welsh (%)
Ancestries Reported - West Indian (%)
Ancestries Reported - Other (%)
Educational Attainment - No schooling completed (%)
Educational Attainment - Less than high school (%)
Educational Attainment - High school or equivalent (%)
Educational Attainment - Less than 1 year of college (%)
Educational Attainment - 1 or more years of college (%)
Educational Attainment - Associate degree (%)
Educational Attainment - Bachelor's degree (%)
Educational Attainment - Master's degree (%)
Educational Attainment - Professional school degree (%)
Educational Attainment - Doctorate degree (%)
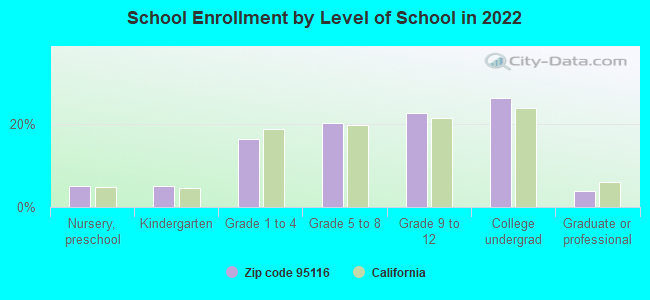
School Enrollment - Nursery, preschool (%)
School Enrollment - Kindergarten (%)
School Enrollment - Grade 1 to 4 (%)
School Enrollment - Grade 5 to 8 (%)
School Enrollment - Grade 9 to 12 (%)
School Enrollment - College undergrad (%)
School Enrollment - Graduate or professional (%)
School Enrollment - Not enrolled in school (%)
School enrollment - Public schools (%)
School enrollment - Private schools (%)
School enrollment - Not enrolled (%)
Median number of rooms in houses and condos
Median number of rooms in apartments
Housing units lacking complete plumbing facilities (%)
Housing units lacking complete kitchen facilities (%)
Density of houses
Urban houses (%)
Rural houses (%)
Households with people 60 years and over (%)
Households with people 65 years and over (%)
Households with people 75 years and over (%)
Households with one or more nonrelatives (%)
Households with no nonrelatives (%)
Population in households (%)
Family households (%)
Nonfamily households (%)
Population in families (%)
Family households with own children (%)
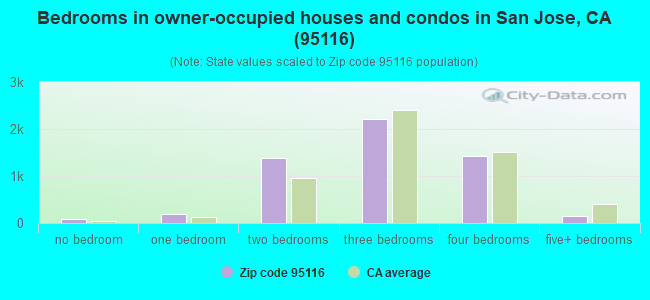
Median number of bedrooms in owner occupied houses
Mean number of bedrooms in owner occupied houses
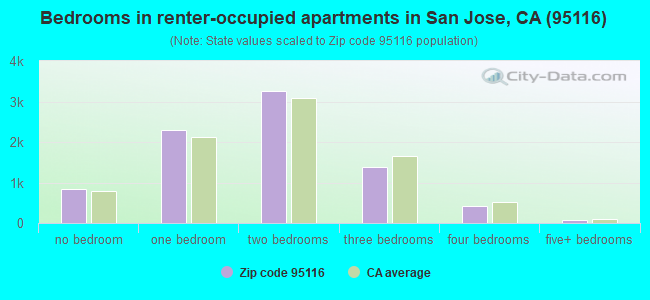
Median number of bedrooms in renter occupied houses
Mean number of bedrooms in renter occupied houses
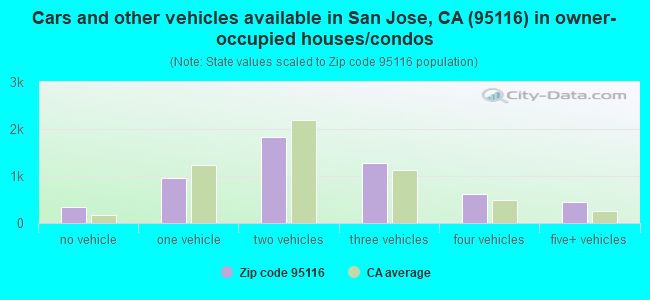
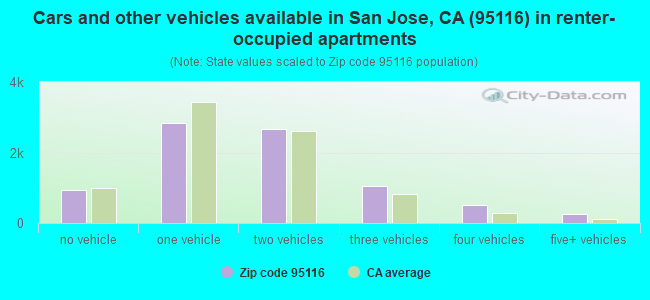
Median number of vehichles in owner occupied houses
Mean number of vehichles in owner occupied houses
Median number of vehichles in renter occupied houses
Mean number of vehichles in renter occupied houses
Mortgage status - with mortgage (%)
Mortgage status - with second mortgage (%)
Mortgage status - with home equity loan (%)
Mortgage status - with both second mortgage and home equity loan (%)
Mortgage status - without a mortgage (%)
Average family size
Average family size - White
Average family size - Black or African American
Average family size - Asian
Average family size - Hispanic or Latino
Average family size - American Indian and Alaska Native
Average family size - Multirace
Average family size - Other Race
Geographical mobility - Same house 1 year ago (%)
Geographical mobility - Moved within same county (%)
Geographical mobility - Moved from different county within same state (%)
Geographical mobility - Moved from different state (%)
Geographical mobility - Moved from abroad (%)
Place of birth - Born in state of residence (%)
Place of birth - Born in other state (%)
Place of birth - Native, outside of US (%)
Place of birth - Foreign born (%)
Housing units in structures - 1, detached (%)
Housing units in structures - 1, attached (%)
Housing units in structures - 2 (%)
Housing units in structures - 3 or 4 (%)
Housing units in structures - 5 to 9 (%)
Housing units in structures - 10 to 19 (%)
Housing units in structures - 20 to 49 (%)
Housing units in structures - 50 or more (%)
Housing units in structures - Mobile home (%)
Housing units in structures - Boat, RV, van, etc. (%)
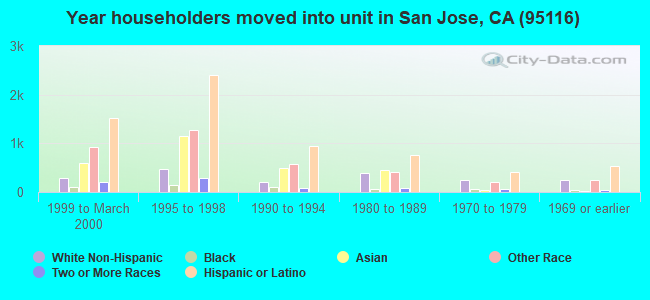
House/condo owner moved in on average (years ago)
Renter moved in on average (years ago)
Year householder moved into unit - Moved in 1999 to March 2000 (%)
Year householder moved into unit - Moved in 1995 to 1998 (%)
Year householder moved into unit - Moved in 1990 to 1994 (%)
Year householder moved into unit - Moved in 1980 to 1989 (%)
Year householder moved into unit - Moved in 1970 to 1979 (%)
Year householder moved into unit - Moved in 1969 or earlier (%)
Means of transportation to work - Drove car alone (%)
Means of transportation to work - Carpooled (%)
Means of transportation to work - Public transportation (%)
Means of transportation to work - Bus or trolley bus (%)
Means of transportation to work - Streetcar or trolley car (%)
Means of transportation to work - Subway or elevated (%)
Means of transportation to work - Railroad (%)
Means of transportation to work - Ferryboat (%)
Means of transportation to work - Taxicab (%)
Means of transportation to work - Motorcycle (%)
Means of transportation to work - Bicycle (%)
Means of transportation to work - Walked (%)
Means of transportation to work - Other means (%)
Working at home (%)
Industry diversity
Most Common Industries - Agriculture, forestry, fishing and hunting, and mining (%)
Most Common Industries - Agriculture, forestry, fishing and hunting (%)
Most Common Industries - Mining, quarrying, and oil and gas extraction (%)
Most Common Industries - Construction (%)
Most Common Industries - Manufacturing (%)
Most Common Industries - Wholesale trade (%)
Most Common Industries - Retail trade (%)
Most Common Industries - Transportation and warehousing, and utilities (%)
Most Common Industries - Transportation and warehousing (%)
Most Common Industries - Utilities (%)
Most Common Industries - Information (%)
Most Common Industries - Finance and insurance, and real estate and rental and leasing (%)
Most Common Industries - Finance and insurance (%)
Most Common Industries - Real estate and rental and leasing (%)
Most Common Industries - Professional, scientific, and management, and administrative and waste management services (%)
Most Common Industries - Professional, scientific, and technical services (%)
Most Common Industries - Management of companies and enterprises (%)
Most Common Industries - Administrative and support and waste management services (%)
Most Common Industries - Educational services, and health care and social assistance (%)
Most Common Industries - Educational services (%)
Most Common Industries - Health care and social assistance (%)
Most Common Industries - Arts, entertainment, and recreation, and accommodation and food services (%)
Most Common Industries - Arts, entertainment, and recreation (%)
Most Common Industries - Accommodation and food services (%)
Most Common Industries - Other services, except public administration (%)
Most Common Industries - Public administration (%)
Occupation diversity
Most Common Occupations - Management, business, science, and arts occupations (%)
Most Common Occupations - Management, business, and financial occupations (%)
Most Common Occupations - Management occupations (%)
Most Common Occupations - Business and financial operations occupations (%)
Most Common Occupations - Computer, engineering, and science occupations (%)
Most Common Occupations - Computer and mathematical occupations (%)
Most Common Occupations - Architecture and engineering occupations (%)
Most Common Occupations - Life, physical, and social science occupations (%)
Most Common Occupations - Education, legal, community service, arts, and media occupations (%)
Most Common Occupations - Community and social service occupations (%)
Most Common Occupations - Legal occupations (%)
Most Common Occupations - Education, training, and library occupations (%)
Most Common Occupations - Arts, design, entertainment, sports, and media occupations (%)
Most Common Occupations - Healthcare practitioners and technical occupations (%)
Most Common Occupations - Health diagnosing and treating practitioners and other technical occupations (%)
Most Common Occupations - Health technologists and technicians (%)
Most Common Occupations - Service occupations (%)
Most Common Occupations - Healthcare support occupations (%)
Most Common Occupations - Protective service occupations (%)
Most Common Occupations - Fire fighting and prevention, and other protective service workers including supervisors (%)
Most Common Occupations - Law enforcement workers including supervisors (%)
Most Common Occupations - Food preparation and serving related occupations (%)
Most Common Occupations - Building and grounds cleaning and maintenance occupations (%)
Most Common Occupations - Personal care and service occupations (%)
Most Common Occupations - Sales and office occupations (%)
Most Common Occupations - Sales and related occupations (%)
Most Common Occupations - Office and administrative support occupations (%)
Most Common Occupations - Natural resources, construction, and maintenance occupations (%)
Most Common Occupations - Farming, fishing, and forestry occupations (%)
Most Common Occupations - Construction and extraction occupations (%)
Most Common Occupations - Installation, maintenance, and repair occupations (%)
Most Common Occupations - Production, transportation, and material moving occupations (%)
Most Common Occupations - Production occupations (%)
Most Common Occupations - Transportation occupations (%)
Most Common Occupations - Material moving occupations (%)
People in Group quarters - Institutionalized population (%)
People in Group quarters - Correctional institutions (%)
People in Group quarters - Federal prisons and detention centers (%)
People in Group quarters - Halfway houses (%)
People in Group quarters - Local jails and other confinement facilities (including police lockups) (%)
People in Group quarters - Military disciplinary barracks (%)
People in Group quarters - State prisons (%)
People in Group quarters - Other types of correctional institutions (%)
People in Group quarters - Nursing homes (%)
People in Group quarters - Hospitals/wards, hospices, and schools for the handicapped (%)
People in Group quarters - Hospitals/wards and hospices for chronically ill (%)
People in Group quarters - Hospices or homes for chronically ill (%)
People in Group quarters - Military hospitals or wards for chronically ill (%)
People in Group quarters - Other hospitals or wards for chronically ill (%)
People in Group quarters - Hospitals or wards for drug/alcohol abuse (%)
People in Group quarters - Mental (Psychiatric) hospitals or wards (%)
People in Group quarters - Schools, hospitals, or wards for the mentally retarded (%)
People in Group quarters - Schools, hospitals, or wards for the physically handicapped (%)
People in Group quarters - Institutions for the deaf (%)
People in Group quarters - Institutions for the blind (%)
People in Group quarters - Orthopedic wards and institutions for the physically handicapped (%)
People in Group quarters - Wards in general hospitals for patients who have no usual home elsewhere (%)
People in Group quarters - Wards in military hospitals for patients who have no usual home elsewhere (%)
People in Group quarters - Juvenile institutions (%)
People in Group quarters - Long-term care (%)
People in Group quarters - Homes for abused, dependent, and neglected children (%)
People in Group quarters - Residential treatment centers for emotionally disturbed children (%)
People in Group quarters - Training schools for juvenile delinquents (%)
People in Group quarters - Short-term care, detention or diagnostic centers for delinquent children (%)
People in Group quarters - Type of juvenile institution unknown (%)
People in Group quarters - Noninstitutionalized population (%)
People in Group quarters - College dormitories (includes college quarters off campus) (%)
People in Group quarters - Military quarters (%)
People in Group quarters - On base (%)
People in Group quarters - Barracks, unaccompanied personnel housing (UPH), (Enlisted/Officer), ;and similar group living quarters for military personnel (%)
People in Group quarters - Transient quarters for temporary residents (%)
People in Group quarters - Military ships (%)
People in Group quarters - Group homes (%)
People in Group quarters - Homes or halfway houses for drug/alcohol abuse (%)
People in Group quarters - Homes for the mentally ill (%)
People in Group quarters - Homes for the mentally retarded (%)
People in Group quarters - Homes for the physically handicapped (%)
People in Group quarters - Other group homes (%)
People in Group quarters - Religious group quarters (%)
People in Group quarters - Dormitories (%)
People in Group quarters - Agriculture workers' dormitories on farms (%)
People in Group quarters - Job Corps and vocational training facilities (%)
People in Group quarters - Other workers' dormitories (%)
People in Group quarters - Crews of maritime vessels (%)
People in Group quarters - Other nonhousehold living situations (%)
People in Group quarters - Other noninstitutional group quarters (%)
Residents speaking English at home (%)
Residents speaking English at home - Born in the United States (%)
Residents speaking English at home - Native, born elsewhere (%)
Residents speaking English at home - Foreign born (%)
Residents speaking Spanish at home (%)
Residents speaking Spanish at home - Born in the United States (%)
Residents speaking Spanish at home - Native, born elsewhere (%)
Residents speaking Spanish at home - Foreign born (%)
Residents speaking other language at home (%)
Residents speaking other language at home - Born in the United States (%)
Residents speaking other language at home - Native, born elsewhere (%)
Residents speaking other language at home - Foreign born (%)
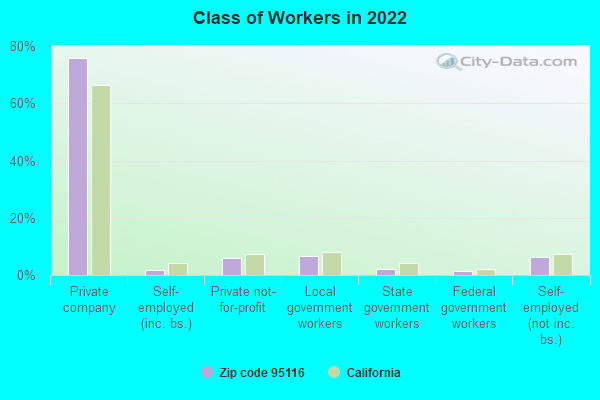
Class of Workers - Employee of private company (%)
Class of Workers - Self-employed in own incorporated business (%)
Class of Workers - Private not-for-profit wage and salary workers (%)
Class of Workers - Local government workers (%)
Class of Workers - State government workers (%)
Class of Workers - Federal government workers (%)
Class of Workers - Self-employed workers in own not incorporated business and Unpaid family workers (%)
House heating fuel used in houses and condos - Utility gas (%)
House heating fuel used in houses and condos - Bottled, tank, or LP gas (%)
House heating fuel used in houses and condos - Electricity (%)
House heating fuel used in houses and condos - Fuel oil, kerosene, etc. (%)
House heating fuel used in houses and condos - Coal or coke (%)
House heating fuel used in houses and condos - Wood (%)
House heating fuel used in houses and condos - Solar energy (%)
House heating fuel used in houses and condos - Other fuel (%)
House heating fuel used in houses and condos - No fuel used (%)
House heating fuel used in apartments - Utility gas (%)
House heating fuel used in apartments - Bottled, tank, or LP gas (%)
House heating fuel used in apartments - Electricity (%)
House heating fuel used in apartments - Fuel oil, kerosene, etc. (%)
House heating fuel used in apartments - Coal or coke (%)
House heating fuel used in apartments - Wood (%)
House heating fuel used in apartments - Solar energy (%)
House heating fuel used in apartments - Other fuel (%)
House heating fuel used in apartments - No fuel used (%)
Armed forces status - In Armed Forces (%)
Armed forces status - Civilian (%)
Armed forces status - Civilian - Veteran (%)
Armed forces status - Civilian - Nonveteran (%)
Fatal accidents locations in years 2005-2021
Fatal accidents locations in 2005
Fatal accidents locations in 2006
Fatal accidents locations in 2007
Fatal accidents locations in 2008
Fatal accidents locations in 2009
Fatal accidents locations in 2010
Fatal accidents locations in 2011
Fatal accidents locations in 2012
Fatal accidents locations in 2013
Fatal accidents locations in 2014
Fatal accidents locations in 2015
Fatal accidents locations in 2016
Fatal accidents locations in 2017
Fatal accidents locations in 2018
Fatal accidents locations in 2019
Fatal accidents locations in 2020
Fatal accidents locations in 2021
Alcohol use - People drinking some alcohol every month (%)
Alcohol use - People not drinking at all (%)
Alcohol use - Average days/month drinking alcohol
Alcohol use - Average drinks/week
Alcohol use - Average days/year people drink much
Audiometry - Average condition of hearing (%)
Audiometry - People that can hear a whisper from across a quiet room (%)
Audiometry - People that can hear normal voice from across a quiet room (%)
Audiometry - Ears ringing, roaring, buzzing (%)
Audiometry - Had a job exposure to loud noise (%)
Audiometry - Had off-work exposure to loud noise (%)
Blood Pressure & Cholesterol - Has high blood pressure (%)
Blood Pressure & Cholesterol - Checking blood pressure at home (%)
Blood Pressure & Cholesterol - Frequently checking blood cholesterol (%)
Blood Pressure & Cholesterol - Has high cholesterol level (%)
Consumer Behavior - Money monthly spent on food at supermarket/grocery store
Consumer Behavior - Money monthly spent on food at other stores
Consumer Behavior - Money monthly spent on eating out
Consumer Behavior - Money monthly spent on carryout/delivered foods
Consumer Behavior - Income spent on food at supermarket/grocery store (%)
Consumer Behavior - Income spent on food at other stores (%)
Consumer Behavior - Income spent on eating out (%)
Consumer Behavior - Income spent on carryout/delivered foods (%)
Current Health Status - General health condition (%)
Current Health Status - Blood donors (%)
Current Health Status - Has blood ever tested for HIV virus (%)
Current Health Status - Left-handed people (%)
Dermatology - People using sunscreen (%)
Diabetes - Diabetics (%)
Diabetes - Had a blood test for high blood sugar (%)
Diabetes - People taking insulin (%)
Diet Behavior & Nutrition - Diet health (%)
Diet Behavior & Nutrition - Milk product consumption (# of products/month)
Diet Behavior & Nutrition - Meals not home prepared (#/week)
Diet Behavior & Nutrition - Meals from fast food or pizza place (#/week)
Diet Behavior & Nutrition - Ready-to-eat foods (#/month)
Diet Behavior & Nutrition - Frozen meals/pizza (#/month)
Drug Use - People that ever used marijuana or hashish (%)
Drug Use - Ever used hard drugs (%)
Drug Use - Ever used any form of cocaine (%)
Drug Use - Ever used heroin (%)
Drug Use - Ever used methamphetamine (%)
Health Insurance - People covered by health insurance (%)
Kidney Conditions-Urology - Avg. # of times urinating at night
Medical Conditions - People with asthma (%)
Medical Conditions - People with anemia (%)
Medical Conditions - People with psoriasis (%)
Medical Conditions - People with overweight (%)
Medical Conditions - Elderly people having difficulties in thinking or remembering (%)
Medical Conditions - People who ever received blood transfusion (%)
Medical Conditions - People having trouble seeing even with glass/contacts (%)
Medical Conditions - People with arthritis (%)
Medical Conditions - People with gout (%)
Medical Conditions - People with congestive heart failure (%)
Medical Conditions - People with coronary heart disease (%)
Medical Conditions - People with angina pectoris (%)
Medical Conditions - People who ever had heart attack (%)
Medical Conditions - People who ever had stroke (%)
Medical Conditions - People with emphysema (%)
Medical Conditions - People with thyroid problem (%)
Medical Conditions - People with chronic bronchitis (%)
Medical Conditions - People with any liver condition (%)
Medical Conditions - People who ever had cancer or malignancy (%)
Mental Health - People who have little interest in doing things (%)
Mental Health - People feeling down, depressed, or hopeless (%)
Mental Health - People who have trouble sleeping or sleeping too much (%)
Mental Health - People feeling tired or having little energy (%)
Mental Health - People with poor appetite or overeating (%)
Mental Health - People feeling bad about themself (%)
Mental Health - People who have trouble concentrating on things (%)
Mental Health - People moving or speaking slowly or too fast (%)
Mental Health - People having thoughts they would be better off dead (%)
Oral Health - Average years since last visit a dentist
Oral Health - People embarrassed because of mouth (%)
Oral Health - People with gum disease (%)
Oral Health - General health of teeth and gums (%)
Oral Health - Average days a week using dental floss/device
Oral Health - Average days a week using mouthwash for dental problem
Oral Health - Average number of teeth
Pesticide Use - Households using pesticides to control insects (%)
Pesticide Use - Households using pesticides to kill weeds (%)
Physical Activity - People doing vigorous-intensity work activities (%)
Physical Activity - People doing moderate-intensity work activities (%)
Physical Activity - People walking or bicycling (%)
Physical Activity - People doing vigorous-intensity recreational activities (%)
Physical Activity - People doing moderate-intensity recreational activities (%)
Physical Activity - Average hours a day doing sedentary activities
Physical Activity - Average hours a day watching TV or videos
Physical Activity - Average hours a day using computer
Physical Functioning - People having limitations keeping them from working (%)
Physical Functioning - People limited in amount of work they can do (%)
Physical Functioning - People that need special equipment to walk (%)
Physical Functioning - People experiencing confusion/memory problems (%)
Physical Functioning - People requiring special healthcare equipment (%)
Prescription Medications - Average number of prescription medicines taking
Preventive Aspirin Use - Adults 40+ taking low-dose aspirin (%)
Reproductive Health - Vaginal deliveries (%)
Reproductive Health - Cesarean deliveries (%)
Reproductive Health - Deliveries resulted in a live birth (%)
Reproductive Health - Pregnancies resulted in a delivery (%)
Reproductive Health - Women breastfeeding newborns (%)
Reproductive Health - Women that had a hysterectomy (%)
Reproductive Health - Women that had both ovaries removed (%)
Reproductive Health - Women that have ever taken birth control pills (%)
Reproductive Health - Women taking birth control pills (%)
Reproductive Health - Women that have ever used Depo-Provera or injectables (%)
Reproductive Health - Women that have ever used female hormones (%)
Sexual Behavior - People 18+ that ever had sex (vaginal, anal, or oral) (%)
Sexual Behavior - Males 18+ that ever had vaginal sex with a woman (%)
Sexual Behavior - Males 18+ that ever performed oral sex on a woman (%)
Sexual Behavior - Males 18+ that ever had anal sex with a woman (%)
Sexual Behavior - Males 18+ that ever had any sex with a man (%)
Sexual Behavior - Females 18+ that ever had vaginal sex with a man (%)
Sexual Behavior - Females 18+ that ever performed oral sex on a man (%)
Sexual Behavior - Females 18+ that ever had anal sex with a man (%)
Sexual Behavior - Females 18+ that ever had any kind of sex with a woman (%)
Sexual Behavior - Average age people first had sex
Sexual Behavior - Average number of female sex partners in lifetime (males 18+)
Sexual Behavior - Average number of female vaginal sex partners in lifetime (males 18+)
Sexual Behavior - Average age people first performed oral sex on a woman (18+)
Sexual Behavior - Average number of woman performed oral sex on in lifetime (18+)
Sexual Behavior - Average number of male sex partners in lifetime (males 18+)
Sexual Behavior - Average number of male anal sex partners in lifetime (males 18+)
Sexual Behavior - Average age people first performed oral sex on a man (18+)
Sexual Behavior - Average number of male oral sex partners in lifetime (18+)
Sexual Behavior - People using protection when performing oral sex (%)
Sexual Behavior - Average number of times people have vaginal or anal sex a year
Sexual Behavior - People having sex without condom (%)
Sexual Behavior - Average number of male sex partners in lifetime (females 18+)
Sexual Behavior - Average number of male vaginal sex partners in lifetime (females 18+)
Sexual Behavior - Average number of female sex partners in lifetime (females 18+)
Sexual Behavior - Circumcised males 18+ (%)
Sleep Disorders - Average hours sleeping at night
Sleep Disorders - People that has trouble sleeping (%)
Smoking-Cigarette Use - People smoking cigarettes (%)
Taste & Smell - People 40+ having problems with smell (%)
Taste & Smell - People 40+ having problems with taste (%)
Taste & Smell - People 40+ that ever had wisdom teeth removed (%)
Taste & Smell - People 40+ that ever had tonsils teeth removed (%)
Taste & Smell - People 40+ that ever had a loss of consciousness because of a head injury (%)
Taste & Smell - People 40+ that ever had a broken nose or other serious injury to face or skull (%)
Taste & Smell - People 40+ that ever had two or more sinus infections (%)
Weight - Average height (inches)
Weight - Average weight (pounds)
Weight - Average BMI
Weight - People that are obese (%)
Weight - People that ever were obese (%)
Weight - People trying to lose weight (%)
100%
urban population.
Estimated median house/condo value in 2022: $898,974
95116:
$898,974California:
$715,900
Median resident age: This zip code:
35.7 yearsCalifornia median age:
37.9 years
Average household size: This zip code:
3.6 peopleCalifornia:
2.8 people
Averages for the 2020 tax year for zip code 95116, filed in 2021:
Average Adjusted Gross Income (AGI) in 2020: $54,703 (Individual Income Tax Returns) Here:
$54,703State:
$95,910
Salary/wage: $52,318 (reported on 88.5% of returns )Here:
$52,318State:
$77,331
(% of AGI for various income ranges: 1362.9% for AGIs below $25k , 4529.8% for AGIs $25k-50k , 7894.5% for AGIs $50k-75k , 11703.4% for AGIs $75k-100k , 20812.4% for AGIs $100k-200k , 94173.1% for AGIs over 200k ) Taxable interest for individuals: $571 (reported on 19.7% of returns )This zip code:
$571California:
$2,294
(% of AGI for various income ranges: 6.3% for AGIs below $25k , 4.7% for AGIs $25k-50k , 13.0% for AGIs $50k-75k , 23.2% for AGIs $75k-100k , 64.8% for AGIs $100k-200k , 375.6% for AGIs over 200k ) Ordinary dividends: $1,744 (reported on 7.9% of returns )(% of AGI for various income ranges: 3.4% for AGIs below $25k , 3.6% for AGIs $25k-50k , 7.8% for AGIs $50k-75k , 22.1% for AGIs $75k-100k , 59.2% for AGIs $100k-200k , 1008.1% for AGIs over 200k ) Net capital gain/loss in AGI: +$13,167 (reported on 9.8% of returns )Here:
+$13,167State:
+$49,306
(% of AGI for various income ranges: 5.0% for AGIs below $25k , 6.2% for AGIs $25k-50k , 25.0% for AGIs $50k-75k , 117.1% for AGIs $75k-100k , 325.3% for AGIs $100k-200k , 14391.2% for AGIs over 200k ) Profit/loss from business: +$10,398 (reported on 14.5% of returns )Here:
+$10,398State:
+$15,671
(% of AGI for various income ranges: 230.5% for AGIs below $25k , 158.1% for AGIs $25k-50k , 173.4% for AGIs $50k-75k , 263.5% for AGIs $75k-100k , 378.1% for AGIs $100k-200k , 2317.5% for AGIs over 200k ) Taxable individual retirement arrangement distribution: $13,732 (reported on 1.6% of returns )95116:
$13,732California:
$23,505
(% of AGI for various income ranges: 13.0% for AGIs below $25k , 17.8% for AGIs $25k-50k , 27.4% for AGIs $50k-75k , 47.4% for AGIs $75k-100k , 150.2% for AGIs $100k-200k , 250.0% for AGIs over 200k ) Total itemized deductions: $29,246 (reported on 8.0% of returns )Here:
$29,246State:
$39,517
(% of AGI for various income ranges: 50.9% for AGIs below $25k , 102.7% for AGIs $25k-50k , 299.7% for AGIs $50k-75k , 602.7% for AGIs $75k-100k , 1527.2% for AGIs $100k-200k , 7162.5% for AGIs over 200k ) Charity contributions: $4,667 (reported on 5.8% of returns )(% of AGI for various income ranges: 2.0% for AGIs below $25k , 7.6% for AGIs $25k-50k , 28.7% for AGIs $50k-75k , 47.7% for AGIs $75k-100k , 200.9% for AGIs $100k-200k , 1151.9% for AGIs over 200k ) Taxes paid: $9,025 (reported on 8.0% of returns )(% of AGI for various income ranges: 13.1% for AGIs below $25k , 30.0% for AGIs $25k-50k , 100.0% for AGIs $50k-75k , 202.3% for AGIs $75k-100k , 503.3% for AGIs $100k-200k , 1758.7% for AGIs over 200k ) Earned income credit: $2,037 (reported on 14.2% of returns )(% of AGI for various income ranges: 88.6% for AGIs below $25k , 54.4% for AGIs $25k-50k , 0.9% for AGIs $50k-75k ) Percentage of individuals using paid preparers for their 2020 taxes: 91.0%(% for various income ranges: 88.0% for AGIs below $25k , 91.4% for AGIs $25k-50k , 92.8% for AGIs $50k-75k , 93.0% for AGIs $75k-100k , 93.0% for AGIs $100k-200k , 94.7% for AGIs over 200k )
Averages for the 2012 tax year for zip code 95116, filed in 2013:
Average Adjusted Gross Income (AGI) in 2012: $35,908 (Individual Income Tax Returns) Here:
$35,908State:
$72,726
Salary/wage: $35,263 (reported on 89.7% of returns )Here:
$35,263State:
$59,079
(% of AGI for various income ranges: 81.8% for AGIs below $25k , 92.0% for AGIs $25k-50k , 90.7% for AGIs $50k-75k , 88.4% for AGIs $75k-100k , 88.9% for AGIs $100k-200k , 73.0% for AGIs over 200k ) Taxable interest for individuals: $422 (reported on 17.4% of returns )This zip code:
$422California:
$2,146
(% of AGI for various income ranges: 0.2% for AGIs below $25k , 0.1% for AGIs $25k-50k , 0.1% for AGIs $50k-75k , 0.3% for AGIs $75k-100k , 0.3% for AGIs $100k-200k , 0.8% for AGIs over 200k ) Ordinary dividends: $1,209 (reported on 4.7% of returns )(% of AGI for various income ranges: 0.2% for AGIs below $25k , 0.1% for AGIs $50k-75k , 0.2% for AGIs $75k-100k , 0.3% for AGIs $100k-200k , 0.5% for AGIs over 200k ) Net capital gain/loss in AGI: +$3,498 (reported on 4.5% of returns )Here:
+$3,498State:
+$30,460
(% of AGI for various income ranges: 0.4% for AGIs $75k-100k , 0.8% for AGIs $100k-200k , 6.0% for AGIs over 200k ) Profit/loss from business: +$10,605 (reported on 12.7% of returns )Here:
+$10,605State:
+$17,064
(% of AGI for various income ranges: 10.3% for AGIs below $25k , 2.9% for AGIs $25k-50k , 2.2% for AGIs $50k-75k , 2.1% for AGIs $75k-100k , 2.2% for AGIs $100k-200k ) Taxable individual retirement arrangement distribution: $12,312 (reported on 2.0% of returns )95116:
$12,312California:
$19,557
(% of AGI for various income ranges: 0.5% for AGIs below $25k , 0.4% for AGIs $25k-50k , 0.6% for AGIs $50k-75k , 1.4% for AGIs $75k-100k , 1.3% for AGIs $100k-200k ) Total itemized deductions: $21,702 (28% of AGI, reported on 17.8% of returns )Here:
$21,702State:
$34,004
Here:
28.3% of AGIState:
22.7% of AGI
(% of AGI for various income ranges: 4.5% for AGIs below $25k , 6.9% for AGIs $25k-50k , 13.3% for AGIs $50k-75k , 16.2% for AGIs $75k-100k , 16.9% for AGIs $100k-200k , 16.2% for AGIs over 200k ) Charity contributions: $1,828 (reported on 12.7% of returns )(% of AGI for various income ranges: 0.2% for AGIs below $25k , 0.3% for AGIs $25k-50k , 0.8% for AGIs $50k-75k , 1.1% for AGIs $75k-100k , 1.2% for AGIs $100k-200k , 0.9% for AGIs over 200k ) Taxes paid: $7,542 (reported on 17.7% of returns )95116:
$7,542State:
$14,448
(% of AGI for various income ranges: 1.0% for AGIs below $25k , 1.8% for AGIs $25k-50k , 4.0% for AGIs $50k-75k , 5.6% for AGIs $75k-100k , 7.2% for AGIs $100k-200k , 9.3% for AGIs over 200k ) Earned income credit: $2,302 (reported on 21.6% of returns )(% of AGI for various income ranges: 5.9% for AGIs below $25k , 1.0% for AGIs $25k-50k ) Percentage of individuals using paid preparers for their 2012 taxes: 76.2%(% for various income ranges: 75.9% for AGIs below $25k , 78.9% for AGIs $25k-50k , 76.9% for AGIs $50k-75k , 71.0% for AGIs $75k-100k , 66.0% for AGIs $100k-200k , 58.3% for AGIs over 200k )
Averages for the 2004 tax year for zip code 95116, filed in 2005:
Average Adjusted Gross Income (AGI) in 2004: $33,277 (Individual Income Tax Returns) Here:
$33,277State:
$58,600
Salary/wage: $32,681 (reported on 90.6% of returns )Here:
$32,681State:
$49,455
(% of AGI for various income ranges: 97.7% for AGIs below $10k , 87.4% for AGIs $10k-25k , 92.8% for AGIs $25k-50k , 91.8% for AGIs $50k-75k , 91.0% for AGIs $75k-100k , 74.2% for AGIs over 100k ) Taxable interest for individuals: $762 (reported on 25.4% of returns )This zip code:
$762California:
$2,365
(% of AGI for various income ranges: 2.1% for AGIs below $10k , 0.5% for AGIs $10k-25k , 0.3% for AGIs $25k-50k , 0.5% for AGIs $50k-75k , 0.5% for AGIs $75k-100k , 1.3% for AGIs over 100k ) Taxable dividends: $789 (reported on 6.1% of returns )(% of AGI for various income ranges: 0.6% for AGIs below $10k , 0.1% for AGIs $10k-25k , 0.1% for AGIs $25k-50k , 0.1% for AGIs $50k-75k , 0.1% for AGIs $75k-100k , 0.2% for AGIs over 100k ) Net capital gain/loss: +$5,743 (reported on 7.3% of returns )Here:
+$5,743State:
+$23,418
(% of AGI for various income ranges: -0.3% for AGIs below $10k , -0.2% for AGIs $10k-25k , -0.0% for AGIs $25k-50k , 0.3% for AGIs $50k-75k , 0.9% for AGIs $75k-100k , 8.1% for AGIs over 100k ) Profit/loss from business: +$10,165 (reported on 10.8% of returns )Here:
+$10,165State:
+$16,826
(% of AGI for various income ranges: 10.1% for AGIs below $10k , 5.0% for AGIs $10k-25k , 2.6% for AGIs $25k-50k , 2.2% for AGIs $50k-75k , 1.8% for AGIs $75k-100k , 4.7% for AGIs over 100k ) IRA payment deduction: $2,883 (reported on 1.0% of returns )95116:
$2,883California:
$3,192
(% of AGI for various income ranges: 0.1% for AGIs $10k-25k , 0.1% for AGIs $25k-50k , 0.1% for AGIs $50k-75k , 0.1% for AGIs $75k-100k , 0.1% for AGIs over 100k ) Self-employed pension: $11,731 (reported on 0.2% of returns )Here:
$11,731California:
$17,688
Total itemized deductions: $22,438 (37% of AGI, reported on 25.9% of returns )Here:
$22,438State:
$28,113
Here:
37.2% of AGIState:
25.3% of AGI
(% of AGI for various income ranges: 25.1% for AGIs below $10k , 9.5% for AGIs $10k-25k , 15.0% for AGIs $25k-50k , 22.1% for AGIs $50k-75k , 23.4% for AGIs $75k-100k , 19.9% for AGIs over 100k ) Charity contributions deductions: $1,621 (2% of AGI, reported on 19.9% of returns )Here:
2.5% of AGIState:
3.3% of AGI
(% of AGI for various income ranges: 0.4% for AGIs below $10k , 0.3% for AGIs $10k-25k , 0.7% for AGIs $25k-50k , 1.4% for AGIs $50k-75k , 1.5% for AGIs $75k-100k , 1.5% for AGIs over 100k ) Total tax: $3,766 (reported on 61.6% of returns )95116:
$3,766State:
$10,761
(% of AGI for various income ranges: 4.3% for AGIs below $10k , 2.9% for AGIs $10k-25k , 4.9% for AGIs $25k-50k , 7.2% for AGIs $50k-75k , 8.9% for AGIs $75k-100k , 15.4% for AGIs over 100k ) Earned income credit: $1,701 (reported on 19.3% of returns )Percentage of individuals using paid preparers for their 2004 taxes: 77.6%(% for various income ranges: 71.1% for AGIs below $10k , 80.6% for AGIs $10k-25k , 80.2% for AGIs $25k-50k , 76.1% for AGIs $50k-75k , 71.1% for AGIs $75k-100k , 70.6% for AGIs over 100k )
Estimated median household income in 2022: This zip code:
$80,903California:
$91,551
Nearest zip codes: 95133 ,
95122 ,
95112 ,
95113 ,
95127 ,
95110 .
San Jose Zip Code Map
Percentage of family households: This zip code:
51.6%California:
46.8%
Percentage of households with unmarried partners: This zip code:
8.5%California:
48.1%
Likely homosexual households (counted as self-reported same-sex unmarried-partner households)
Lesbian couples: 0.1% of all households Gay men: 0.2% of all households
Household received Food Stamps/SNAP in the past 12 months: 2,766Household did not receive Food Stamps/SNAP in the past 12 months: 11,216
Women who had a birth in the past 12 months: 641 (379 now married , 263 unmarried) Women who did not have a birth in the past 12 months: 12,321 (4,600 now married , 7,732 unmarried)
Housing units in zip code 95116 with a mortgage: 3,535 (255
second mortgage , 205
both second mortgage and home equity loan )
Houses without a mortgage: 145
Median monthly owner costs for units with a mortgage: $2,895
Median monthly owner costs for units without a mortgage: $768
Residents with income below the poverty level in 2022:
This zip code:
11.5%Whole state:
12.2%
Residents with income below 50% of the poverty level in 2022:
This zip code:
6.1%Whole state:
6.2%
Median number of rooms in houses and condos: Median number of rooms in apartments:
Year house built (houses)
21 2020 or later566 2010 to 20191,256 2000 to 20091,416 1990 to 19992,245 1980 to 19892,512 1970 to 19791,788 1960 to 19692,050 1950 to 1959688 1940 to 19491,369 1939 or earlier
Zip code 95116 household income distribution in 2022 669 Less than $10,000557 $10,000 to $14,999368 $15,000 to $19,999529 $20,000 to $24,999270 $25,000 to $29,999355 $30,000 to $34,999469 $35,000 to $39,999391 $40,000 to $44,999495 $45,000 to $49,999873 $50,000 to $59,9991,364 $60,000 to $74,9991,702 $75,000 to $99,9991,417 $100,000 to $124,999870 $125,000 to $149,9991,407 $150,000 to $199,9992,018 $200,000 or moreEstimate of home value of owner-occupied houses/condos in 2022 in zip code 95116 82 Less than $10,00052 $10,000 to $14,99913 $20,000 to $24,99940 $35,000 to $39,99918 $40,000 to $49,99912 $50,000 to $59,9993 $60,000 to $69,99981 $70,000 to $79,99930 $80,000 to $89,99934 $100,000 to $124,99935 $125,000 to $149,99977 $150,000 to $174,99940 $175,000 to $199,99918 $200,000 to $249,99925 $250,000 to $299,99972 $300,000 to $399,999233 $400,000 to $499,9991,138 $500,000 to $749,9992,210 $750,000 to $999,9991,399 $1,000,000 to $1,499,99928 $1,500,000 to $1,999,99931 $2,000,000 or moreRent paid by renters in 2022 in zip code 95116 76 Less than $10053 $200 to $249196 $250 to $299107 $300 to $34936 $350 to $39973 $400 to $44993 $450 to $499124 $500 to $54961 $550 to $59915 $600 to $64918 $650 to $69950 $700 to $74927 $750 to $799118 $800 to $899169 $900 to $999669 $1,000 to $1,249524 $1,250 to $1,4992,280 $1,500 to $1,9991,650 $2,000 to $2,499911 $2,500 to $2,999469 $3,000 to $3,499411 $3,500 or more130 No cash rent
Median gross rent in 2022: $1,975.
Median price asked for vacant for-sale houses and condos in 2022: $930,952.
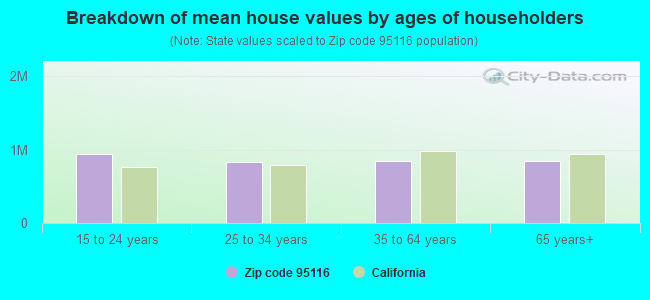
Estimated median house (or condo) value in 2022 for: White Non-Hispanic householders: $938,151Black or African American householders: $957,040American Indian or Alaska Native householders: $944,447Asian householders: $1,002,863Some other race householders: $903,871Two or more races householders: $987,822Hispanic or Latino householders: $885,681Estimated median house or condo value in 2022: $898,974
95116:
$898,974California:
$715,900
Lower value quartile - upper value quartile: $649,318 - $1,090,404
Mean price in 2022: Detached houses: $864,103Here:
$864,103State:
$988,808
Townhouses or other attached units: $884,063Here:
$884,063State:
$838,546
In 2-unit structures: $3,352,185Here:
$3,352,185State:
$1,138,100
In 3-to-4-unit structures: $231,305Here:
$231,305State:
$824,253
In 5-or-more-unit structures: $700,128Here:
$700,128State:
$730,996
Mobile homes: $110,838Here:
$110,838State:
$184,506
Occupied boats, RVs, vans, etc.: $148,550Here:
$148,550State:
$204,957
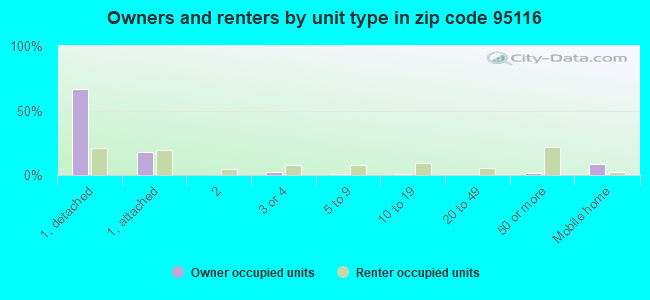
Housing units in structures:
One, detached: 5,502One, attached: 2,726Two: 3933 or 4: 8595 to 9: 69410 to 19: 75720 to 49: 50850 or more: 2,023Mobile homes: 675Boats, RVs, vans, etc.: 81Unemployment : 4.4%
Means of transportation to work in zip code 95116 65.0% 15,659 Drove a car alone18.1% 4,357 Carpooled2.1% 514 Bus or trolley bus0.2% 56 Streetcar or trolley car0.0% 9 Subway or elevated0.6% 145 Taxi0.2% 46 Motorcycle0.6% 138 Bicycle1.3% 312 Walked1.1% 264 Other means9.5% 2,292 Worked at homeTravel time to work (commute) in zip code 95116 267 Less than 5 minutes721 5 to 9 minutes2,573 10 to 14 minutes3,996 15 to 19 minutes4,392 20 to 24 minutes1,188 25 to 29 minutes3,634 30 to 34 minutes418 35 to 39 minutes741 40 to 44 minutes1,370 45 to 59 minutes1,353 60 to 89 minutes679 90 or more minutes
Neighborhoods in zip code 95116: Percentage of zip code residents living and working in this county: 86.8%
Household type by relationship:
Households: 50,017
Male householders: 6,600 (1,163 living alone ), Female householders: 7,176 (1,144 living alone )6,574 spouses (6,521 opposite-sex spouses ), 1,128 unmarried partners , (1,082 opposite-sex unmarried partners ), 15,545 children (14,917 natural , 164 adopted , 464 stepchildren ), 1,913 grandchildren , 2,053 brothers or sisters , 2,266 parents , 1 foster children , 3,282 other relatives , 2,687 non-relatives In group quarters: 582 (-1 institutionalized population )
Size of family households: 2,710 2-persons , 2,210 3-persons , 2,061 4-persons , 1,773 5-persons , 731 6-persons , 951 7-or-more-persons
Size of nonfamily households: 2,305 1-person , 443 2-persons , 205 3-persons , 186 4-persons , 82 5-persons , 10 6-persons , 22 7-or-more-persons
5,381 married couples with children. single-parent households (801 men , 2,353 women ).
21.1% of residents of 95116 zip code speak English at home. of residents speak Spanish at home (57% very well, 18% well, 18% not well, 7% not at all ).of residents speak other Indo-European language at home (59% very well, 17% well, 16% not well, 8% not at all ).of residents speak Asian or Pacific Island language at home (36% very well, 25% well, 32% not well, 8% not at all ).of residents speak other language at home (62% very well, 38% well ).
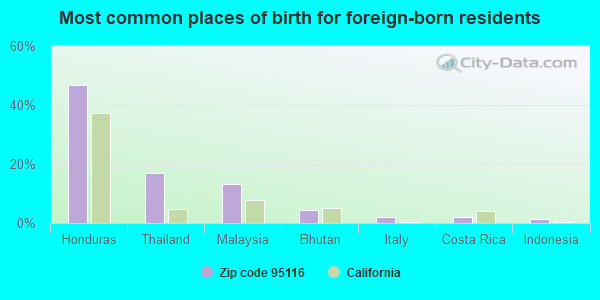
Foreign born population: 23,539 (47.1%)
(48.1%
of them are naturalized citizens )
This zip code:
47.1%Whole state:
26.7%
47% Honduras 17% Thailand 13% Malaysia 4% Bhutan 2% Italy 2% Costa Rica 1% Indonesia 2% Portuguese 0% American 0% English 0% Irish 0% European 0% African 0% Ethiopian
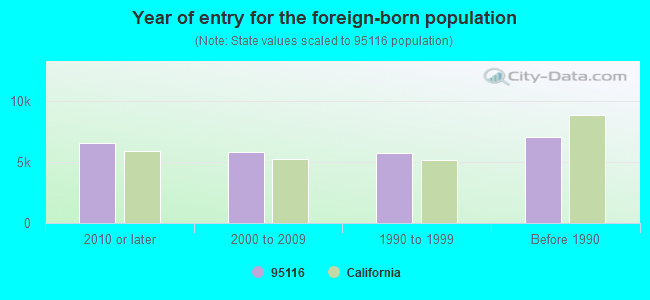
Year of entry for the foreign-born population
6,590 2010 or later 5,787 2000 to 2009 5,722 1990 to 1999 7,005 Before 1990
There are
90 Dentists 78 Internal Medicine Specialists 373 Other Medical Specialists in Zip Code 95116.
Major facilities with environmental interests located in this zip code:
ARBUCKLE (CLYDE) ELEMENTARY (1970 CINDERELLA LANE in SAN JOSE, CA)
(National Center for Education Statistics) - STATE ID-6046130 Organizations: ALUM ROCK UNION ELEMENTARY (SCHOOL DISTRICT)
ESCUELA POPULAR ACCELERATED FAMILY LEARNING (1180 E. JULIAN STREET in SAN JOSE, CA)
(National Center for Education Statistics) - STATE ID-4330726 Organizations: EAST SIDE UNION HIGH (SCHOOL DISTRICT)
GOSS (MILDRED) ELEMENTARY (2475 VAN WINKLE LANE in SAN JOSE, CA)
(National Center for Education Statistics) - STATE ID-6046247 Organizations: ALUM ROCK UNION ELEMENTARY (SCHOOL DISTRICT)
MACSA ACADEMIA CALMECAC (660 SINCLAIR DR. in SAN JOSE, CA)
(National Center for Education Statistics) - STATE ID-4330601 Organizations: EAST SIDE UNION HIGH (SCHOOL DISTRICT)
MACSA EL PORTAL LEADERSHIP ACADEMY (130 N. JACKSON AVE. in SAN JOSE, CA)
(National Center for Education Statistics) - STATE ID-4330619 Organizations: GILROY UNIFIED (SCHOOL DISTRICT)
MATHSON (LEE) MIDDLE (2050 KAMMERER AVE. in SAN JOSE, CA)
(National Center for Education Statistics) - STATE ID-6046197 Organizations: ALUM ROCK UNION ELEMENTARY (SCHOOL DISTRICT)
MCKINLEY ELEMENTARY (651 MACREDES AVE. in SAN JOSE, CA)
(National Center for Education Statistics) - STATE ID-6047245 Organizations: FRANKLIN-MCKINLEY ELEMENTARY (SCHOOL DISTRICT)
CHAVEZ (CESAR) ELEMENTARY (2000 KAMMERER AVE. in SAN JOSE, CA)
(National Center for Education Statistics) - STATE ID-6046239 Organizations: ALUM ROCK UNION ELEMENTARY (SCHOOL DISTRICT)
ALLEN WONG RENTAL PROPERTY (1806 STOWE AVENUE in SAN JOSE, CA)
(Integrated Compliance Information System) - ICIS-09-2005-0113, FORMAL ENFORCEMENT ACTION, ENFORCEMENT/COMPLIANCE ACTIVITY
24TH ST CLEANERS (1147 E SANTA CLARA ST in SAN JOSE, CA)
Small Quantity Generators, between 100 kg and 1000 kg of hazardous waste/month (Resource Conservation and Recovery Act (tracking hazardous waste)) Organizations: CHRISTOPHER FERGOSO (CONTACT/OWNER)
GARDEN CITY TRANSP (900 E WILLIAM ST in SAN JOSE, CA)
TRANSPORTER (Resource Conservation and Recovery Act (tracking hazardous waste)) Organizations: JOHN SHEA, PAUL MANZ, JOHN STEIN (CONTACT/OWNER)
C&J BODY SHOP (735 N 13TH ST in SAN JOSE, CA)
Small Quantity Generators, between 100 kg and 1000 kg of hazardous waste/month (Resource Conservation and Recovery Act (tracking hazardous waste)) - notification Organizations: RAFAEL GONZALES (CONTACT/OWNER)
CALTRANS- SAN JOSE LAB (1007 KNOX AVE in SAN JOSE, CA)
Small Quantity Generators, between 100 kg and 1000 kg of hazardous waste/month (Resource Conservation and Recovery Act (tracking hazardous waste)) - notification
Housing units lacking complete plumbing facilities: 0.6%
Housing units lacking complete kitchen facilities: 0.7%
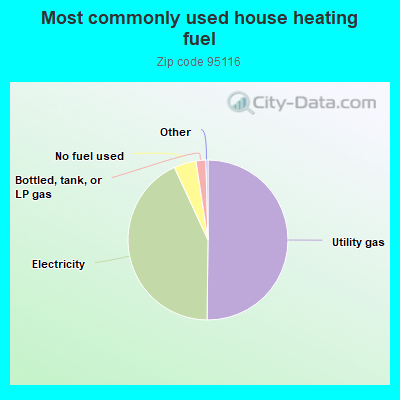
50.2% Utility gas 42.9% Electricity 4.5% No fuel used 2.0% Bottled, tank, or LP gas
Population in 1990: 46,754. Population change in the 1990s: +4,934 (+10.6%).
Place of birth for U.S.-born residents:
This state: 23,606Northeast: 322Midwest: 437South: 538West: 443
52% of the 95116 zip code residents lived in the same house 5 years ago.
Out of people who lived in different houses, 84% lived in this county.
Out of people who lived in different counties, 50% lived in California.
91% of the 95116 zip code residents lived in the same house 1 year ago.
Out of people who lived in different houses, 72% moved from this county.
Out of people who lived in different houses, 13% moved from different county within same state.
Out of people who lived in different houses, 3% moved from different state.
Out of people who lived in different houses, 12% moved from abroad.
Private vs. public school enrollment:
Students in private schools in grades 1 to 8 (elementary and middle school): 376
Here:
7.5%California:
10.5%
Students in private schools in grades 9 to 12 (high school): 246
Students in private undergraduate colleges: 237
Here:
6.6%California:
15.9%
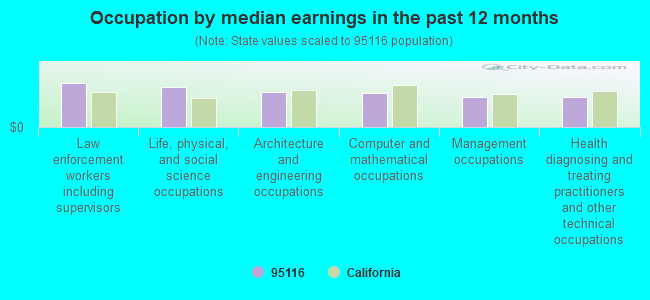
Occupation by median earnings in the past 12 months ($)
101,566 Law enforcement workers including supervisors 91,325 Life, physical, and social science occupations 79,690 Architecture and engineering occupations 78,324 Computer and mathematical occupations 70,279 Management occupations 69,536 Health diagnosing and treating practitioners and other technical occupations
Top industries in this zip code by the number of employees in 2005:
Health Care and Social Assistance: General Medical and Surgical Hospitals (over 1000 employees: 1 establishment)Construction: Drywall and Insulation Contractors (250-499: 1, 100-249: 2, 50-99: 1, 20-49: 1, 10-19: 1, 5-9: 1, 1-4: 1)Health Care and Social Assistance: Offices of Physicians (except Mental Health Specialists) (50-99: 1, 20-49: 3, 10-19: 3, 5-9: 22, 1-4: 63)Accommodation and Food Services: Limited-Service Restaurants (50-99: 2, 20-49: 4, 10-19: 4, 5-9: 4, 1-4: 7)Health Care and Social Assistance: Offices of Dentists (10-19: 6, 5-9: 25, 1-4: 27)Health Care and Social Assistance: Nursing Care Facilities (100-249: 1, 50-99: 1, 1-4: 1)Administrative and Support and Waste Management and Remediation Services: Landscaping Services (100-249: 1, 20-49: 1, 5-9: 1, 1-4: 3)Accommodation and Food Services: Full-Service Restaurants (20-49: 1, 10-19: 6, 5-9: 7, 1-4: 14)Construction: Painting and Wall Covering Contractors (50-99: 2, 20-49: 1, 5-9: 1, 1-4: 6)
People in group quarters in 2010:
281 people in nursing facilities/skilled-nursing facilities
134 people in other noninstitutional facilities
78 people in residential treatment centers for adults
40 people in group homes intended for adults
24 people in group homes for juveniles (non-correctional)
11 people in workers' group living quarters and job corps centers
People in group quarters in 2000:
288 people in nursing homes
115 people in other noninstitutional group quarters
43 people in other group homes
41 people in other nonhousehold living situations
29 people in homes or halfway houses for drug/alcohol abuse
8 people in homes for the mentally retarded
Fatal accident statistics in 2014:
Fatal accident count: 5Vehicles involved in fatal accidents: 5Fatal accidents caused by drunken drivers: 1Fatalities: 5Persons involved in fatal accidents: 8Pedestrians involved in fatal accidents: 4
Fatal accident statistics in 2013:
Fatal accident count: 1Vehicles involved in fatal accidents: 1Fatal accidents caused by drunken drivers: 1Fatalities: 1Persons involved in fatal accidents: 1Pedestrians involved in fatal accidents: 0
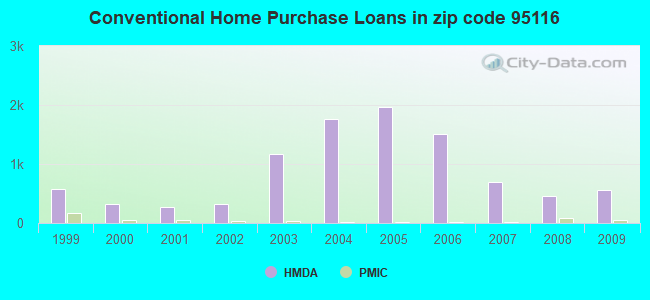
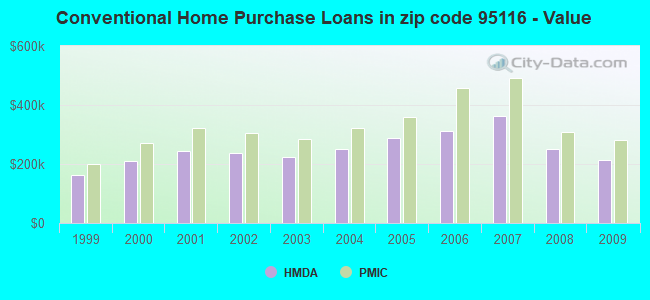
Home Mortgage Disclosure Act Aggregated Statistics For Year 2009(Based on 13 full and 6 partial tracts) A) FHA, FSA/RHS & VA B) Conventional C) Refinancings D) Home Improvement Loans E) Loans on Dwellings For 5+ Families F) Non-occupant Loans on G) Loans On Manufactured Number Average Value Number Average Value Number Average Value Number Average Value Number Average Value Number Average Value Number Average Value
LOANS ORIGINATED 163 $254,017 557 $213,067 440 $245,111 10 $158,728 6 $1,453,570 175 $200,421 0 $0 APPLICATIONS APPROVED, NOT ACCEPTED 22 $239,865 113 $235,903 99 $282,886 2 $357,775 1 $638,060 43 $243,620 0 $0 APPLICATIONS DENIED 61 $252,954 190 $207,175 257 $311,192 16 $87,008 0 $0 103 $241,989 4 $84,072 APPLICATIONS WITHDRAWN 38 $247,309 117 $202,930 135 $277,817 11 $88,397 0 $0 55 $219,106 0 $0 FILES CLOSED FOR INCOMPLETENESS 7 $294,434 21 $241,858 67 $327,696 2 $9,995 0 $0 7 $245,916 0 $0
Aggregated Statistics For Year 2008(Based on 13 full and 6 partial tracts) A) FHA, FSA/RHS & VA B) Conventional C) Refinancings D) Home Improvement Loans E) Loans on Dwellings For 5+ Families F) Non-occupant Loans on G) Loans On Manufactured Number Average Value Number Average Value Number Average Value Number Average Value Number Average Value Number Average Value Number Average Value
LOANS ORIGINATED 66 $309,232 452 $250,202 412 $305,197 44 $227,843 11 $1,553,451 161 $252,031 11 $48,901 APPLICATIONS APPROVED, NOT ACCEPTED 8 $330,218 119 $283,401 146 $347,372 9 $127,254 0 $0 32 $288,203 15 $91,059 APPLICATIONS DENIED 27 $302,733 224 $270,267 595 $364,791 80 $214,994 2 $566,555 100 $343,877 28 $98,234 APPLICATIONS WITHDRAWN 11 $376,564 97 $277,177 152 $351,749 27 $231,885 1 $4,029,840 35 $271,105 0 $0 FILES CLOSED FOR INCOMPLETENESS 3 $358,987 37 $287,731 78 $321,621 11 $362,795 0 $0 13 $250,263 0 $0
Aggregated Statistics For Year 2007(Based on 13 full and 6 partial tracts) A) FHA, FSA/RHS & VA B) Conventional C) Refinancings D) Home Improvement Loans E) Loans on Dwellings For 5+ Families F) Non-occupant Loans on G) Loans On Manufactured Number Average Value Number Average Value Number Average Value Number Average Value Number Average Value Number Average Value Number Average Value
LOANS ORIGINATED 2 $121,745 695 $361,163 1,481 $353,909 184 $269,603 18 $1,435,490 260 $352,986 8 $47,384 APPLICATIONS APPROVED, NOT ACCEPTED 0 $0 296 $340,006 469 $369,955 41 $315,459 0 $0 62 $355,618 16 $77,709 APPLICATIONS DENIED 0 $0 496 $353,748 1,201 $399,832 158 $245,691 0 $0 147 $392,447 34 $81,100 APPLICATIONS WITHDRAWN 1 $466,790 156 $358,364 347 $392,924 46 $320,206 0 $0 45 $413,452 0 $0 FILES CLOSED FOR INCOMPLETENESS 0 $0 49 $370,032 183 $383,404 15 $337,722 0 $0 11 $304,465 0 $0
Aggregated Statistics For Year 2006(Based on 13 full and 6 partial tracts) B) Conventional C) Refinancings D) Home Improvement Loans E) Loans on Dwellings For 5+ Families F) Non-occupant Loans on G) Loans On Manufactured Number Average Value Number Average Value Number Average Value Number Average Value Number Average Value Number Average Value
LOANS ORIGINATED 1,502 $312,264 1,981 $355,595 256 $284,094 16 $1,002,164 329 $347,568 6 $89,022 APPLICATIONS APPROVED, NOT ACCEPTED 405 $328,350 525 $353,206 43 $237,916 0 $0 61 $299,331 6 $82,050 APPLICATIONS DENIED 849 $312,585 1,155 $373,668 160 $327,283 1 $100,000 147 $353,981 5 $56,532 APPLICATIONS WITHDRAWN 349 $309,944 590 $353,104 37 $207,396 0 $0 59 $280,846 1 $465,000 FILES CLOSED FOR INCOMPLETENESS 91 $330,851 225 $360,438 13 $296,242 0 $0 28 $373,670 0 $0
Aggregated Statistics For Year 2005(Based on 13 full and 6 partial tracts) B) Conventional C) Refinancings D) Home Improvement Loans E) Loans on Dwellings For 5+ Families F) Non-occupant Loans on G) Loans On Manufactured Number Average Value Number Average Value Number Average Value Number Average Value Number Average Value Number Average Value
LOANS ORIGINATED 1,971 $289,258 2,298 $332,597 236 $317,639 22 $1,156,867 432 $337,513 1 $98,010 APPLICATIONS APPROVED, NOT ACCEPTED 449 $264,307 533 $314,446 52 $282,115 1 $355,100 88 $318,227 24 $69,621 APPLICATIONS DENIED 782 $305,686 1,387 $358,084 183 $244,067 4 $524,738 190 $369,384 34 $93,576 APPLICATIONS WITHDRAWN 317 $282,793 689 $333,923 75 $248,211 2 $438,420 94 $297,304 3 $139,967 FILES CLOSED FOR INCOMPLETENESS 71 $274,971 245 $328,179 22 $322,880 0 $0 19 $299,615 1 $247,150
Aggregated Statistics For Year 2004(Based on 13 full and 6 partial tracts) B) Conventional C) Refinancings D) Home Improvement Loans E) Loans on Dwellings For 5+ Families F) Non-occupant Loans on G) Loans On Manufactured Number Average Value Number Average Value Number Average Value Number Average Value Number Average Value Number Average Value
LOANS ORIGINATED 1,765 $250,766 2,141 $266,833 153 $243,206 13 $1,208,790 385 $280,152 8 $62,860 APPLICATIONS APPROVED, NOT ACCEPTED 379 $258,836 570 $267,117 20 $241,131 1 $1,288,820 80 $279,810 23 $69,115 APPLICATIONS DENIED 718 $241,985 1,108 $287,082 117 $148,561 0 $0 182 $264,828 36 $76,668 APPLICATIONS WITHDRAWN 309 $258,127 660 $267,262 20 $196,414 0 $0 46 $273,467 4 $52,635 FILES CLOSED FOR INCOMPLETENESS 52 $269,537 189 $286,387 16 $296,808 1 $179,100 24 $290,655 0 $0
Aggregated Statistics For Year 2003(Based on 13 full and 6 partial tracts) A) FHA, FSA/RHS & VA B) Conventional C) Refinancings D) Home Improvement Loans E) Loans on Dwellings For 5+ Families F) Non-occupant Loans on Number Average Value Number Average Value Number Average Value Number Average Value Number Average Value Number Average Value
LOANS ORIGINATED 3 $261,547 1,162 $222,159 3,582 $236,220 53 $63,979 18 $1,232,046 642 $234,178 APPLICATIONS APPROVED, NOT ACCEPTED 1 $105,110 203 $250,852 886 $248,319 14 $68,126 2 $1,983,800 123 $229,433 APPLICATIONS DENIED 0 $0 308 $198,932 1,149 $255,661 55 $46,957 0 $0 173 $268,836 APPLICATIONS WITHDRAWN 0 $0 152 $241,676 852 $246,229 15 $60,777 2 $887,850 74 $266,339 FILES CLOSED FOR INCOMPLETENESS 0 $0 27 $243,287 238 $254,137 0 $0 0 $0 27 $248,541
Aggregated Statistics For Year 2002(Based on 5 full and 4 partial tracts) A) FHA, FSA/RHS & VA B) Conventional C) Refinancings D) Home Improvement Loans E) Loans on Dwellings For 5+ Families F) Non-occupant Loans on Number Average Value Number Average Value Number Average Value Number Average Value Number Average Value Number Average Value
LOANS ORIGINATED 3 $191,587 325 $236,998 1,190 $235,418 31 $67,705 6 $785,700 219 $232,463 APPLICATIONS APPROVED, NOT ACCEPTED 2 $78,195 68 $239,789 230 $239,946 7 $141,927 0 $0 36 $219,125 APPLICATIONS DENIED 0 $0 129 $235,034 375 $256,628 35 $43,643 0 $0 45 $244,651 APPLICATIONS WITHDRAWN 0 $0 56 $214,998 312 $246,769 5 $56,086 0 $0 19 $273,920 FILES CLOSED FOR INCOMPLETENESS 0 $0 23 $216,918 101 $234,299 1 $120,000 0 $0 16 $241,647
Aggregated Statistics For Year 2001(Based on 5 full and 4 partial tracts) A) FHA, FSA/RHS & VA B) Conventional C) Refinancings D) Home Improvement Loans E) Loans on Dwellings For 5+ Families F) Non-occupant Loans on Number Average Value Number Average Value Number Average Value Number Average Value Number Average Value Number Average Value
LOANS ORIGINATED 0 $0 270 $242,524 966 $229,952 51 $57,492 5 $3,412,160 178 $230,556 APPLICATIONS APPROVED, NOT ACCEPTED 2 $162,670 52 $236,835 189 $229,765 20 $119,586 2 $690,360 31 $238,190 APPLICATIONS DENIED 4 $209,532 126 $200,241 349 $232,247 62 $34,794 0 $0 53 $214,051 APPLICATIONS WITHDRAWN 0 $0 62 $232,134 310 $224,773 17 $48,160 2 $1,190,280 15 $209,275 FILES CLOSED FOR INCOMPLETENESS 0 $0 26 $279,136 94 $244,159 2 $197,960 5 $2,692,284 3 $406,627
Aggregated Statistics For Year 2000(Based on 5 full and 4 partial tracts) A) FHA, FSA/RHS & VA B) Conventional C) Refinancings D) Home Improvement Loans E) Loans on Dwellings For 5+ Families F) Non-occupant Loans on Number Average Value Number Average Value Number Average Value Number Average Value Number Average Value Number Average Value
LOANS ORIGINATED 0 $0 324 $209,173 355 $198,641 42 $36,545 2 $515,790 84 $202,365 APPLICATIONS APPROVED, NOT ACCEPTED 0 $0 50 $215,382 91 $168,646 10 $36,216 0 $0 8 $240,115 APPLICATIONS DENIED 2 $42,650 113 $205,670 205 $171,113 55 $46,671 2 $548,520 34 $215,227 APPLICATIONS WITHDRAWN 0 $0 77 $207,386 128 $164,209 7 $34,680 1 $5,231,000 21 $192,219 FILES CLOSED FOR INCOMPLETENESS 0 $0 15 $248,169 99 $192,006 6 $30,405 1 $4,883,000 5 $166,470
Aggregated Statistics For Year 1999(Based on 2 full and 7 partial tracts) A) FHA, FSA/RHS & VA B) Conventional C) Refinancings D) Home Improvement Loans E) Loans on Dwellings For 5+ Families F) Non-occupant Loans on Number Average Value Number Average Value Number Average Value Number Average Value Number Average Value Number Average Value
LOANS ORIGINATED 20 $161,986 583 $163,305 609 $142,496 84 $25,025 6 $2,926,603 132 $145,472 APPLICATIONS APPROVED, NOT ACCEPTED 1 $203,050 79 $152,264 140 $155,869 22 $31,040 3 $660,420 21 $160,948 APPLICATIONS DENIED 2 $139,260 179 $152,693 283 $141,326 56 $38,492 1 $469,160 40 $153,799 APPLICATIONS WITHDRAWN 1 $20,000 107 $175,087 248 $135,782 9 $29,439 0 $0 28 $136,829 FILES CLOSED FOR INCOMPLETENESS 0 $0 25 $186,898 129 $152,288 4 $61,315 1 $1,636,310 7 $195,789
Private Mortgage Insurance Companies Aggregated Statistics For Year 2009(Based on 13 full and 6 partial tracts) A) Conventional B) Refinancings Number Average Value Number Average Value
LOANS ORIGINATED 47 $281,668 3 $304,407 APPLICATIONS APPROVED, NOT ACCEPTED 41 $240,146 10 $321,457 APPLICATIONS DENIED 7 $255,197 0 $0 APPLICATIONS WITHDRAWN 6 $360,620 2 $219,140 FILES CLOSED FOR INCOMPLETENESS 0 $0 4 $214,392
Aggregated Statistics For Year 2008(Based on 13 full and 6 partial tracts) A) Conventional B) Refinancings C) Non-occupant Loans on Number Average Value Number Average Value Number Average Value
LOANS ORIGINATED 91 $308,294 16 $400,036 3 $295,960 APPLICATIONS APPROVED, NOT ACCEPTED 34 $383,127 26 $389,702 5 $321,698 APPLICATIONS DENIED 13 $281,706 2 $377,810 6 $290,710 APPLICATIONS WITHDRAWN 12 $304,008 8 $349,162 2 $302,880 FILES CLOSED FOR INCOMPLETENESS 0 $0 4 $392,762 2 $562,635
Aggregated Statistics For Year 2007(Based on 13 full and 4 partial tracts) A) Conventional B) Refinancings C) Non-occupant Loans on Number Average Value Number Average Value Number Average Value
LOANS ORIGINATED 25 $491,432 34 $517,338 1 $326,860 APPLICATIONS APPROVED, NOT ACCEPTED 5 $507,634 22 $476,012 0 $0 APPLICATIONS DENIED 0 $0 6 $620,777 0 $0 APPLICATIONS WITHDRAWN 2 $370,815 3 $623,000 0 $0 FILES CLOSED FOR INCOMPLETENESS 0 $0 0 $0 0 $0
Aggregated Statistics For Year 2006(Based on 5 full and 2 partial tracts) A) Conventional B) Refinancings C) Non-occupant Loans on Number Average Value Number Average Value Number Average Value
LOANS ORIGINATED 9 $455,934 11 $441,852 2 $427,785 APPLICATIONS APPROVED, NOT ACCEPTED 4 $513,048 6 $369,482 0 $0 APPLICATIONS DENIED 0 $0 2 $439,780 0 $0 APPLICATIONS WITHDRAWN 0 $0 0 $0 0 $0 FILES CLOSED FOR INCOMPLETENESS 0 $0 0 $0 0 $0
Aggregated Statistics For Year 2005(Based on 11 full and 4 partial tracts) A) Conventional B) Refinancings Number Average Value Number Average Value
LOANS ORIGINATED 9 $359,061 31 $401,875 APPLICATIONS APPROVED, NOT ACCEPTED 5 $376,852 8 $426,351 APPLICATIONS DENIED 0 $0 4 $426,128 APPLICATIONS WITHDRAWN 0 $0 6 $495,810 FILES CLOSED FOR INCOMPLETENESS 0 $0 0 $0
Aggregated Statistics For Year 2004(Based on 13 full and 6 partial tracts) A) Conventional B) Refinancings Number Average Value Number Average Value
LOANS ORIGINATED 19 $322,329 55 $342,573 APPLICATIONS APPROVED, NOT ACCEPTED 2 $293,600 11 $216,144 APPLICATIONS DENIED 0 $0 2 $424,330 APPLICATIONS WITHDRAWN 0 $0 6 $308,375 FILES CLOSED FOR INCOMPLETENESS 0 $0 0 $0
Aggregated Statistics For Year 2003(Based on 13 full and 6 partial tracts) A) Conventional B) Refinancings C) Non-occupant Loans on Number Average Value Number Average Value Number Average Value
LOANS ORIGINATED 42 $283,486 52 $281,641 2 $259,870 APPLICATIONS APPROVED, NOT ACCEPTED 14 $255,572 20 $268,724 0 $0 APPLICATIONS DENIED 2 $310,400 0 $0 2 $310,400 APPLICATIONS WITHDRAWN 2 $382,810 4 $318,755 0 $0 FILES CLOSED FOR INCOMPLETENESS 0 $0 0 $0 0 $0
Aggregated Statistics For Year 2002(Based on 5 full and 4 partial tracts) A) Conventional B) Refinancings C) Non-occupant Loans on Number Average Value Number Average Value Number Average Value
LOANS ORIGINATED 39 $306,255 14 $311,629 4 $285,888 APPLICATIONS APPROVED, NOT ACCEPTED 11 $348,522 6 $272,555 1 $492,880 APPLICATIONS DENIED 2 $365,235 0 $0 0 $0 APPLICATIONS WITHDRAWN 0 $0 2 $236,070 0 $0 FILES CLOSED FOR INCOMPLETENESS 0 $0 0 $0 0 $0
Aggregated Statistics For Year 2001(Based on 5 full and 4 partial tracts) A) Conventional B) Refinancings C) Non-occupant Loans on Number Average Value Number Average Value Number Average Value
LOANS ORIGINATED 54 $320,928 9 $338,963 4 $234,585 APPLICATIONS APPROVED, NOT ACCEPTED 7 $334,613 2 $262,295 0 $0 APPLICATIONS DENIED 1 $238,640 1 $356,000 0 $0 APPLICATIONS WITHDRAWN 1 $305,810 2 $282,095 0 $0 FILES CLOSED FOR INCOMPLETENESS 0 $0 0 $0 0 $0
Aggregated Statistics For Year 2000(Based on 5 full and 4 partial tracts) A) Conventional B) Refinancings C) Non-occupant Loans on Number Average Value Number Average Value Number Average Value
LOANS ORIGINATED 59 $270,654 30 $217,300 2 $159,075 APPLICATIONS APPROVED, NOT ACCEPTED 19 $229,780 2 $170,290 0 $0 APPLICATIONS DENIED 5 $275,090 2 $213,260 0 $0 APPLICATIONS WITHDRAWN 1 $251,000 0 $0 0 $0 FILES CLOSED FOR INCOMPLETENESS 0 $0 0 $0 0 $0
Aggregated Statistics For Year 1999(Based on 2 full and 7 partial tracts) A) Conventional B) Refinancings C) Non-occupant Loans on Number Average Value Number Average Value Number Average Value
LOANS ORIGINATED 174 $200,469 29 $165,416 5 $169,548 APPLICATIONS APPROVED, NOT ACCEPTED 21 $199,785 11 $181,355 2 $154,140 APPLICATIONS DENIED 10 $203,607 6 $211,562 0 $0 APPLICATIONS WITHDRAWN 6 $178,805 3 $172,413 0 $0 FILES CLOSED FOR INCOMPLETENESS 3 $158,190 2 $137,810 0 $0
Most common first names in zip code 95116 among deceased individuals Name Count Lived (average)
Maria 170 79.3 years Mary 150 79.4 years John 115 72.4 years Manuel 107 76.0 years Jose 106 74.0 years Frank 78 75.7 years Joseph 75 74.9 years Antonio 51 78.6 years William 51 76.6 years Robert 49 69.4 years
Most common last names in zip code 95116 among deceased individuals Last name Count Lived (average)
Garcia 70 74.6 years Hernandez 59 72.6 years Martinez 55 70.9 years Rodriguez 53 71.1 years Lopez 47 72.3 years Nguyen 45 76.0 years Silva 41 78.0 years Smith 39 77.5 years Gonzalez 37 68.3 years Sanchez 34 74.0 years
Businesses in zip code 95116
Name Count Name Count
7-Eleven 2 McDonald's 2 Baskin-Robbins 1 Nike 1 Carl\s Jr. 1 Penske 1 FedEx 1 Subway 4 H&R Block 1 Taco Bell 1 KFC 1 U-Haul 1 Kohl's 1 Walgreens 1 Little Caesars Pizza 1 Wendy's 1

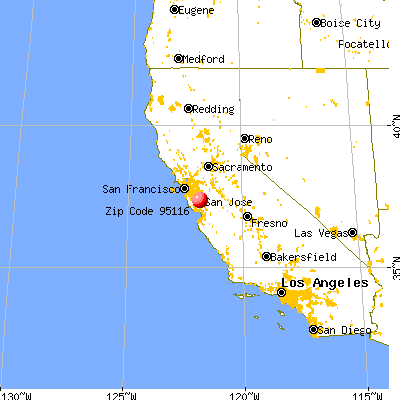


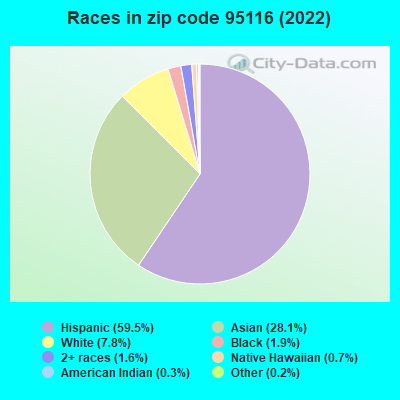


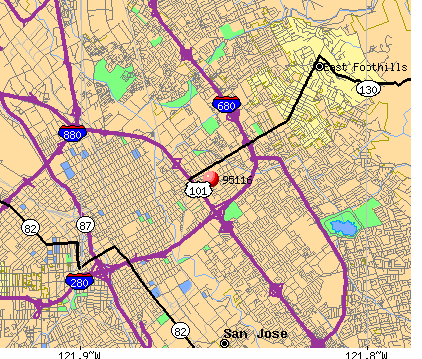 Nearest zip codes: 95133, 95122, 95112, 95113, 95127, 95110.