Estimated zip code population in 2022: 52,118
Zip code population in 2010: 56,545
Zip code population in 2000: 59,822
Houses and condos: 12,657
Renter-occupied apartments: 6,010
% of renters here:
49%State:
44%
March 2022 cost of living index in zip code 95122: 123.0
(high, U.S. average is 100)
Land area: 4.8
sq. mi.
Water area: 0.0
sq. mi.
Population density: 10,961 people per square mile (high).
OSM Map
General Map
Google Map
MSN Map
OSM Map
General Map
Google Map
MSN Map
OSM Map
General Map
Google Map
MSN Map
OSM Map
General Map
Google Map
MSN Map
Please wait while loading the map...
Real estate property taxes paid for housing units in 2022:
This zip code:
0.7% ($6,168)California:
0.7% ($4,831)
Median real estate property taxes paid for housing units with mortgages in 2022: $6,833 (0.8%)
Median real estate property taxes paid for housing units with no mortgage in 2022: $4,750 (0.5%)
Profiles of local businesses
Business Search - 14 Million verified businesses
Males: 26,335 Females: 25,782
For population 25 years and over in 95122:
High school or higher: 66.1%Bachelor's degree or higher: 17.8%Graduate or professional degree: 4.1%Unemployed: 6.3%Mean travel time to work (commute): 27.4 minutes
For population 15 years and over in 95122:
Never married: 42.8%Now married: 44.2%Separated: 1.7%Widowed: 4.9%Divorced: 6.5%
Zip code 95122 compared to state average:
Black race population percentage below state average. Foreign-born population percentage above state average. Length of stay since moving in significantly above state average. Percentage of population with a bachelor's degree or higher below state average. 29,831 57.2% Hispanic or Latino 18,276 35.1% Asian 1,865 3.6% White 1,025 2.0% Black 523 1.0% Two or more races 244 0.5% Native Hawaiian and Other 239 0.5% Some other race 111 0.2% American Indian
Data:
Median household income ($)
Median household income (% change since 2000)
Household income diversity
Ratio of average income to average house value (%)
Ratio of average income to average rent
Median household income ($) - White
Median household income ($) - Black or African American
Median household income ($) - Asian
Median household income ($) - Hispanic or Latino
Median household income ($) - American Indian and Alaska Native
Median household income ($) - Multirace
Median household income ($) - Other Race
Median household income for houses/condos with a mortgage ($)
Median household income for apartments without a mortgage ($)
Races - White alone (%)
Races - White alone (% change since 2000)
Races - Black alone (%)
Races - Black alone (% change since 2000)
Races - American Indian alone (%)
Races - American Indian alone (% change since 2000)
Races - Asian alone (%)
Races - Asian alone (% change since 2000)
Races - Hispanic (%)
Races - Hispanic (% change since 2000)
Races - Native Hawaiian and Other Pacific Islander alone (%)
Races - Native Hawaiian and Other Pacific Islander alone (% change since 2000)
Races - Two or more races (%)
Races - Two or more races (% change since 2000)
Races - Other race alone (%)
Races - Other race alone (% change since 2000)
Racial diversity
Unemployment (%)
Unemployment (% change since 2000)
Unemployment (%) - White
Unemployment (%) - Black or African American
Unemployment (%) - Asian
Unemployment (%) - Hispanic or Latino
Unemployment (%) - American Indian and Alaska Native
Unemployment (%) - Multirace
Unemployment (%) - Other Race
Population density (people per square mile)
Population - Males (%)
Population - Females (%)
Population - Males (%) - White
Population - Males (%) - Black or African American
Population - Males (%) - Asian
Population - Males (%) - Hispanic or Latino
Population - Males (%) - American Indian and Alaska Native
Population - Males (%) - Multirace
Population - Males (%) - Other Race
Population - Females (%) - White
Population - Females (%) - Black or African American
Population - Females (%) - Asian
Population - Females (%) - Hispanic or Latino
Population - Females (%) - American Indian and Alaska Native
Population - Females (%) - Multirace
Population - Females (%) - Other Race
Coronavirus confirmed cases (Apr 27, 2024)
Deaths caused by coronavirus (Apr 27, 2024)
Coronavirus confirmed cases (per 100k population) (Apr 27, 2024)
Deaths caused by coronavirus (per 100k population) (Apr 27, 2024)
Daily increase in number of cases (Apr 27, 2024)
Weekly increase in number of cases (Apr 27, 2024)
Cases doubled (in days) (Apr 27, 2024)
Hospitalized patients (Apr 18, 2022)
Negative test results (Apr 18, 2022)
Total test results (Apr 18, 2022)
COVID Vaccine doses distributed (per 100k population) (Sep 19, 2023)
COVID Vaccine doses administered (per 100k population) (Sep 19, 2023)
COVID Vaccine doses distributed (Sep 19, 2023)
COVID Vaccine doses administered (Sep 19, 2023)
Likely homosexual households (%)
Likely homosexual households (% change since 2000)
Likely homosexual households - Lesbian couples (%)
Likely homosexual households - Lesbian couples (% change since 2000)
Likely homosexual households - Gay men (%)
Likely homosexual households - Gay men (% change since 2000)
Cost of living index
Median gross rent ($)
Median contract rent ($)
Median monthly housing costs ($)
Median house or condo value ($)
Median house or condo value ($ change since 2000)
Mean house or condo value by units in structure - 1, detached ($)
Mean house or condo value by units in structure - 1, attached ($)
Mean house or condo value by units in structure - 2 ($)
Mean house or condo value by units in structure by units in structure - 3 or 4 ($)
Mean house or condo value by units in structure - 5 or more ($)
Mean house or condo value by units in structure - Boat, RV, van, etc. ($)
Mean house or condo value by units in structure - Mobile home ($)
Median house or condo value ($) - White
Median house or condo value ($) - Black or African American
Median house or condo value ($) - Asian
Median house or condo value ($) - Hispanic or Latino
Median house or condo value ($) - American Indian and Alaska Native
Median house or condo value ($) - Multirace
Median house or condo value ($) - Other Race
Median resident age
Resident age diversity
Median resident age - Males
Median resident age - Females
Median resident age - White
Median resident age - Black or African American
Median resident age - Asian
Median resident age - Hispanic or Latino
Median resident age - American Indian and Alaska Native
Median resident age - Multirace
Median resident age - Other Race
Median resident age - Males - White
Median resident age - Males - Black or African American
Median resident age - Males - Asian
Median resident age - Males - Hispanic or Latino
Median resident age - Males - American Indian and Alaska Native
Median resident age - Males - Multirace
Median resident age - Males - Other Race
Median resident age - Females - White
Median resident age - Females - Black or African American
Median resident age - Females - Asian
Median resident age - Females - Hispanic or Latino
Median resident age - Females - American Indian and Alaska Native
Median resident age - Females - Multirace
Median resident age - Females - Other Race
Commute - mean travel time to work (minutes)
Travel time to work - Less than 5 minutes (%)
Travel time to work - Less than 5 minutes (% change since 2000)
Travel time to work - 5 to 9 minutes (%)
Travel time to work - 5 to 9 minutes (% change since 2000)
Travel time to work - 10 to 19 minutes (%)
Travel time to work - 10 to 19 minutes (% change since 2000)
Travel time to work - 20 to 29 minutes (%)
Travel time to work - 20 to 29 minutes (% change since 2000)
Travel time to work - 30 to 39 minutes (%)
Travel time to work - 30 to 39 minutes (% change since 2000)
Travel time to work - 40 to 59 minutes (%)
Travel time to work - 40 to 59 minutes (% change since 2000)
Travel time to work - 60 to 89 minutes (%)
Travel time to work - 60 to 89 minutes (% change since 2000)
Travel time to work - 90 or more minutes (%)
Travel time to work - 90 or more minutes (% change since 2000)
Marital status - Never married (%)
Marital status - Now married (%)
Marital status - Separated (%)
Marital status - Widowed (%)
Marital status - Divorced (%)
Median family income ($)
Median family income (% change since 2000)
Median non-family income ($)
Median non-family income (% change since 2000)
Median per capita income ($)
Median per capita income (% change since 2000)
Median family income ($) - White
Median family income ($) - Black or African American
Median family income ($) - Asian
Median family income ($) - Hispanic or Latino
Median family income ($) - American Indian and Alaska Native
Median family income ($) - Multirace
Median family income ($) - Other Race
Median year house/condo built
Median year apartment built
Year house built - Built 2005 or later (%)
Year house built - Built 2000 to 2004 (%)
Year house built - Built 1990 to 1999 (%)
Year house built - Built 1980 to 1989 (%)
Year house built - Built 1970 to 1979 (%)
Year house built - Built 1960 to 1969 (%)
Year house built - Built 1950 to 1959 (%)
Year house built - Built 1940 to 1949 (%)
Year house built - Built 1939 or earlier (%)
Average household size
Household density (households per square mile)
Average household size - White
Average household size - Black or African American
Average household size - Asian
Average household size - Hispanic or Latino
Average household size - American Indian and Alaska Native
Average household size - Multirace
Average household size - Other Race
Occupied housing units (%)
Vacant housing units (%)
Owner occupied housing units (%)
Renter occupied housing units (%)
Vacancy status - For rent (%)
Vacancy status - For sale only (%)
Vacancy status - Rented or sold, not occupied (%)
Vacancy status - For seasonal, recreational, or occasional use (%)
Vacancy status - For migrant workers (%)
Vacancy status - Other vacant (%)
Residents with income below the poverty level (%)
Residents with income below 50% of the poverty level (%)
Children below poverty level (%)
Poor families by family type - Married-couple family (%)
Poor families by family type - Male, no wife present (%)
Poor families by family type - Female, no husband present (%)
Poverty status for native-born residents (%)
Poverty status for foreign-born residents (%)
Poverty among high school graduates not in families (%)
Poverty among people who did not graduate high school not in families (%)
Residents with income below the poverty level (%) - White
Residents with income below the poverty level (%) - Black or African American
Residents with income below the poverty level (%) - Asian
Residents with income below the poverty level (%) - Hispanic or Latino
Residents with income below the poverty level (%) - American Indian and Alaska Native
Residents with income below the poverty level (%) - Multirace
Residents with income below the poverty level (%) - Other Race
Air pollution - Air Quality Index (AQI)
Air pollution - CO
Air pollution - NO2
Air pollution - SO2
Air pollution - Ozone
Air pollution - PM10
Air pollution - PM25
Air pollution - Pb
Crime - Murders per 100,000 population
Crime - Rapes per 100,000 population
Crime - Robberies per 100,000 population
Crime - Assaults per 100,000 population
Crime - Burglaries per 100,000 population
Crime - Thefts per 100,000 population
Crime - Auto thefts per 100,000 population
Crime - Arson per 100,000 population
Crime - City-data.com crime index
Crime - Violent crime index
Crime - Property crime index
Crime - Murders per 100,000 population (5 year average)
Crime - Rapes per 100,000 population (5 year average)
Crime - Robberies per 100,000 population (5 year average)
Crime - Assaults per 100,000 population (5 year average)
Crime - Burglaries per 100,000 population (5 year average)
Crime - Thefts per 100,000 population (5 year average)
Crime - Auto thefts per 100,000 population (5 year average)
Crime - Arson per 100,000 population (5 year average)
Crime - City-data.com crime index (5 year average)
Crime - Violent crime index (5 year average)
Crime - Property crime index (5 year average)
1996 Presidential Elections Results (%) - Democratic Party (Clinton)
1996 Presidential Elections Results (%) - Republican Party (Dole)
1996 Presidential Elections Results (%) - Other
2000 Presidential Elections Results (%) - Democratic Party (Gore)
2000 Presidential Elections Results (%) - Republican Party (Bush)
2000 Presidential Elections Results (%) - Other
2004 Presidential Elections Results (%) - Democratic Party (Kerry)
2004 Presidential Elections Results (%) - Republican Party (Bush)
2004 Presidential Elections Results (%) - Other
2008 Presidential Elections Results (%) - Democratic Party (Obama)
2008 Presidential Elections Results (%) - Republican Party (McCain)
2008 Presidential Elections Results (%) - Other
2012 Presidential Elections Results (%) - Democratic Party (Obama)
2012 Presidential Elections Results (%) - Republican Party (Romney)
2012 Presidential Elections Results (%) - Other
2016 Presidential Elections Results (%) - Democratic Party (Clinton)
2016 Presidential Elections Results (%) - Republican Party (Trump)
2016 Presidential Elections Results (%) - Other
2020 Presidential Elections Results (%) - Democratic Party (Biden)
2020 Presidential Elections Results (%) - Republican Party (Trump)
2020 Presidential Elections Results (%) - Other
Ancestries Reported - Arab (%)
Ancestries Reported - Czech (%)
Ancestries Reported - Danish (%)
Ancestries Reported - Dutch (%)
Ancestries Reported - English (%)
Ancestries Reported - French (%)
Ancestries Reported - French Canadian (%)
Ancestries Reported - German (%)
Ancestries Reported - Greek (%)
Ancestries Reported - Hungarian (%)
Ancestries Reported - Irish (%)
Ancestries Reported - Italian (%)
Ancestries Reported - Lithuanian (%)
Ancestries Reported - Norwegian (%)
Ancestries Reported - Polish (%)
Ancestries Reported - Portuguese (%)
Ancestries Reported - Russian (%)
Ancestries Reported - Scotch-Irish (%)
Ancestries Reported - Scottish (%)
Ancestries Reported - Slovak (%)
Ancestries Reported - Subsaharan African (%)
Ancestries Reported - Swedish (%)
Ancestries Reported - Swiss (%)
Ancestries Reported - Ukrainian (%)
Ancestries Reported - United States (%)
Ancestries Reported - Welsh (%)
Ancestries Reported - West Indian (%)
Ancestries Reported - Other (%)
Educational Attainment - No schooling completed (%)
Educational Attainment - Less than high school (%)
Educational Attainment - High school or equivalent (%)
Educational Attainment - Less than 1 year of college (%)
Educational Attainment - 1 or more years of college (%)
Educational Attainment - Associate degree (%)
Educational Attainment - Bachelor's degree (%)
Educational Attainment - Master's degree (%)
Educational Attainment - Professional school degree (%)
Educational Attainment - Doctorate degree (%)
School Enrollment - Nursery, preschool (%)
School Enrollment - Kindergarten (%)
School Enrollment - Grade 1 to 4 (%)
School Enrollment - Grade 5 to 8 (%)
School Enrollment - Grade 9 to 12 (%)
School Enrollment - College undergrad (%)
School Enrollment - Graduate or professional (%)
School Enrollment - Not enrolled in school (%)
School enrollment - Public schools (%)
School enrollment - Private schools (%)
School enrollment - Not enrolled (%)
Median number of rooms in houses and condos
Median number of rooms in apartments
Housing units lacking complete plumbing facilities (%)
Housing units lacking complete kitchen facilities (%)
Density of houses
Urban houses (%)
Rural houses (%)
Households with people 60 years and over (%)
Households with people 65 years and over (%)
Households with people 75 years and over (%)
Households with one or more nonrelatives (%)
Households with no nonrelatives (%)
Population in households (%)
Family households (%)
Nonfamily households (%)
Population in families (%)
Family households with own children (%)
Median number of bedrooms in owner occupied houses
Mean number of bedrooms in owner occupied houses
Median number of bedrooms in renter occupied houses
Mean number of bedrooms in renter occupied houses
Median number of vehichles in owner occupied houses
Mean number of vehichles in owner occupied houses
Median number of vehichles in renter occupied houses
Mean number of vehichles in renter occupied houses
Mortgage status - with mortgage (%)
Mortgage status - with second mortgage (%)
Mortgage status - with home equity loan (%)
Mortgage status - with both second mortgage and home equity loan (%)
Mortgage status - without a mortgage (%)
Average family size
Average family size - White
Average family size - Black or African American
Average family size - Asian
Average family size - Hispanic or Latino
Average family size - American Indian and Alaska Native
Average family size - Multirace
Average family size - Other Race
Geographical mobility - Same house 1 year ago (%)
Geographical mobility - Moved within same county (%)
Geographical mobility - Moved from different county within same state (%)
Geographical mobility - Moved from different state (%)
Geographical mobility - Moved from abroad (%)
Place of birth - Born in state of residence (%)
Place of birth - Born in other state (%)
Place of birth - Native, outside of US (%)
Place of birth - Foreign born (%)
Housing units in structures - 1, detached (%)
Housing units in structures - 1, attached (%)
Housing units in structures - 2 (%)
Housing units in structures - 3 or 4 (%)
Housing units in structures - 5 to 9 (%)
Housing units in structures - 10 to 19 (%)
Housing units in structures - 20 to 49 (%)
Housing units in structures - 50 or more (%)
Housing units in structures - Mobile home (%)
Housing units in structures - Boat, RV, van, etc. (%)
House/condo owner moved in on average (years ago)
Renter moved in on average (years ago)
Year householder moved into unit - Moved in 1999 to March 2000 (%)
Year householder moved into unit - Moved in 1995 to 1998 (%)
Year householder moved into unit - Moved in 1990 to 1994 (%)
Year householder moved into unit - Moved in 1980 to 1989 (%)
Year householder moved into unit - Moved in 1970 to 1979 (%)
Year householder moved into unit - Moved in 1969 or earlier (%)
Means of transportation to work - Drove car alone (%)
Means of transportation to work - Carpooled (%)
Means of transportation to work - Public transportation (%)
Means of transportation to work - Bus or trolley bus (%)
Means of transportation to work - Streetcar or trolley car (%)
Means of transportation to work - Subway or elevated (%)
Means of transportation to work - Railroad (%)
Means of transportation to work - Ferryboat (%)
Means of transportation to work - Taxicab (%)
Means of transportation to work - Motorcycle (%)
Means of transportation to work - Bicycle (%)
Means of transportation to work - Walked (%)
Means of transportation to work - Other means (%)
Working at home (%)
Industry diversity
Most Common Industries - Agriculture, forestry, fishing and hunting, and mining (%)
Most Common Industries - Agriculture, forestry, fishing and hunting (%)
Most Common Industries - Mining, quarrying, and oil and gas extraction (%)
Most Common Industries - Construction (%)
Most Common Industries - Manufacturing (%)
Most Common Industries - Wholesale trade (%)
Most Common Industries - Retail trade (%)
Most Common Industries - Transportation and warehousing, and utilities (%)
Most Common Industries - Transportation and warehousing (%)
Most Common Industries - Utilities (%)
Most Common Industries - Information (%)
Most Common Industries - Finance and insurance, and real estate and rental and leasing (%)
Most Common Industries - Finance and insurance (%)
Most Common Industries - Real estate and rental and leasing (%)
Most Common Industries - Professional, scientific, and management, and administrative and waste management services (%)
Most Common Industries - Professional, scientific, and technical services (%)
Most Common Industries - Management of companies and enterprises (%)
Most Common Industries - Administrative and support and waste management services (%)
Most Common Industries - Educational services, and health care and social assistance (%)
Most Common Industries - Educational services (%)
Most Common Industries - Health care and social assistance (%)
Most Common Industries - Arts, entertainment, and recreation, and accommodation and food services (%)
Most Common Industries - Arts, entertainment, and recreation (%)
Most Common Industries - Accommodation and food services (%)
Most Common Industries - Other services, except public administration (%)
Most Common Industries - Public administration (%)
Occupation diversity
Most Common Occupations - Management, business, science, and arts occupations (%)
Most Common Occupations - Management, business, and financial occupations (%)
Most Common Occupations - Management occupations (%)
Most Common Occupations - Business and financial operations occupations (%)
Most Common Occupations - Computer, engineering, and science occupations (%)
Most Common Occupations - Computer and mathematical occupations (%)
Most Common Occupations - Architecture and engineering occupations (%)
Most Common Occupations - Life, physical, and social science occupations (%)
Most Common Occupations - Education, legal, community service, arts, and media occupations (%)
Most Common Occupations - Community and social service occupations (%)
Most Common Occupations - Legal occupations (%)
Most Common Occupations - Education, training, and library occupations (%)
Most Common Occupations - Arts, design, entertainment, sports, and media occupations (%)
Most Common Occupations - Healthcare practitioners and technical occupations (%)
Most Common Occupations - Health diagnosing and treating practitioners and other technical occupations (%)
Most Common Occupations - Health technologists and technicians (%)
Most Common Occupations - Service occupations (%)
Most Common Occupations - Healthcare support occupations (%)
Most Common Occupations - Protective service occupations (%)
Most Common Occupations - Fire fighting and prevention, and other protective service workers including supervisors (%)
Most Common Occupations - Law enforcement workers including supervisors (%)
Most Common Occupations - Food preparation and serving related occupations (%)
Most Common Occupations - Building and grounds cleaning and maintenance occupations (%)
Most Common Occupations - Personal care and service occupations (%)
Most Common Occupations - Sales and office occupations (%)
Most Common Occupations - Sales and related occupations (%)
Most Common Occupations - Office and administrative support occupations (%)
Most Common Occupations - Natural resources, construction, and maintenance occupations (%)
Most Common Occupations - Farming, fishing, and forestry occupations (%)
Most Common Occupations - Construction and extraction occupations (%)
Most Common Occupations - Installation, maintenance, and repair occupations (%)
Most Common Occupations - Production, transportation, and material moving occupations (%)
Most Common Occupations - Production occupations (%)
Most Common Occupations - Transportation occupations (%)
Most Common Occupations - Material moving occupations (%)
People in Group quarters - Institutionalized population (%)
People in Group quarters - Correctional institutions (%)
People in Group quarters - Federal prisons and detention centers (%)
People in Group quarters - Halfway houses (%)
People in Group quarters - Local jails and other confinement facilities (including police lockups) (%)
People in Group quarters - Military disciplinary barracks (%)
People in Group quarters - State prisons (%)
People in Group quarters - Other types of correctional institutions (%)
People in Group quarters - Nursing homes (%)
People in Group quarters - Hospitals/wards, hospices, and schools for the handicapped (%)
People in Group quarters - Hospitals/wards and hospices for chronically ill (%)
People in Group quarters - Hospices or homes for chronically ill (%)
People in Group quarters - Military hospitals or wards for chronically ill (%)
People in Group quarters - Other hospitals or wards for chronically ill (%)
People in Group quarters - Hospitals or wards for drug/alcohol abuse (%)
People in Group quarters - Mental (Psychiatric) hospitals or wards (%)
People in Group quarters - Schools, hospitals, or wards for the mentally retarded (%)
People in Group quarters - Schools, hospitals, or wards for the physically handicapped (%)
People in Group quarters - Institutions for the deaf (%)
People in Group quarters - Institutions for the blind (%)
People in Group quarters - Orthopedic wards and institutions for the physically handicapped (%)
People in Group quarters - Wards in general hospitals for patients who have no usual home elsewhere (%)
People in Group quarters - Wards in military hospitals for patients who have no usual home elsewhere (%)
People in Group quarters - Juvenile institutions (%)
People in Group quarters - Long-term care (%)
People in Group quarters - Homes for abused, dependent, and neglected children (%)
People in Group quarters - Residential treatment centers for emotionally disturbed children (%)
People in Group quarters - Training schools for juvenile delinquents (%)
People in Group quarters - Short-term care, detention or diagnostic centers for delinquent children (%)
People in Group quarters - Type of juvenile institution unknown (%)
People in Group quarters - Noninstitutionalized population (%)
People in Group quarters - College dormitories (includes college quarters off campus) (%)
People in Group quarters - Military quarters (%)
People in Group quarters - On base (%)
People in Group quarters - Barracks, unaccompanied personnel housing (UPH), (Enlisted/Officer), ;and similar group living quarters for military personnel (%)
People in Group quarters - Transient quarters for temporary residents (%)
People in Group quarters - Military ships (%)
People in Group quarters - Group homes (%)
People in Group quarters - Homes or halfway houses for drug/alcohol abuse (%)
People in Group quarters - Homes for the mentally ill (%)
People in Group quarters - Homes for the mentally retarded (%)
People in Group quarters - Homes for the physically handicapped (%)
People in Group quarters - Other group homes (%)
People in Group quarters - Religious group quarters (%)
People in Group quarters - Dormitories (%)
People in Group quarters - Agriculture workers' dormitories on farms (%)
People in Group quarters - Job Corps and vocational training facilities (%)
People in Group quarters - Other workers' dormitories (%)
People in Group quarters - Crews of maritime vessels (%)
People in Group quarters - Other nonhousehold living situations (%)
People in Group quarters - Other noninstitutional group quarters (%)
Residents speaking English at home (%)
Residents speaking English at home - Born in the United States (%)
Residents speaking English at home - Native, born elsewhere (%)
Residents speaking English at home - Foreign born (%)
Residents speaking Spanish at home (%)
Residents speaking Spanish at home - Born in the United States (%)
Residents speaking Spanish at home - Native, born elsewhere (%)
Residents speaking Spanish at home - Foreign born (%)
Residents speaking other language at home (%)
Residents speaking other language at home - Born in the United States (%)
Residents speaking other language at home - Native, born elsewhere (%)
Residents speaking other language at home - Foreign born (%)
Class of Workers - Employee of private company (%)
Class of Workers - Self-employed in own incorporated business (%)
Class of Workers - Private not-for-profit wage and salary workers (%)
Class of Workers - Local government workers (%)
Class of Workers - State government workers (%)
Class of Workers - Federal government workers (%)
Class of Workers - Self-employed workers in own not incorporated business and Unpaid family workers (%)
House heating fuel used in houses and condos - Utility gas (%)
House heating fuel used in houses and condos - Bottled, tank, or LP gas (%)
House heating fuel used in houses and condos - Electricity (%)
House heating fuel used in houses and condos - Fuel oil, kerosene, etc. (%)
House heating fuel used in houses and condos - Coal or coke (%)
House heating fuel used in houses and condos - Wood (%)
House heating fuel used in houses and condos - Solar energy (%)
House heating fuel used in houses and condos - Other fuel (%)
House heating fuel used in houses and condos - No fuel used (%)
House heating fuel used in apartments - Utility gas (%)
House heating fuel used in apartments - Bottled, tank, or LP gas (%)
House heating fuel used in apartments - Electricity (%)
House heating fuel used in apartments - Fuel oil, kerosene, etc. (%)
House heating fuel used in apartments - Coal or coke (%)
House heating fuel used in apartments - Wood (%)
House heating fuel used in apartments - Solar energy (%)
House heating fuel used in apartments - Other fuel (%)
House heating fuel used in apartments - No fuel used (%)
Armed forces status - In Armed Forces (%)
Armed forces status - Civilian (%)
Armed forces status - Civilian - Veteran (%)
Armed forces status - Civilian - Nonveteran (%)
Fatal accidents locations in years 2005-2021
Fatal accidents locations in 2005
Fatal accidents locations in 2006
Fatal accidents locations in 2007
Fatal accidents locations in 2008
Fatal accidents locations in 2009
Fatal accidents locations in 2010
Fatal accidents locations in 2011
Fatal accidents locations in 2012
Fatal accidents locations in 2013
Fatal accidents locations in 2014
Fatal accidents locations in 2015
Fatal accidents locations in 2016
Fatal accidents locations in 2017
Fatal accidents locations in 2018
Fatal accidents locations in 2019
Fatal accidents locations in 2020
Fatal accidents locations in 2021
Alcohol use - People drinking some alcohol every month (%)
Alcohol use - People not drinking at all (%)
Alcohol use - Average days/month drinking alcohol
Alcohol use - Average drinks/week
Alcohol use - Average days/year people drink much
Audiometry - Average condition of hearing (%)
Audiometry - People that can hear a whisper from across a quiet room (%)
Audiometry - People that can hear normal voice from across a quiet room (%)
Audiometry - Ears ringing, roaring, buzzing (%)
Audiometry - Had a job exposure to loud noise (%)
Audiometry - Had off-work exposure to loud noise (%)
Blood Pressure & Cholesterol - Has high blood pressure (%)
Blood Pressure & Cholesterol - Checking blood pressure at home (%)
Blood Pressure & Cholesterol - Frequently checking blood cholesterol (%)
Blood Pressure & Cholesterol - Has high cholesterol level (%)
Consumer Behavior - Money monthly spent on food at supermarket/grocery store
Consumer Behavior - Money monthly spent on food at other stores
Consumer Behavior - Money monthly spent on eating out
Consumer Behavior - Money monthly spent on carryout/delivered foods
Consumer Behavior - Income spent on food at supermarket/grocery store (%)
Consumer Behavior - Income spent on food at other stores (%)
Consumer Behavior - Income spent on eating out (%)
Consumer Behavior - Income spent on carryout/delivered foods (%)
Current Health Status - General health condition (%)
Current Health Status - Blood donors (%)
Current Health Status - Has blood ever tested for HIV virus (%)
Current Health Status - Left-handed people (%)
Dermatology - People using sunscreen (%)
Diabetes - Diabetics (%)
Diabetes - Had a blood test for high blood sugar (%)
Diabetes - People taking insulin (%)
Diet Behavior & Nutrition - Diet health (%)
Diet Behavior & Nutrition - Milk product consumption (# of products/month)
Diet Behavior & Nutrition - Meals not home prepared (#/week)
Diet Behavior & Nutrition - Meals from fast food or pizza place (#/week)
Diet Behavior & Nutrition - Ready-to-eat foods (#/month)
Diet Behavior & Nutrition - Frozen meals/pizza (#/month)
Drug Use - People that ever used marijuana or hashish (%)
Drug Use - Ever used hard drugs (%)
Drug Use - Ever used any form of cocaine (%)
Drug Use - Ever used heroin (%)
Drug Use - Ever used methamphetamine (%)
Health Insurance - People covered by health insurance (%)
Kidney Conditions-Urology - Avg. # of times urinating at night
Medical Conditions - People with asthma (%)
Medical Conditions - People with anemia (%)
Medical Conditions - People with psoriasis (%)
Medical Conditions - People with overweight (%)
Medical Conditions - Elderly people having difficulties in thinking or remembering (%)
Medical Conditions - People who ever received blood transfusion (%)
Medical Conditions - People having trouble seeing even with glass/contacts (%)
Medical Conditions - People with arthritis (%)
Medical Conditions - People with gout (%)
Medical Conditions - People with congestive heart failure (%)
Medical Conditions - People with coronary heart disease (%)
Medical Conditions - People with angina pectoris (%)
Medical Conditions - People who ever had heart attack (%)
Medical Conditions - People who ever had stroke (%)
Medical Conditions - People with emphysema (%)
Medical Conditions - People with thyroid problem (%)
Medical Conditions - People with chronic bronchitis (%)
Medical Conditions - People with any liver condition (%)
Medical Conditions - People who ever had cancer or malignancy (%)
Mental Health - People who have little interest in doing things (%)
Mental Health - People feeling down, depressed, or hopeless (%)
Mental Health - People who have trouble sleeping or sleeping too much (%)
Mental Health - People feeling tired or having little energy (%)
Mental Health - People with poor appetite or overeating (%)
Mental Health - People feeling bad about themself (%)
Mental Health - People who have trouble concentrating on things (%)
Mental Health - People moving or speaking slowly or too fast (%)
Mental Health - People having thoughts they would be better off dead (%)
Oral Health - Average years since last visit a dentist
Oral Health - People embarrassed because of mouth (%)
Oral Health - People with gum disease (%)
Oral Health - General health of teeth and gums (%)
Oral Health - Average days a week using dental floss/device
Oral Health - Average days a week using mouthwash for dental problem
Oral Health - Average number of teeth
Pesticide Use - Households using pesticides to control insects (%)
Pesticide Use - Households using pesticides to kill weeds (%)
Physical Activity - People doing vigorous-intensity work activities (%)
Physical Activity - People doing moderate-intensity work activities (%)
Physical Activity - People walking or bicycling (%)
Physical Activity - People doing vigorous-intensity recreational activities (%)
Physical Activity - People doing moderate-intensity recreational activities (%)
Physical Activity - Average hours a day doing sedentary activities
Physical Activity - Average hours a day watching TV or videos
Physical Activity - Average hours a day using computer
Physical Functioning - People having limitations keeping them from working (%)
Physical Functioning - People limited in amount of work they can do (%)
Physical Functioning - People that need special equipment to walk (%)
Physical Functioning - People experiencing confusion/memory problems (%)
Physical Functioning - People requiring special healthcare equipment (%)
Prescription Medications - Average number of prescription medicines taking
Preventive Aspirin Use - Adults 40+ taking low-dose aspirin (%)
Reproductive Health - Vaginal deliveries (%)
Reproductive Health - Cesarean deliveries (%)
Reproductive Health - Deliveries resulted in a live birth (%)
Reproductive Health - Pregnancies resulted in a delivery (%)
Reproductive Health - Women breastfeeding newborns (%)
Reproductive Health - Women that had a hysterectomy (%)
Reproductive Health - Women that had both ovaries removed (%)
Reproductive Health - Women that have ever taken birth control pills (%)
Reproductive Health - Women taking birth control pills (%)
Reproductive Health - Women that have ever used Depo-Provera or injectables (%)
Reproductive Health - Women that have ever used female hormones (%)
Sexual Behavior - People 18+ that ever had sex (vaginal, anal, or oral) (%)
Sexual Behavior - Males 18+ that ever had vaginal sex with a woman (%)
Sexual Behavior - Males 18+ that ever performed oral sex on a woman (%)
Sexual Behavior - Males 18+ that ever had anal sex with a woman (%)
Sexual Behavior - Males 18+ that ever had any sex with a man (%)
Sexual Behavior - Females 18+ that ever had vaginal sex with a man (%)
Sexual Behavior - Females 18+ that ever performed oral sex on a man (%)
Sexual Behavior - Females 18+ that ever had anal sex with a man (%)
Sexual Behavior - Females 18+ that ever had any kind of sex with a woman (%)
Sexual Behavior - Average age people first had sex
Sexual Behavior - Average number of female sex partners in lifetime (males 18+)
Sexual Behavior - Average number of female vaginal sex partners in lifetime (males 18+)
Sexual Behavior - Average age people first performed oral sex on a woman (18+)
Sexual Behavior - Average number of woman performed oral sex on in lifetime (18+)
Sexual Behavior - Average number of male sex partners in lifetime (males 18+)
Sexual Behavior - Average number of male anal sex partners in lifetime (males 18+)
Sexual Behavior - Average age people first performed oral sex on a man (18+)
Sexual Behavior - Average number of male oral sex partners in lifetime (18+)
Sexual Behavior - People using protection when performing oral sex (%)
Sexual Behavior - Average number of times people have vaginal or anal sex a year
Sexual Behavior - People having sex without condom (%)
Sexual Behavior - Average number of male sex partners in lifetime (females 18+)
Sexual Behavior - Average number of male vaginal sex partners in lifetime (females 18+)
Sexual Behavior - Average number of female sex partners in lifetime (females 18+)
Sexual Behavior - Circumcised males 18+ (%)
Sleep Disorders - Average hours sleeping at night
Sleep Disorders - People that has trouble sleeping (%)
Smoking-Cigarette Use - People smoking cigarettes (%)
Taste & Smell - People 40+ having problems with smell (%)
Taste & Smell - People 40+ having problems with taste (%)
Taste & Smell - People 40+ that ever had wisdom teeth removed (%)
Taste & Smell - People 40+ that ever had tonsils teeth removed (%)
Taste & Smell - People 40+ that ever had a loss of consciousness because of a head injury (%)
Taste & Smell - People 40+ that ever had a broken nose or other serious injury to face or skull (%)
Taste & Smell - People 40+ that ever had two or more sinus infections (%)
Weight - Average height (inches)
Weight - Average weight (pounds)
Weight - Average BMI
Weight - People that are obese (%)
Weight - People that ever were obese (%)
Weight - People trying to lose weight (%)
100%
urban population.
Estimated median house/condo value in 2022: $887,138
95122:
$887,138California:
$715,900
Median resident age: This zip code:
36.0 yearsCalifornia median age:
37.9 years
Average household size: This zip code:
4.2 peopleCalifornia:
2.8 people
Averages for the 2020 tax year for zip code 95122, filed in 2021:
Average Adjusted Gross Income (AGI) in 2020: $53,589 (Individual Income Tax Returns) Here:
$53,589State:
$95,910
Salary/wage: $51,260 (reported on 87.8% of returns )Here:
$51,260State:
$77,331
(% of AGI for various income ranges: 1294.6% for AGIs below $25k , 4392.3% for AGIs $25k-50k , 7936.8% for AGIs $50k-75k , 11672.3% for AGIs $75k-100k , 21473.4% for AGIs $100k-200k , 99150.0% for AGIs over 200k ) Taxable interest for individuals: $473 (reported on 20.7% of returns )This zip code:
$473California:
$2,294
(% of AGI for various income ranges: 6.0% for AGIs below $25k , 5.7% for AGIs $25k-50k , 10.5% for AGIs $50k-75k , 24.6% for AGIs $75k-100k , 51.1% for AGIs $100k-200k , 357.5% for AGIs over 200k ) Ordinary dividends: $1,375 (reported on 8.3% of returns )(% of AGI for various income ranges: 2.9% for AGIs below $25k , 5.2% for AGIs $25k-50k , 9.2% for AGIs $50k-75k , 13.8% for AGIs $75k-100k , 68.1% for AGIs $100k-200k , 748.8% for AGIs over 200k ) Net capital gain/loss in AGI: +$12,674 (reported on 10.6% of returns )Here:
+$12,674State:
+$49,306
(% of AGI for various income ranges: 4.4% for AGIs below $25k , 13.7% for AGIs $25k-50k , 47.4% for AGIs $50k-75k , 90.3% for AGIs $75k-100k , 424.5% for AGIs $100k-200k , 16737.5% for AGIs over 200k ) Profit/loss from business: +$9,626 (reported on 14.2% of returns )Here:
+$9,626State:
+$15,671
(% of AGI for various income ranges: 211.7% for AGIs below $25k , 131.3% for AGIs $25k-50k , 154.3% for AGIs $50k-75k , 200.1% for AGIs $75k-100k , 445.4% for AGIs $100k-200k , 2285.6% for AGIs over 200k ) Taxable individual retirement arrangement distribution: $15,044 (reported on 1.8% of returns )95122:
$15,044California:
$23,505
(% of AGI for various income ranges: 16.1% for AGIs below $25k , 15.4% for AGIs $25k-50k , 31.8% for AGIs $50k-75k , 48.1% for AGIs $75k-100k , 183.2% for AGIs $100k-200k , 853.8% for AGIs over 200k ) Total itemized deductions: $29,587 (reported on 8.3% of returns )Here:
$29,587State:
$39,517
(% of AGI for various income ranges: 41.8% for AGIs below $25k , 136.1% for AGIs $25k-50k , 370.1% for AGIs $50k-75k , 697.8% for AGIs $75k-100k , 1569.5% for AGIs $100k-200k , 7310.0% for AGIs over 200k ) Charity contributions: $3,572 (reported on 6.3% of returns )(% of AGI for various income ranges: 1.3% for AGIs below $25k , 8.6% for AGIs $25k-50k , 28.2% for AGIs $50k-75k , 56.9% for AGIs $75k-100k , 172.1% for AGIs $100k-200k , 833.8% for AGIs over 200k ) Taxes paid: $8,887 (reported on 8.3% of returns )(% of AGI for various income ranges: 13.2% for AGIs below $25k , 39.7% for AGIs $25k-50k , 117.2% for AGIs $50k-75k , 226.4% for AGIs $75k-100k , 496.4% for AGIs $100k-200k , 1707.5% for AGIs over 200k ) Earned income credit: $1,967 (reported on 15.1% of returns )(% of AGI for various income ranges: 86.9% for AGIs below $25k , 57.3% for AGIs $25k-50k , 0.7% for AGIs $50k-75k ) Percentage of individuals using paid preparers for their 2020 taxes: 91.3%(% for various income ranges: 89.0% for AGIs below $25k , 92.0% for AGIs $25k-50k , 92.4% for AGIs $50k-75k , 92.2% for AGIs $75k-100k , 92.7% for AGIs $100k-200k , 95.2% for AGIs over 200k )
Averages for the 2012 tax year for zip code 95122, filed in 2013:
Average Adjusted Gross Income (AGI) in 2012: $34,548 (Individual Income Tax Returns) Here:
$34,548State:
$72,726
Salary/wage: $33,941 (reported on 89.4% of returns )Here:
$33,941State:
$59,079
(% of AGI for various income ranges: 81.2% for AGIs below $25k , 91.0% for AGIs $25k-50k , 89.7% for AGIs $50k-75k , 89.7% for AGIs $75k-100k , 87.6% for AGIs $100k-200k , 73.9% for AGIs over 200k ) Taxable interest for individuals: $240 (reported on 18.6% of returns )This zip code:
$240California:
$2,146
(% of AGI for various income ranges: 0.2% for AGIs below $25k , 0.1% for AGIs $50k-75k , 0.1% for AGIs $75k-100k , 0.2% for AGIs $100k-200k , 0.2% for AGIs over 200k ) Ordinary dividends: $1,282 (reported on 4.3% of returns )(% of AGI for various income ranges: 0.2% for AGIs below $25k , 0.1% for AGIs $50k-75k , 0.2% for AGIs $75k-100k , 0.3% for AGIs $100k-200k , 0.4% for AGIs over 200k ) Net capital gain/loss in AGI: +$565 (reported on 4.8% of returns )(% of AGI for various income ranges: 0.6% for AGIs $100k-200k , 1.6% for AGIs over 200k ) Profit/loss from business: +$10,913 (reported on 12.5% of returns )Here:
+$10,913State:
+$17,064
(% of AGI for various income ranges: 10.1% for AGIs below $25k , 3.3% for AGIs $25k-50k , 2.4% for AGIs $50k-75k , 2.0% for AGIs $75k-100k , 2.1% for AGIs $100k-200k ) Taxable individual retirement arrangement distribution: $11,588 (reported on 2.4% of returns )95122:
$11,588California:
$19,557
(% of AGI for various income ranges: 0.8% for AGIs below $25k , 0.6% for AGIs $25k-50k , 1.0% for AGIs $50k-75k , 0.9% for AGIs $75k-100k , 1.2% for AGIs $100k-200k ) Total itemized deductions: $20,788 (31% of AGI, reported on 19.2% of returns )Here:
$20,788State:
$34,004
Here:
30.6% of AGIState:
22.7% of AGI
(% of AGI for various income ranges: 5.6% for AGIs below $25k , 8.3% for AGIs $25k-50k , 14.1% for AGIs $50k-75k , 17.1% for AGIs $75k-100k , 16.9% for AGIs $100k-200k , 18.0% for AGIs over 200k ) Charity contributions: $1,671 (reported on 13.7% of returns )(% of AGI for various income ranges: 0.1% for AGIs below $25k , 0.4% for AGIs $25k-50k , 0.8% for AGIs $50k-75k , 1.1% for AGIs $75k-100k , 1.2% for AGIs $100k-200k , 1.0% for AGIs over 200k ) Taxes paid: $7,141 (reported on 19.2% of returns )95122:
$7,141State:
$14,448
(% of AGI for various income ranges: 1.5% for AGIs below $25k , 2.6% for AGIs $25k-50k , 4.6% for AGIs $50k-75k , 5.9% for AGIs $75k-100k , 7.0% for AGIs $100k-200k , 8.1% for AGIs over 200k ) Earned income credit: $2,265 (reported on 24.3% of returns )(% of AGI for various income ranges: 6.5% for AGIs below $25k , 1.2% for AGIs $25k-50k ) Percentage of individuals using paid preparers for their 2012 taxes: 76.2%(% for various income ranges: 74.9% for AGIs below $25k , 79.0% for AGIs $25k-50k , 76.8% for AGIs $50k-75k , 73.6% for AGIs $75k-100k , 71.1% for AGIs $100k-200k , 62.5% for AGIs over 200k )
Averages for the 2004 tax year for zip code 95122, filed in 2005:
Average Adjusted Gross Income (AGI) in 2004: $32,993 (Individual Income Tax Returns) Here:
$32,993State:
$58,600
Salary/wage: $32,462 (reported on 91.4% of returns )Here:
$32,462State:
$49,455
(% of AGI for various income ranges: 92.2% for AGIs below $10k , 86.7% for AGIs $10k-25k , 93.1% for AGIs $25k-50k , 92.3% for AGIs $50k-75k , 91.3% for AGIs $75k-100k , 77.0% for AGIs over 100k ) Taxable interest for individuals: $417 (reported on 26.2% of returns )This zip code:
$417California:
$2,365
(% of AGI for various income ranges: 1.1% for AGIs below $10k , 0.3% for AGIs $10k-25k , 0.2% for AGIs $25k-50k , 0.3% for AGIs $50k-75k , 0.3% for AGIs $75k-100k , 0.6% for AGIs over 100k ) Taxable dividends: $646 (reported on 6.0% of returns )(% of AGI for various income ranges: 0.3% for AGIs below $10k , 0.1% for AGIs $10k-25k , 0.1% for AGIs $25k-50k , 0.1% for AGIs $50k-75k , 0.2% for AGIs $75k-100k , 0.2% for AGIs over 100k ) Net capital gain/loss: +$3,569 (reported on 7.0% of returns )Here:
+$3,569State:
+$23,418
(% of AGI for various income ranges: -0.3% for AGIs below $10k , -0.1% for AGIs $10k-25k , -0.1% for AGIs $25k-50k , 0.4% for AGIs $50k-75k , 1.2% for AGIs $75k-100k , 5.1% for AGIs over 100k ) Profit/loss from business: +$8,983 (reported on 11.2% of returns )Here:
+$8,983State:
+$16,826
(% of AGI for various income ranges: 9.1% for AGIs below $10k , 6.3% for AGIs $10k-25k , 2.6% for AGIs $25k-50k , 1.9% for AGIs $50k-75k , 1.5% for AGIs $75k-100k , 2.5% for AGIs over 100k ) IRA payment deduction: $2,793 (reported on 1.1% of returns )95122:
$2,793California:
$3,192
(% of AGI for various income ranges: 0.1% for AGIs below $10k , 0.1% for AGIs $10k-25k , 0.1% for AGIs $25k-50k , 0.1% for AGIs $50k-75k , 0.1% for AGIs $75k-100k , 0.1% for AGIs over 100k ) Self-employed pension: $3,667 (reported on 0.1% of returns )Here:
$3,667California:
$17,688
Total itemized deductions: $22,615 (40% of AGI, reported on 28.0% of returns )Here:
$22,615State:
$28,113
Here:
39.7% of AGIState:
25.3% of AGI
(% of AGI for various income ranges: 14.4% for AGIs below $10k , 10.3% for AGIs $10k-25k , 17.7% for AGIs $25k-50k , 23.0% for AGIs $50k-75k , 23.3% for AGIs $75k-100k , 25.4% for AGIs over 100k ) Charity contributions deductions: $1,489 (2% of AGI, reported on 22.0% of returns )Here:
2.5% of AGIState:
3.3% of AGI
(% of AGI for various income ranges: 0.3% for AGIs below $10k , 0.3% for AGIs $10k-25k , 0.8% for AGIs $25k-50k , 1.3% for AGIs $50k-75k , 1.7% for AGIs $75k-100k , 1.5% for AGIs over 100k ) Total tax: $3,263 (reported on 62.8% of returns )95122:
$3,263State:
$10,761
(% of AGI for various income ranges: 3.3% for AGIs below $10k , 3.1% for AGIs $10k-25k , 4.8% for AGIs $25k-50k , 6.7% for AGIs $50k-75k , 8.3% for AGIs $75k-100k , 12.6% for AGIs over 100k ) Earned income credit: $1,760 (reported on 20.2% of returns )Percentage of individuals using paid preparers for their 2004 taxes: 77.7%(% for various income ranges: 69.8% for AGIs below $10k , 80.1% for AGIs $10k-25k , 80.3% for AGIs $25k-50k , 78.5% for AGIs $50k-75k , 73.9% for AGIs $75k-100k , 72.7% for AGIs over 100k )
Estimated median household income in 2022: This zip code:
$94,558California:
$91,551
Nearest zip codes: 95116 ,
95121 ,
95111 ,
95133 ,
95112 ,
95127 .
San Jose Zip Code Map
Percentage of family households: This zip code:
51.6%California:
46.8%
Percentage of households with unmarried partners: This zip code:
8.4%California:
48.1%
No gay or lesbian households reported
Household received Food Stamps/SNAP in the past 12 months: 2,607Household did not receive Food Stamps/SNAP in the past 12 months: 9,840
Women who had a birth in the past 12 months: 699 (509 now married , 190 unmarried) Women who did not have a birth in the past 12 months: 12,043 (4,291 now married , 7,772 unmarried)
Housing units in zip code 95122 with a mortgage: 3,883 (376
second mortgage , 10
home equity loan , 276
both second mortgage and home equity loan )
Houses without a mortgage: 28
Median monthly owner costs for units with a mortgage: $2,858
Median monthly owner costs for units without a mortgage: $851
Residents with income below the poverty level in 2022:
This zip code:
10.6%Whole state:
12.2%
Residents with income below 50% of the poverty level in 2022:
This zip code:
5.8%Whole state:
6.2%
Median number of rooms in houses and condos: Median number of rooms in apartments:
Year house built (houses)
0 2020 or later129 2010 to 2019548 2000 to 20091,123 1990 to 19991,554 1980 to 19893,238 1970 to 19793,284 1960 to 19692,013 1950 to 1959170 1940 to 1949205 1939 or earlier
Zip code 95122 household income distribution in 2022 339 Less than $10,000563 $10,000 to $14,999215 $15,000 to $19,999195 $20,000 to $24,999287 $25,000 to $29,999199 $30,000 to $34,999315 $35,000 to $39,999272 $40,000 to $44,999381 $45,000 to $49,999777 $50,000 to $59,999972 $60,000 to $74,9991,794 $75,000 to $99,9991,312 $100,000 to $124,9991,119 $125,000 to $149,9991,430 $150,000 to $199,9992,010 $200,000 or moreEstimate of home value of owner-occupied houses/condos in 2022 in zip code 95122 90 Less than $10,0005 $10,000 to $14,9996 $20,000 to $24,9998 $25,000 to $29,9996 $35,000 to $39,99913 $50,000 to $59,9998 $60,000 to $69,99933 $80,000 to $89,99934 $100,000 to $124,9997 $125,000 to $149,99920 $150,000 to $174,9995 $175,000 to $199,99929 $200,000 to $249,99949 $250,000 to $299,999215 $300,000 to $399,999162 $400,000 to $499,9991,541 $500,000 to $749,9993,189 $750,000 to $999,999902 $1,000,000 to $1,499,99990 $1,500,000 to $1,999,999103 $2,000,000 or moreRent paid by renters in 2022 in zip code 95122 39 $150 to $1997 $200 to $249101 $250 to $299204 $300 to $34941 $350 to $3993 $400 to $44989 $450 to $49994 $500 to $54912 $550 to $59936 $600 to $64928 $650 to $69952 $700 to $74973 $750 to $799111 $800 to $89951 $900 to $999283 $1,000 to $1,249195 $1,250 to $1,4991,012 $1,500 to $1,9991,510 $2,000 to $2,4991,009 $2,500 to $2,999509 $3,000 to $3,499341 $3,500 or more219 No cash rent
Median gross rent in 2022: $2,290.
Median price asked for vacant for-sale houses and condos in 2022: $813,466.
Estimated median house (or condo) value in 2022 for: White Non-Hispanic householders: $840,635Black or African American householders: $895,918American Indian or Alaska Native householders: $897,544Asian householders: $937,869Native Hawaiian and other Pacific Islander householders: $1,319,000Some other race householders: $921,284Two or more races householders: $890,390Hispanic or Latino householders: $901,121Estimated median house or condo value in 2022: $887,138
95122:
$887,138California:
$715,900
Lower value quartile - upper value quartile: $690,462 - $1,038,293
Mean price in 2022: Detached houses: $926,947Here:
$926,947State:
$988,808
Townhouses or other attached units: $837,772Here:
$837,772State:
$838,546
In 3-to-4-unit structures: $231,481Here:
$231,481State:
$824,253
In 5-or-more-unit structures: $861,520Here:
$861,520State:
$730,996
Mobile homes: $276,161Here:
$276,161State:
$184,506
Housing units in structures:
One, detached: 7,309One, attached: 1,372Two: 713 or 4: 1,1285 to 9: 44410 to 19: 52420 to 49: 27850 or more: 1,151Mobile homes: 383Boats, RVs, vans, etc.: 21Unemployment : 6.3%
Means of transportation to work in zip code 95122 67.2% 16,637 Drove a car alone18.8% 4,654 Carpooled1.3% 329 Bus or trolley bus0.1% 33 Streetcar or trolley car0.1% 26 Subway or elevated0.1% 21 Railroad0.2% 48 Taxi0.4% 88 Motorcycle0.2% 43 Bicycle1.3% 328 Walked1.4% 345 Other means7.4% 1,836 Worked at homeTravel time to work (commute) in zip code 95122 65 Less than 5 minutes770 5 to 9 minutes1,875 10 to 14 minutes3,811 15 to 19 minutes4,636 20 to 24 minutes1,712 25 to 29 minutes4,872 30 to 34 minutes577 35 to 39 minutes768 40 to 44 minutes1,316 45 to 59 minutes1,345 60 to 89 minutes577 90 or more minutes
Neighborhoods in zip code 95122: Percentage of zip code residents living and working in this county: 87.0%
Household type by relationship:
Households: 52,118
Male householders: 6,501 (655 living alone ), Female householders: 5,718 (802 living alone )6,126 spouses (6,068 opposite-sex spouses ), 1,139 unmarried partners , (1,131 opposite-sex unmarried partners ), 16,328 children (15,875 natural , 120 adopted , 336 stepchildren ), 2,792 grandchildren , 2,444 brothers or sisters , 3,035 parents , 35 foster children , 3,377 other relatives , 3,878 non-relatives In group quarters: 337 (-1 institutionalized population )
Size of family households: 1,638 2-persons , 1,783 3-persons , 2,174 4-persons , 1,801 5-persons , 973 6-persons , 1,510 7-or-more-persons
Size of nonfamily households: 1,458 1-person , 388 2-persons , 115 3-persons , 60 4-persons , 152 5-persons , 10 6-persons , 35 7-or-more-persons
5,512 married couples with children. single-parent households (772 men , 2,360 women ).
20.3% of residents of 95122 zip code speak English at home. of residents speak Spanish at home (53% very well, 18% well, 22% not well, 7% not at all ).of residents speak other Indo-European language at home (62% very well, 23% well, 10% not well, 5% not at all ).of residents speak Asian or Pacific Island language at home (37% very well, 24% well, 30% not well, 9% not at all ).of residents speak other language at home (74% very well, 11% well, 9% not well, 5% not at all ).
Foreign born population: 26,720 (51.3%)
(54.0%
of them are naturalized citizens )
This zip code:
51.3%Whole state:
26.7%
41% Honduras 33% Thailand 10% Malaysia 3% Costa Rica 1% Burma (Myanmar) 1% Mexico 1% Bhutan 1% Portuguese 0% Ukrainian 0% American 0% German 0% Iranian 0% English 0% Italian
Year of entry for the foreign-born population
6,867 2010 or later 6,656 2000 to 2009 6,703 1990 to 1999 7,775 Before 1990
There are
212 Medical Specialists in Zip Code 95122 .
Major facilities with environmental interests located in this zip code:
JENNINGS TECHNOLOGY CORPORATION (970 MCLAUGHLIN AVE. in SAN JOSE, CA)
AIR SYNTHETIC MINOR (AIRS/AFS) SUPERFUND (Superfund database) STATE MASTER (California - Hazardous Waste Tracking) - HAZARDOU WASTE PROGRAM CRITERIA AND HAZARDOUS AIR POLLUTANT INVENTORY (Inventory of air pollution sources) National Pollutant Discharge Elimination System NON-MAJOR (Tracking pollutant discharge elimination systems) - permit HAZARDOUS WASTE BIENNIAL REPORTER (Resource Conservation and Recovery Act (tracking hazardous waste)) Large Quantity Generators, more that 1000 kg of hazardous waste/month (Resource Conservation and Recovery Act (tracking hazardous waste)) TSD (Resource Conservation and Recovery Act (tracking hazardous waste)) TRI REPORTER (Tracking of toxic chemicals releasing facilities) Business SIC classification: ELECTRICAL MACHINERY, EQUIPMENT, AND SUPPLIESBusiness NAICS classification: POWER, DISTRIBUTION, AND SPECIALTY TRANSFORMER MANUFACTURING.Organizations: DANAHER CORP (CONTACT/OPERATOR)
Alternative names: ITT JENNINGS, JENNINGS A DIV OF FL IND INC, JENNINGS TECHNOLOGY COMPANY LLC, JENNINGS TECH. L.L.C., LSI JENNINGS
EXXON SERVICE STATION RAS 73704 (1610 TULLY ROAD in SAN JOSE, CA)
STATE MASTER (California - Hazardous Waste Tracking) - HAZARDOU WASTE PROGRAM Small Quantity Generators, between 100 kg and 1000 kg of hazardous waste/month (Resource Conservation and Recovery Act (tracking hazardous waste)) - notification Organizations: EXXON MOBIL (CONTACT/OWNER)
Alternative names: EXXON MOBIL CORPORATION #737040, EXXON RAS NO 73704, EXXON SERVICE STATION NO 7-3704
EQUILON ENTERPRISES (1698 TULLY RD/KING in SAN JOSE, CA)
STATE MASTER (California - Hazardous Waste Tracking) - HAZARDOU WASTE PROGRAM Small Quantity Generators, between 100 kg and 1000 kg of hazardous waste/month (Resource Conservation and Recovery Act (tracking hazardous waste)) - notification Organizations: EQUILON ENTERPRISES L L C (CONTACT/OWNER)
Alternative names: SHELL OIL CO
CHEVRON STATION NO 92780 (1151 TULLY RD in SAN JOSE, CA)
STATE MASTER (California - Hazardous Waste Tracking) - HAZARDOU WASTE PROGRAM Small Quantity Generators, between 100 kg and 1000 kg of hazardous waste/month (Resource Conservation and Recovery Act (tracking hazardous waste)) - notification Organizations: CHEVRON PRODUCTS CO (CONTACT/OWNER)
FAIR (J. WILBUR) JUNIOR HIGH (1702 MCLAUGHLIN AVE. in SAN JOSE, CA)
(National Center for Education Statistics) - STATE ID-6047229 Organizations: FRANKLIN-MCKINLEY ELEMENTARY (SCHOOL DISTRICT)
FISCHER (CLYDE L.) MIDDLE (1720 HOPKINS DR. in SAN JOSE, CA)
(National Center for Education Statistics) - STATE ID-6046148 Organizations: ALUM ROCK UNION ELEMENTARY (SCHOOL DISTRICT)
HUBBARD (O. S.) ELEMENTARY (1745 JUNE AVE. in SAN JOSE, CA)
(National Center for Education Statistics) - STATE ID-6046270 Organizations: ALUM ROCK UNION ELEMENTARY (SCHOOL DISTRICT)
KENNEDY (ROBERT F.) ELEMENTARY (1602 LUCRETIA AVE. in SAN JOSE, CA)
(National Center for Education Statistics) - STATE ID-6067201 Organizations: FRANKLIN-MCKINLEY ELEMENTARY (SCHOOL DISTRICT)
LEYVA (GEORGE V.) INTERMEDIATE (1865 MONROVIA DR. in SAN JOSE, CA)
(National Center for Education Statistics) - STATE ID-6085690 Organizations: EVERGREEN ELEMENTARY (SCHOOL DISTRICT)
MEADOWS (JEANNE R.) ELEMENTARY (1250 TAPER LANE in SAN JOSE, CA)
(National Center for Education Statistics) - STATE ID-6109433 Organizations: FRANKLIN-MCKINLEY ELEMENTARY (SCHOOL DISTRICT)
MEYER (DONALD J.) ELEMENTARY (1824 DAYTONA DR. in SAN JOSE, CA)
(National Center for Education Statistics) - STATE ID-6046155 Organizations: ALUM ROCK UNION ELEMENTARY (SCHOOL DISTRICT)
MILLER (GRANDIN) ELEMENTARY (1250 S. KING ROAD in SAN JOSE, CA)
(National Center for Education Statistics) - STATE ID-6046163 Organizations: ALUM ROCK UNION ELEMENTARY (SCHOOL DISTRICT)
CASSELL (SYLVIA) ELEMENTARY (1300 TALLAHASSEE DR. in SAN JOSE, CA)
(National Center for Education Statistics) - STATE ID-6046312 Organizations: ALUM ROCK UNION ELEMENTARY (SCHOOL DISTRICT)
Housing units lacking complete plumbing facilities: 0.2%
Housing units lacking complete kitchen facilities: 1.5%
51.7% Utility gas 40.4% Electricity 3.8% No fuel used 1.9% Bottled, tank, or LP gas 1.8% Solar energy
Population in 1990: 52,543. Population change in the 1990s: +7,279 (+13.9%).
Place of birth for U.S.-born residents:
This state: 22,865Northeast: 44Midwest: 281South: 836West: 480
61% of the 95122 zip code residents lived in the same house 5 years ago.
Out of people who lived in different houses, 80% lived in this county.
Out of people who lived in different counties, 50% lived in California.
94% of the 95122 zip code residents lived in the same house 1 year ago.
Out of people who lived in different houses, 73% moved from this county.
Out of people who lived in different houses, 13% moved from different county within same state.
Out of people who lived in different houses, 3% moved from different state.
Out of people who lived in different houses, 15% moved from abroad.
Private vs. public school enrollment:
Students in private schools in grades 1 to 8 (elementary and middle school): 375
Here:
6.4%California:
10.5%
Students in private schools in grades 9 to 12 (high school): 80
Students in private undergraduate colleges: 314
Here:
8.3%California:
15.9%
Occupation by median earnings in the past 12 months ($)
109,418 Legal occupations 105,614 Life, physical, and social science occupations 84,825 Business and financial operations occupations 84,296 Health diagnosing and treating practitioners and other technical occupations 83,079 Architecture and engineering occupations 82,231 Computer and mathematical occupations
Companies with federal contracts located in this zip code:
CRISIS COMPUTER CORPORATION (2298 QUIMBY RD in SAN JOSE, CA; small business)
$46,800 with Air Force for ADP Input/Output and Storage Devices. Signed on 2001-05-24. Completion date: 2001-06-30.
SUMMIT MICRO DESIGN (1430 TULLY ROAD in SAN JOSE, CA; small business)
$41,568 with Department of Defense for ADP Input/Output and Storage Devices. Signed on 1999-10-25. Completion date: 2000-01-25.
Top industries in this zip code by the number of employees in 2005:
Accommodation and Food Services: Cafeterias (500-999 employees: 1 establishment)Administrative and Support and Waste Management and Remediation Services: Employment Placement Agencies (500-999: 1)Accommodation and Food Services: Full-Service Restaurants (50-99: 3, 20-49: 9, 10-19: 6, 5-9: 13, 1-4: 18)Accommodation and Food Services: Limited-Service Restaurants (50-99: 2, 20-49: 11, 10-19: 7, 5-9: 7, 1-4: 18)Construction: Plumbing, Heating, and Air-Conditioning Contractors (100-249: 1, 10-19: 2, 5-9: 1)Health Care and Social Assistance: Offices of Dentists (10-19: 3, 5-9: 13, 1-4: 22)
People in group quarters in 2010:
102 people in group homes intended for adults
32 people in other noninstitutional facilities
18 people in workers' group living quarters and job corps centers
16 people in residential treatment centers for adults
6 people in group homes for juveniles (non-correctional)
People in group quarters in 2000:
133 people in other noninstitutional group quarters
39 people in other types of correctional institutions
14 people in other group homes
3 people in religious group quarters
Fatal accident statistics in 2014:
Fatal accident count: 5Vehicles involved in fatal accidents: 6Fatal accidents caused by drunken drivers: 1Fatalities: 5Persons involved in fatal accidents: 8Pedestrians involved in fatal accidents: 5
Fatal accident statistics in 2013:
Fatal accident count: 1Vehicles involved in fatal accidents: 1Fatal accidents caused by drunken drivers: 1Fatalities: 1Persons involved in fatal accidents: 3Pedestrians involved in fatal accidents: 1
Home Mortgage Disclosure Act Aggregated Statistics For Year 2009(Based on 13 full and 8 partial tracts) A) FHA, FSA/RHS & VA B) Conventional C) Refinancings D) Home Improvement Loans E) Loans on Dwellings For 5+ Families F) Non-occupant Loans on G) Loans On Manufactured Number Average Value Number Average Value Number Average Value Number Average Value Number Average Value Number Average Value Number Average Value
LOANS ORIGINATED 186 $265,439 604 $221,458 522 $235,650 21 $159,195 4 $7,920,040 173 $196,086 12 $69,384 APPLICATIONS APPROVED, NOT ACCEPTED 18 $258,749 117 $227,297 71 $243,750 4 $85,105 0 $0 28 $187,104 4 $55,525 APPLICATIONS DENIED 83 $267,179 207 $212,079 350 $278,281 31 $80,959 0 $0 98 $198,558 15 $55,996 APPLICATIONS WITHDRAWN 63 $287,605 118 $224,865 143 $265,476 16 $77,366 0 $0 33 $240,831 2 $41,840 FILES CLOSED FOR INCOMPLETENESS 15 $287,288 22 $258,439 55 $299,525 4 $154,895 0 $0 5 $169,036 0 $0
Aggregated Statistics For Year 2008(Based on 13 full and 8 partial tracts) A) FHA, FSA/RHS & VA B) Conventional C) Refinancings D) Home Improvement Loans E) Loans on Dwellings For 5+ Families F) Non-occupant Loans on G) Loans On Manufactured Number Average Value Number Average Value Number Average Value Number Average Value Number Average Value Number Average Value Number Average Value
LOANS ORIGINATED 46 $303,709 527 $270,041 464 $288,021 47 $224,776 3 $17,750,400 139 $258,175 22 $56,700 APPLICATIONS APPROVED, NOT ACCEPTED 5 $284,160 147 $260,305 158 $294,257 18 $299,891 0 $0 20 $253,778 37 $85,025 APPLICATIONS DENIED 39 $334,645 347 $271,385 707 $366,527 78 $225,501 1 $400,000 72 $291,796 61 $77,185 APPLICATIONS WITHDRAWN 19 $303,539 143 $269,323 188 $316,851 20 $205,346 0 $0 31 $280,175 2 $94,400 FILES CLOSED FOR INCOMPLETENESS 4 $236,160 52 $334,098 124 $338,037 13 $257,849 0 $0 13 $302,915 0 $0
Aggregated Statistics For Year 2007(Based on 13 full and 8 partial tracts) B) Conventional C) Refinancings D) Home Improvement Loans F) Non-occupant Loans on G) Loans On Manufactured Number Average Value Number Average Value Number Average Value Number Average Value Number Average Value
LOANS ORIGINATED 451 $347,641 1,642 $371,321 244 $319,587 208 $369,031 23 $61,970 APPLICATIONS APPROVED, NOT ACCEPTED 229 $352,445 599 $376,729 49 $260,521 56 $386,526 21 $79,015 APPLICATIONS DENIED 497 $355,852 1,506 $414,560 189 $249,827 95 $415,883 56 $80,424 APPLICATIONS WITHDRAWN 131 $352,239 421 $398,111 47 $347,499 46 $349,124 2 $84,465 FILES CLOSED FOR INCOMPLETENESS 49 $370,480 219 $431,467 21 $364,790 14 $337,548 0 $0
Aggregated Statistics For Year 2006(Based on 13 full and 8 partial tracts) A) FHA, FSA/RHS & VA B) Conventional C) Refinancings D) Home Improvement Loans E) Loans on Dwellings For 5+ Families F) Non-occupant Loans on G) Loans On Manufactured Number Average Value Number Average Value Number Average Value Number Average Value Number Average Value Number Average Value Number Average Value
LOANS ORIGINATED 4 $285,258 1,317 $335,726 2,418 $371,600 399 $329,894 3 $28,112,643 301 $358,355 14 $45,614 APPLICATIONS APPROVED, NOT ACCEPTED 0 $0 349 $328,760 684 $384,802 88 $352,715 2 $32,415,500 96 $356,435 13 $46,735 APPLICATIONS DENIED 0 $0 743 $324,843 1,435 $402,150 221 $297,200 4 $370,980 142 $395,111 38 $70,227 APPLICATIONS WITHDRAWN 0 $0 313 $344,887 726 $388,666 66 $330,520 0 $0 72 $340,755 2 $47,420 FILES CLOSED FOR INCOMPLETENESS 0 $0 76 $348,439 220 $387,192 38 $391,803 0 $0 19 $354,667 0 $0
Aggregated Statistics For Year 2005(Based on 13 full and 8 partial tracts) B) Conventional C) Refinancings D) Home Improvement Loans E) Loans on Dwellings For 5+ Families F) Non-occupant Loans on G) Loans On Manufactured Number Average Value Number Average Value Number Average Value Number Average Value Number Average Value Number Average Value
LOANS ORIGINATED 1,947 $319,395 2,729 $350,347 342 $335,473 0 $0 344 $337,655 21 $68,393 APPLICATIONS APPROVED, NOT ACCEPTED 431 $306,785 619 $334,145 66 $280,605 1 $144,900 77 $313,234 25 $72,762 APPLICATIONS DENIED 1,018 $306,350 1,701 $363,579 254 $260,316 0 $0 147 $348,140 67 $71,494 APPLICATIONS WITHDRAWN 387 $317,295 832 $338,888 91 $239,316 0 $0 103 $315,429 2 $36,955 FILES CLOSED FOR INCOMPLETENESS 102 $329,750 335 $369,529 32 $284,290 0 $0 22 $369,538 1 $100,850
Aggregated Statistics For Year 2004(Based on 13 full and 8 partial tracts) A) FHA, FSA/RHS & VA B) Conventional C) Refinancings D) Home Improvement Loans E) Loans on Dwellings For 5+ Families F) Non-occupant Loans on G) Loans On Manufactured Number Average Value Number Average Value Number Average Value Number Average Value Number Average Value Number Average Value Number Average Value
LOANS ORIGINATED 0 $0 1,818 $266,007 2,850 $286,842 237 $217,987 6 $12,767,035 343 $279,355 17 $63,790 APPLICATIONS APPROVED, NOT ACCEPTED 0 $0 387 $272,170 671 $292,324 34 $239,899 0 $0 73 $317,625 18 $62,413 APPLICATIONS DENIED 2 $127,665 654 $248,201 1,480 $296,509 206 $186,212 0 $0 170 $273,801 58 $77,340 APPLICATIONS WITHDRAWN 0 $0 327 $269,289 912 $291,474 54 $180,153 0 $0 55 $288,393 4 $61,192 FILES CLOSED FOR INCOMPLETENESS 0 $0 65 $329,728 255 $299,950 17 $238,819 0 $0 32 $290,761 0 $0
Aggregated Statistics For Year 2003(Based on 13 full and 8 partial tracts) A) FHA, FSA/RHS & VA B) Conventional C) Refinancings D) Home Improvement Loans E) Loans on Dwellings For 5+ Families F) Non-occupant Loans on Number Average Value Number Average Value Number Average Value Number Average Value Number Average Value Number Average Value
LOANS ORIGINATED 0 $0 1,237 $237,635 4,661 $234,149 73 $68,761 1 $811,440 535 $237,919 APPLICATIONS APPROVED, NOT ACCEPTED 2 $58,945 214 $267,714 1,077 $259,804 36 $63,569 0 $0 125 $269,039 APPLICATIONS DENIED 0 $0 427 $205,201 1,696 $259,904 89 $50,420 0 $0 184 $271,072 APPLICATIONS WITHDRAWN 0 $0 161 $253,405 1,258 $249,275 17 $93,522 0 $0 81 $252,085 FILES CLOSED FOR INCOMPLETENESS 0 $0 32 $283,242 301 $252,707 5 $54,000 0 $0 31 $285,233
Aggregated Statistics For Year 2002(Based on 5 full and 6 partial tracts) A) FHA, FSA/RHS & VA B) Conventional C) Refinancings D) Home Improvement Loans E) Loans on Dwellings For 5+ Families F) Non-occupant Loans on Number Average Value Number Average Value Number Average Value Number Average Value Number Average Value Number Average Value
LOANS ORIGINATED 14 $138,384 624 $207,942 1,914 $221,770 44 $53,720 2 $19,748,520 215 $211,400 APPLICATIONS APPROVED, NOT ACCEPTED 3 $82,657 95 $212,457 485 $232,593 7 $98,689 0 $0 39 $215,935 APPLICATIONS DENIED 5 $146,930 226 $187,274 662 $254,228 48 $29,829 0 $0 61 $212,376 APPLICATIONS WITHDRAWN 0 $0 112 $206,532 529 $236,982 16 $42,478 0 $0 27 $152,633 FILES CLOSED FOR INCOMPLETENESS 0 $0 32 $234,921 205 $250,791 2 $59,845 0 $0 15 $212,107
Aggregated Statistics For Year 2001(Based on 5 full and 6 partial tracts) A) FHA, FSA/RHS & VA B) Conventional C) Refinancings D) Home Improvement Loans E) Loans on Dwellings For 5+ Families F) Non-occupant Loans on Number Average Value Number Average Value Number Average Value Number Average Value Number Average Value Number Average Value
LOANS ORIGINATED 2 $184,520 517 $219,467 1,760 $218,695 118 $50,505 3 $373,973 185 $205,999 APPLICATIONS APPROVED, NOT ACCEPTED 0 $0 99 $193,463 360 $209,470 23 $64,538 0 $0 30 $181,067 APPLICATIONS DENIED 0 $0 230 $179,459 622 $218,850 102 $59,717 0 $0 48 $191,488 APPLICATIONS WITHDRAWN 0 $0 85 $209,022 510 $211,392 30 $39,290 0 $0 31 $217,621 FILES CLOSED FOR INCOMPLETENESS 0 $0 16 $290,542 227 $228,853 6 $26,867 0 $0 7 $222,694
Aggregated Statistics For Year 2000(Based on 5 full and 6 partial tracts) A) FHA, FSA/RHS & VA B) Conventional C) Refinancings D) Home Improvement Loans E) Loans on Dwellings For 5+ Families F) Non-occupant Loans on Number Average Value Number Average Value Number Average Value Number Average Value Number Average Value Number Average Value
LOANS ORIGINATED 12 $181,077 625 $194,198 630 $174,718 127 $42,744 0 $0 92 $165,737 APPLICATIONS APPROVED, NOT ACCEPTED 2 $75,800 110 $187,568 170 $159,986 35 $68,232 0 $0 13 $151,918 APPLICATIONS DENIED 6 $147,930 259 $173,589 284 $155,509 83 $34,566 2 $335,125 20 $170,456 APPLICATIONS WITHDRAWN 1 $147,000 80 $178,562 240 $146,078 10 $49,659 0 $0 20 $154,706 FILES CLOSED FOR INCOMPLETENESS 0 $0 34 $205,359 207 $182,809 4 $64,830 0 $0 8 $193,455
Aggregated Statistics For Year 1999(Based on 4 full and 6 partial tracts) A) FHA, FSA/RHS & VA B) Conventional C) Refinancings D) Home Improvement Loans E) Loans on Dwellings For 5+ Families F) Non-occupant Loans on Number Average Value Number Average Value Number Average Value Number Average Value Number Average Value Number Average Value
LOANS ORIGINATED 17 $135,096 696 $172,551 1,110 $149,600 140 $24,455 4 $6,754,098 161 $137,607 APPLICATIONS APPROVED, NOT ACCEPTED 0 $0 106 $147,307 239 $143,684 32 $37,902 0 $0 21 $113,958 APPLICATIONS DENIED 7 $157,006 166 $159,325 457 $144,269 101 $25,356 1 $124,880 54 $125,099 APPLICATIONS WITHDRAWN 3 $94,497 157 $173,021 427 $140,096 12 $37,204 0 $0 22 $120,367 FILES CLOSED FOR INCOMPLETENESS 0 $0 37 $177,728 282 $153,094 1 $53,660 0 $0 14 $153,214
Private Mortgage Insurance Companies Aggregated Statistics For Year 2009(Based on 13 full and 8 partial tracts) A) Conventional B) Refinancings Number Average Value Number Average Value
LOANS ORIGINATED 88 $264,275 10 $262,175 APPLICATIONS APPROVED, NOT ACCEPTED 76 $284,440 9 $330,579 APPLICATIONS DENIED 9 $272,183 2 $365,490 APPLICATIONS WITHDRAWN 16 $278,615 4 $371,252 FILES CLOSED FOR INCOMPLETENESS 4 $372,270 0 $0
Aggregated Statistics For Year 2008(Based on 13 full and 8 partial tracts) A) Conventional B) Refinancings C) Non-occupant Loans on Number Average Value Number Average Value Number Average Value
LOANS ORIGINATED 138 $328,656 23 $451,067 1 $296,000 APPLICATIONS APPROVED, NOT ACCEPTED 55 $351,415 26 $475,443 1 $323,000 APPLICATIONS DENIED 25 $334,939 3 $445,443 3 $379,750 APPLICATIONS WITHDRAWN 19 $333,436 1 $621,000 0 $0 FILES CLOSED FOR INCOMPLETENESS 1 $315,000 5 $507,262 0 $0
Aggregated Statistics For Year 2007(Based on 13 full and 6 partial tracts) A) Conventional B) Refinancings C) Non-occupant Loans on Number Average Value Number Average Value Number Average Value
LOANS ORIGINATED 22 $511,690 37 $551,990 2 $641,930 APPLICATIONS APPROVED, NOT ACCEPTED 6 $596,640 20 $518,200 0 $0 APPLICATIONS DENIED 4 $535,565 7 $554,870 2 $516,970 APPLICATIONS WITHDRAWN 4 $373,028 6 $580,460 0 $0 FILES CLOSED FOR INCOMPLETENESS 0 $0 5 $566,092 0 $0
Aggregated Statistics For Year 2006(Based on 11 full and 6 partial tracts) A) Conventional B) Refinancings C) Non-occupant Loans on Number Average Value Number Average Value Number Average Value
LOANS ORIGINATED 13 $571,406 18 $530,271 0 $0 APPLICATIONS APPROVED, NOT ACCEPTED 0 $0 4 $565,025 0 $0 APPLICATIONS DENIED 0 $0 5 $561,342 1 $577,840 APPLICATIONS WITHDRAWN 0 $0 0 $0 0 $0 FILES CLOSED FOR INCOMPLETENESS 0 $0 0 $0 0 $0
Aggregated Statistics For Year 2005(Based on 13 full and 8 partial tracts) A) Conventional B) Refinancings C) Non-occupant Loans on Number Average Value Number Average Value Number Average Value
LOANS ORIGINATED 27 $408,780 40 $441,881 3 $332,773 APPLICATIONS APPROVED, NOT ACCEPTED 4 $399,400 18 $393,853 0 $0 APPLICATIONS DENIED 0 $0 2 $438,970 0 $0 APPLICATIONS WITHDRAWN 2 $614,160 17 $331,999 2 $614,160 FILES CLOSED FOR INCOMPLETENESS 0 $0 1 $433,000 0 $0
Aggregated Statistics For Year 2004(Based on 13 full and 8 partial tracts) A) Conventional B) Refinancings C) Non-occupant Loans on Number Average Value Number Average Value Number Average Value
LOANS ORIGINATED 30 $335,863 45 $380,704 0 $0 APPLICATIONS APPROVED, NOT ACCEPTED 18 $303,411 12 $354,859 10 $344,186 APPLICATIONS DENIED 0 $0 0 $0 0 $0 APPLICATIONS WITHDRAWN 1 $314,000 0 $0 0 $0 FILES CLOSED FOR INCOMPLETENESS 0 $0 0 $0 0 $0
Aggregated Statistics For Year 2003(Based on 13 full and 8 partial tracts) A) Conventional B) Refinancings C) Non-occupant Loans on Number Average Value Number Average Value Number Average Value
LOANS ORIGINATED 59 $298,166 56 $315,126 2 $219,430 APPLICATIONS APPROVED, NOT ACCEPTED 7 $273,259 29 $328,487 0 $0 APPLICATIONS DENIED 0 $0 1 $272,000 0 $0 APPLICATIONS WITHDRAWN 0 $0 9 $270,568 0 $0 FILES CLOSED FOR INCOMPLETENESS 0 $0 2 $402,950 0 $0
Aggregated Statistics For Year 2002(Based on 5 full and 6 partial tracts) A) Conventional B) Refinancings C) Non-occupant Loans on Number Average Value Number Average Value Number Average Value
LOANS ORIGINATED 44 $287,551 13 $266,558 4 $185,525 APPLICATIONS APPROVED, NOT ACCEPTED 15 $314,226 17 $254,194 3 $168,777 APPLICATIONS DENIED 1 $405,000 0 $0 0 $0 APPLICATIONS WITHDRAWN 0 $0 2 $222,420 0 $0 FILES CLOSED FOR INCOMPLETENESS 0 $0 0 $0 0 $0
Aggregated Statistics For Year 2001(Based on 5 full and 6 partial tracts) A) Conventional B) Refinancings C) Non-occupant Loans on Number Average Value Number Average Value Number Average Value
LOANS ORIGINATED 126 $319,043 23 $266,270 0 $0 APPLICATIONS APPROVED, NOT ACCEPTED 19 $321,095 16 $244,928 2 $357,730 APPLICATIONS DENIED 4 $323,450 2 $215,440 0 $0 APPLICATIONS WITHDRAWN 0 $0 0 $0 0 $0 FILES CLOSED FOR INCOMPLETENESS 0 $0 0 $0 0 $0
Aggregated Statistics For Year 2000(Based on 5 full and 6 partial tracts) A) Conventional B) Refinancings C) Non-occupant Loans on Number Average Value Number Average Value Number Average Value
LOANS ORIGINATED 157 $247,423 51 $187,547 9 $171,346 APPLICATIONS APPROVED, NOT ACCEPTED 24 $225,665 6 $176,328 3 $170,190 APPLICATIONS DENIED 5 $267,522 0 $0 0 $0 APPLICATIONS WITHDRAWN 7 $156,750 2 $223,585 2 $223,585 FILES CLOSED FOR INCOMPLETENESS 1 $218,000 0 $0 0 $0
Aggregated Statistics For Year 1999(Based on 4 full and 6 partial tracts) A) Conventional B) Refinancings C) Non-occupant Loans on Number Average Value Number Average Value Number Average Value
LOANS ORIGINATED 260 $212,492 43 $194,797 5 $151,614 APPLICATIONS APPROVED, NOT ACCEPTED 24 $186,492 15 $169,543 1 $91,920 APPLICATIONS DENIED 13 $202,412 7 $198,333 3 $188,040 APPLICATIONS WITHDRAWN 7 $173,480 1 $165,650 0 $0 FILES CLOSED FOR INCOMPLETENESS 3 $205,460 2 $121,560 0 $0
2007 - 2017 National Fire Incident Reporting System (NFIRS) incidents See full 2006 National Fire Incident Reporting System statistics for zip code 95122, California
Most common first names in zip code 95122 among deceased individuals Name Count Lived (average)
Maria 94 75.4 years Jose 68 67.9 years John 61 67.1 years Mary 48 68.3 years William 47 71.1 years James 43 64.8 years Manuel 42 74.0 years Frank 40 72.2 years Robert 36 62.1 years Joseph 34 66.2 years
Most common last names in zip code 95122 among deceased individuals Last name Count Lived (average)
Nguyen 101 70.5 years Garcia 53 67.9 years Martinez 44 68.0 years Tran 42 72.0 years Lopez 39 64.8 years Rodriguez 38 67.8 years Hernandez 38 72.1 years Ramirez 31 66.6 years Gonzales 29 63.5 years Perez 29 67.4 years
Businesses in zip code 95122
Name Count Name Count
7-Eleven 2 KFC 2 AT&T 3 Kroger 2 Aeropostale 1 Lane Furniture 1 AutoZone 1 LensCrafters 1 Bakers 1 Little Caesars Pizza 1 Barnes & Noble 1 Macy's 1 Bath & Body Works 1 McDonald's 4 Bed Bath & Beyond 1 Motherhood Maternity 2 Best Western 1 New Balance 2 Burger King 1 New York & Co 1 CVS 1 Nike 14 Carl\s Jr. 1 Old Navy 1 Charlotte Russe 1 Panda Express 1 Cinnabon 1 Payless 3 Dennys 1 RadioShack 1 Domino's Pizza 1 Red Robin 1 El Pollo Loco 1 SAS Shoes 1 FedEx 3 Sears 2 Finish Line 1 Sephora 1 Firestone Complete Auto Care 1 Sprint Nextel 2 Forever 21 1 Starbucks 4 Fredericks Of Hollywood 1 Subway 2 GNC 1 T-Mobile 7 GameStop 2 Taco Bell 2 H&R Block 1 Target 1 Hollister Co. 1 UPS 1 Hot Topic 1 Vans 5 JCPenney 1 Verizon Wireless 4 Jamba Juice 1 Victoria's Secret 1 Jones New York 1 Walgreens 1 Journeys 1 Walmart 1

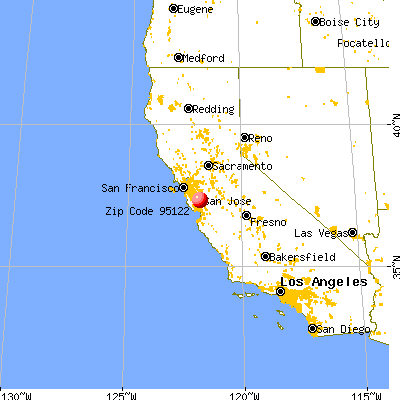


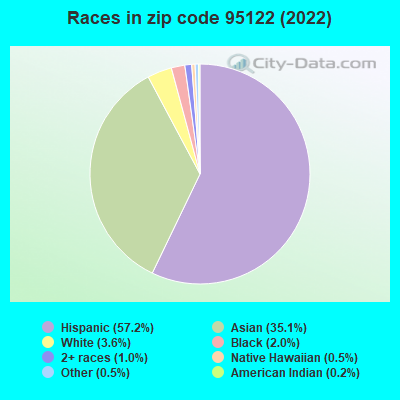


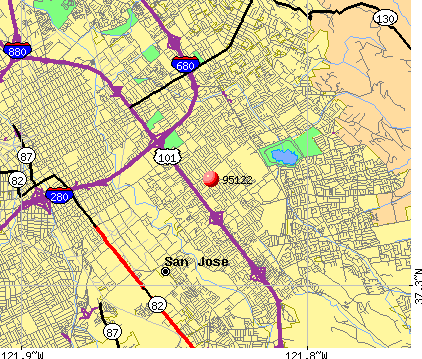 Nearest zip codes: 95116, 95121, 95111, 95133, 95112, 95127.
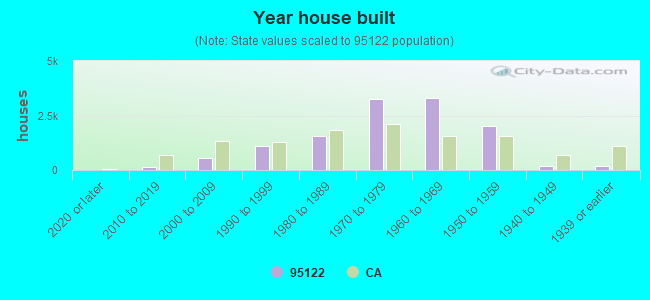

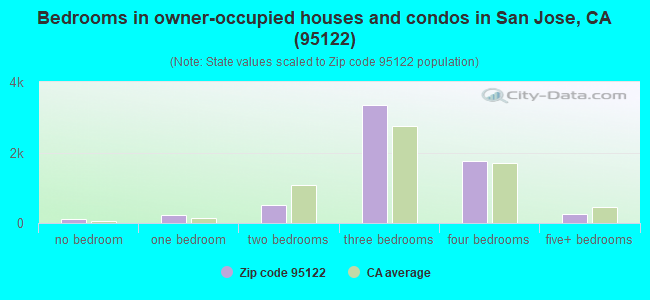
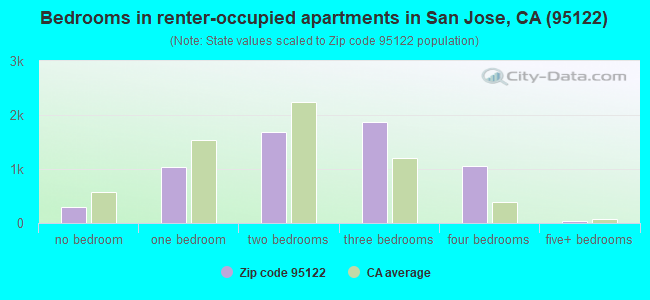
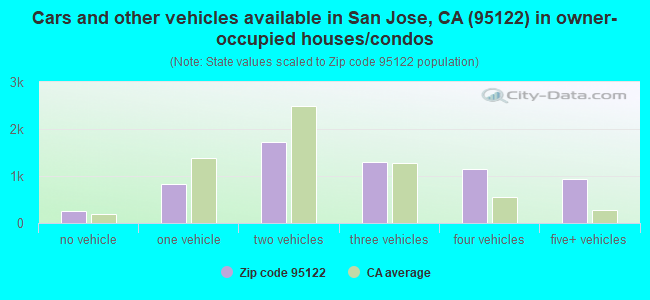
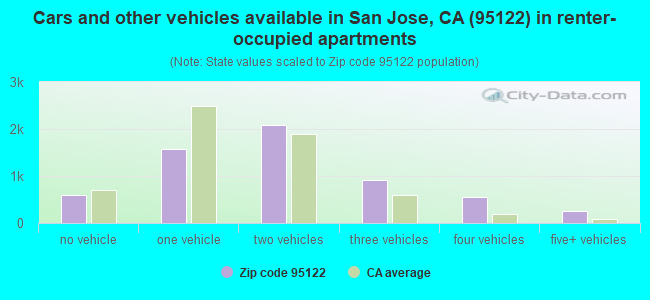


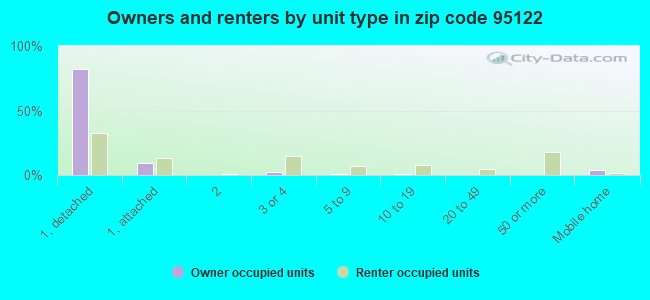
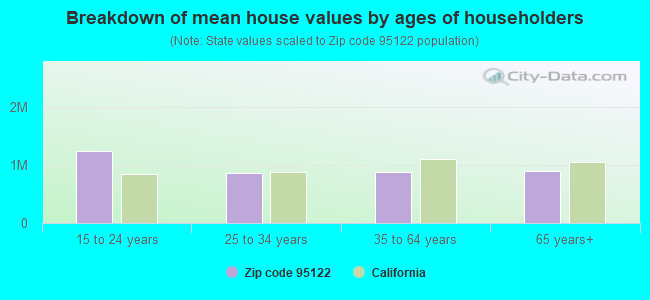


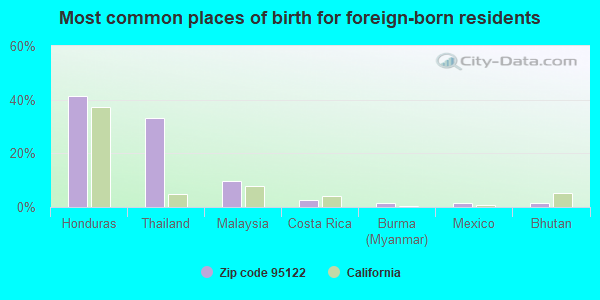
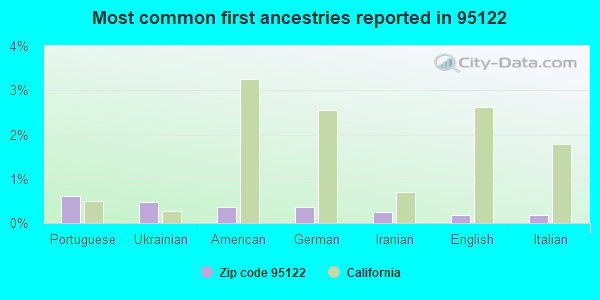
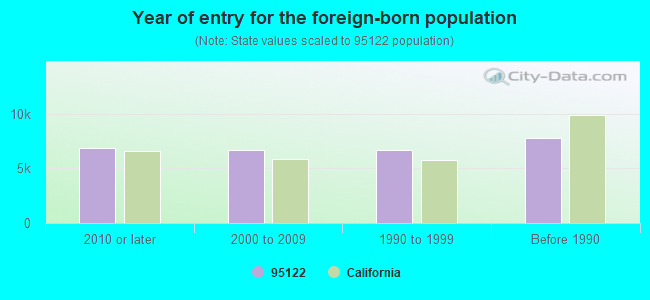


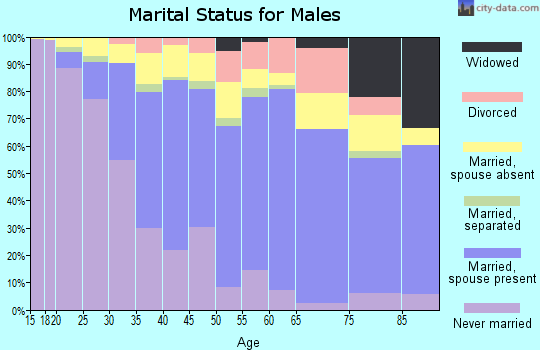
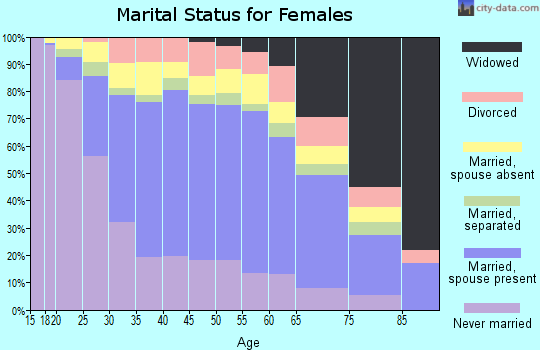
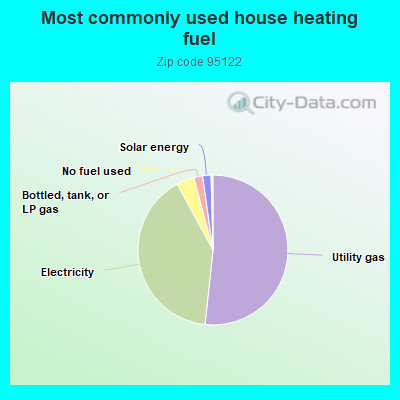
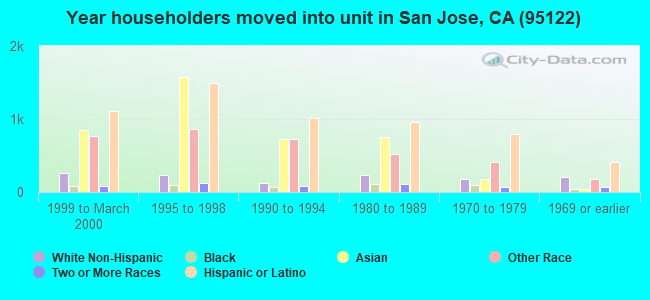
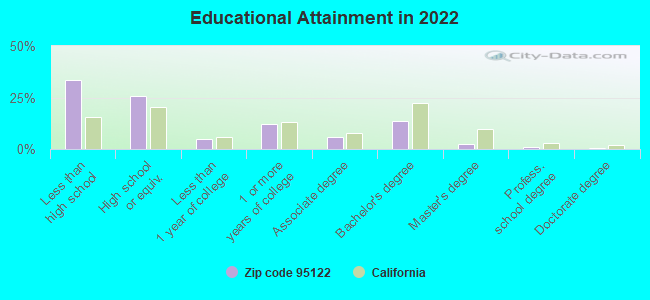
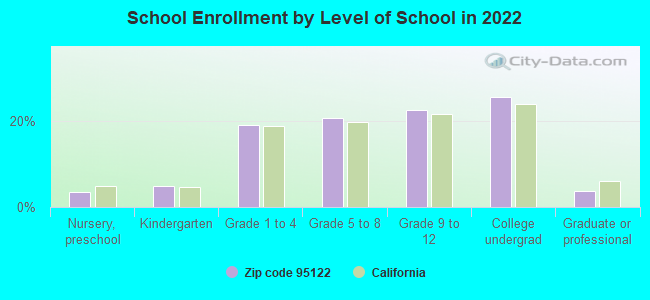
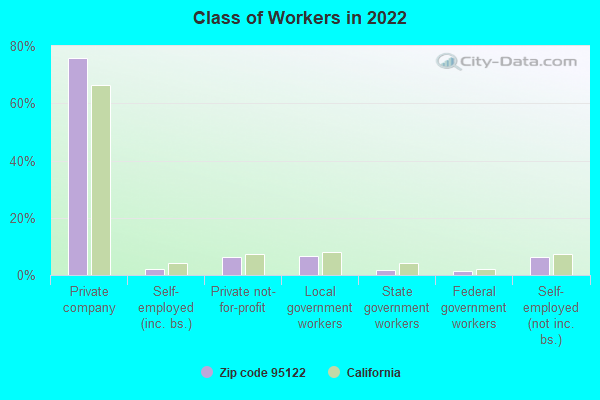
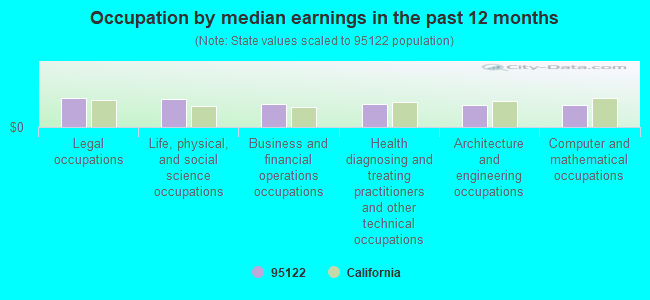
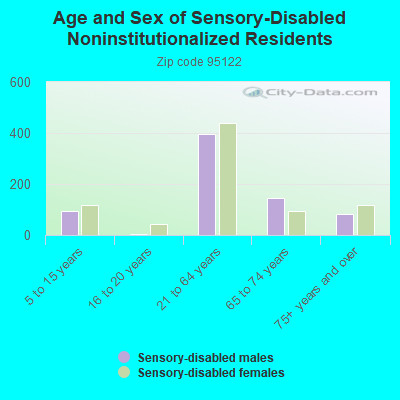
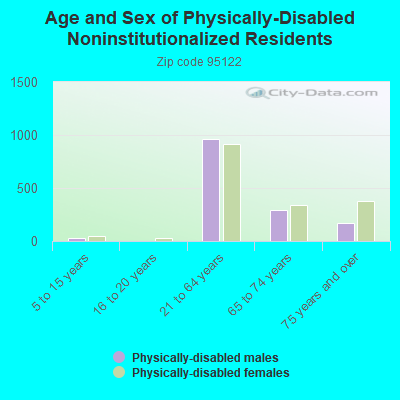
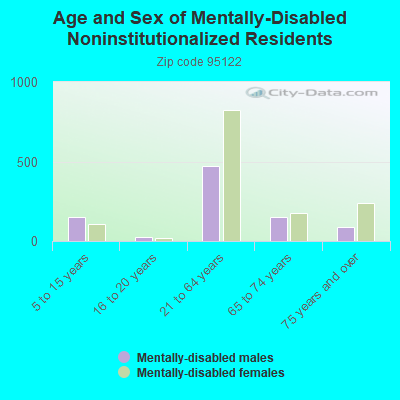
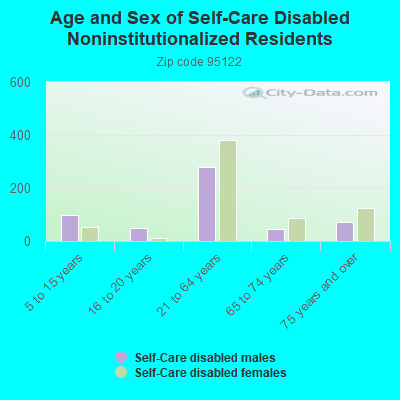
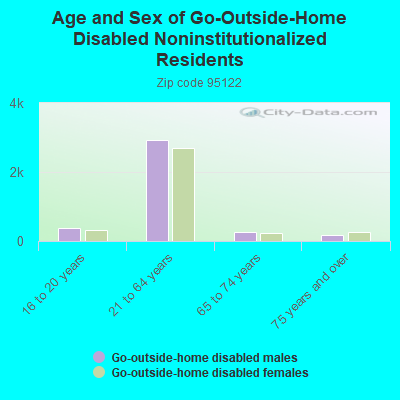
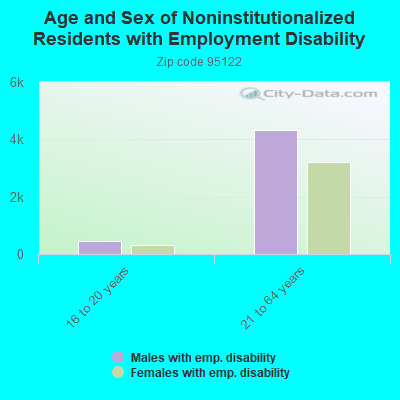
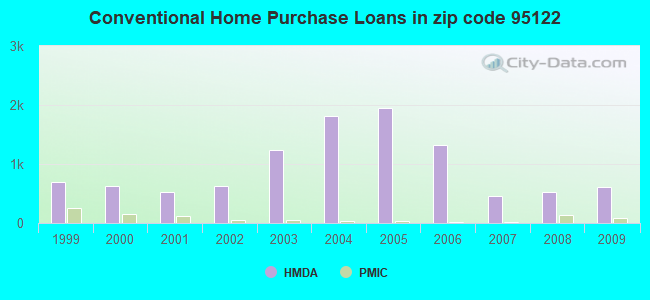
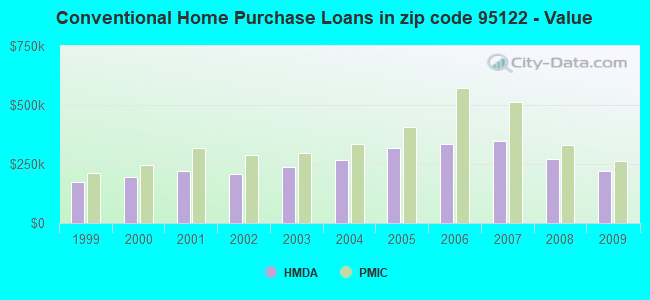
 Based on the data from the years 2007 - 2017 the average number of fire incidents per year is 38. The highest number of fire incidents - 161 took place in 2017, and the least - 0 in 2009. The data has a growing trend.
 When looking into fire subcategories, the most incidents belonged to: Outside Fires (66.4%), and Mobile Property/Vehicle Fires (16.4%).