Estimated zip code population in 2022: 59,264 Zip code population in 2010: 58,466 Zip code population in 2000: 57,735
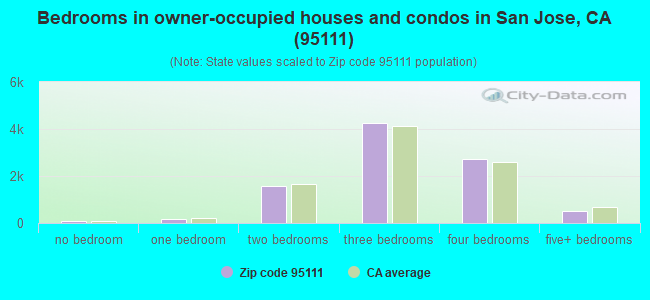
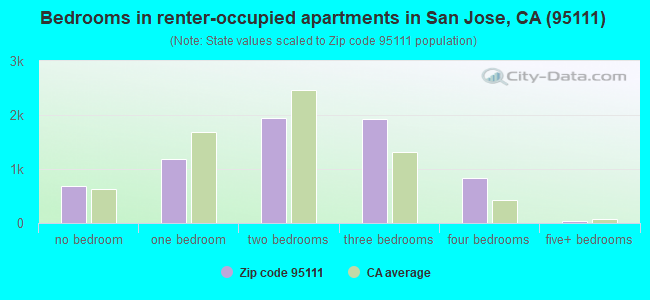
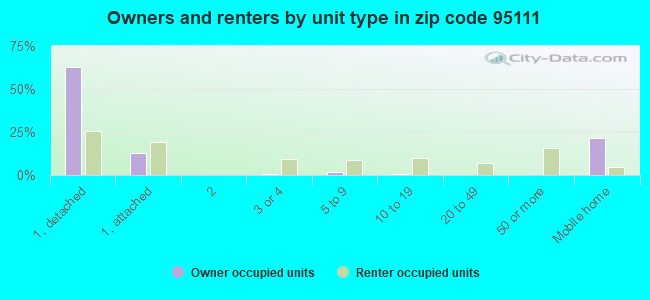
Houses and condos: 16,395 Renter-occupied apartments: 6,585
% of renters here:
41%
State:
44%
March 2022 cost of living index in zip code 95111: 122.5 (high, U.S. average is 100)
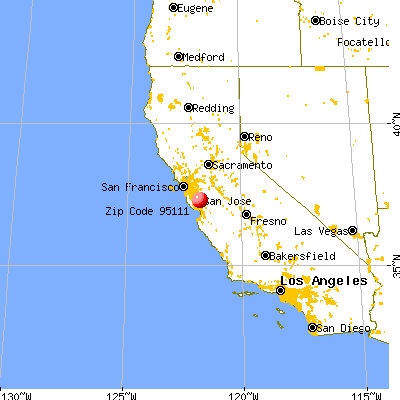
Land area: 5.4 sq. mi. Water area: 0.0 sq. mi.
Population density: 10,938 people per square mile
(high).
OSM Map
General Map
Google Map
MSN Map
OSM Map
General Map
Google Map
MSN Map
OSM Map
General Map
Google Map
MSN Map
OSM Map
General Map
Google Map
MSN Map
Please wait while loading the map...
Real estate property taxes paid for housing units in 2022:
This zip code:
0.7% ($6,374)
California:
0.7% ($4,831)
Median real estate property taxes paid for housing units with mortgages in 2022: $7,251 (0.8%) Median real estate property taxes paid for housing units with no mortgage in 2022: $4,145 (0.7%)
Averages for the 2020 tax year for zip code 95111, filed in 2021:
Average Adjusted Gross Income (AGI) in 2020: $62,334 (Individual Income Tax Returns)
Here:
$62,334
State:
$95,910
Salary/wage: $59,172 (reported on 87.2% of returns)
Here:
$59,172
State:
$77,331
(% of AGI for various income ranges: 1218.2% for AGIs below $25k, 4195.1% for AGIs $25k-50k, 7644.4% for AGIs $50k-75k, 11565.8% for AGIs $75k-100k, 21757.6% for AGIs $100k-200k, 88094.4% for AGIs over 200k)
Taxable interest for individuals: $627 (reported on 24.8% of returns)
This zip code:
$627
California:
$2,294
(% of AGI for various income ranges: 7.3% for AGIs below $25k, 9.8% for AGIs $25k-50k, 15.1% for AGIs $50k-75k, 31.1% for AGIs $75k-100k, 61.2% for AGIs $100k-200k, 372.8% for AGIs over 200k)
Ordinary dividends: $1,937 (reported on 11.6% of returns)
Here:
$1,937
State:
$10,949
(% of AGI for various income ranges: 6.1% for AGIs below $25k, 9.7% for AGIs $25k-50k, 16.2% for AGIs $50k-75k, 27.6% for AGIs $75k-100k, 110.7% for AGIs $100k-200k, 691.7% for AGIs over 200k)
Net capital gain/loss in AGI: +$12,629 (reported on 13.9% of returns)
Here:
+$12,629
State:
+$49,306
(% of AGI for various income ranges: 12.3% for AGIs below $25k, 14.4% for AGIs $25k-50k, 41.7% for AGIs $50k-75k, 104.8% for AGIs $75k-100k, 522.1% for AGIs $100k-200k, 10286.4% for AGIs over 200k)
Profit/loss from business: +$10,784 (reported on 15.0% of returns)
Here:
+$10,784
State:
+$15,671
(% of AGI for various income ranges: 170.8% for AGIs below $25k, 168.0% for AGIs $25k-50k, 188.9% for AGIs $50k-75k, 199.7% for AGIs $75k-100k, 503.1% for AGIs $100k-200k, 2285.6% for AGIs over 200k)
Taxable individual retirement arrangement distribution: $15,521 (reported on 2.7% of returns)
95111:
$15,521
California:
$23,505
(% of AGI for various income ranges: 19.9% for AGIs below $25k, 25.8% for AGIs $25k-50k, 58.4% for AGIs $50k-75k, 110.6% for AGIs $75k-100k, 196.0% for AGIs $100k-200k, 561.9% for AGIs over 200k)
Self-employed (Keogh) retirement plans: $19,620 (reported on 0.2% of returns)
95111:
$19,620
California:
$30,163
(% of AGI for various income ranges: 49.3% for AGIs $100k-200k)
Total itemized deductions: $29,095 (reported on 11.1% of returns)
Here:
$29,095
State:
$39,517
(% of AGI for various income ranges: 53.2% for AGIs below $25k, 139.1% for AGIs $25k-50k, 351.2% for AGIs $50k-75k, 805.5% for AGIs $75k-100k, 1774.2% for AGIs $100k-200k, 6415.8% for AGIs over 200k)
Charity contributions: $4,242 (reported on 8.3% of returns)
Here:
$4,242
State:
$12,598
(% of AGI for various income ranges: 1.8% for AGIs below $25k, 13.1% for AGIs $25k-50k, 28.7% for AGIs $50k-75k, 65.6% for AGIs $75k-100k, 193.3% for AGIs $100k-200k, 990.6% for AGIs over 200k)
Taxes paid: $9,108 (reported on 11.1% of returns)
95111:
$9,108
State:
$8,807
(% of AGI for various income ranges: 16.0% for AGIs below $25k, 40.3% for AGIs $25k-50k, 112.7% for AGIs $50k-75k, 273.9% for AGIs $75k-100k, 584.5% for AGIs $100k-200k, 1750.6% for AGIs over 200k)
Earned income credit: $1,956 (reported on 15.1% of returns)
Here:
$1,956
State:
$2,074
(% of AGI for various income ranges: 87.0% for AGIs below $25k, 62.8% for AGIs $25k-50k, 0.9% for AGIs $50k-75k)
Percentage of individuals using paid preparers for their 2020 taxes: 91.5%
Here:
91%
State:
92%
(% for various income ranges: 89.6% for AGIs below $25k, 91.9% for AGIs $25k-50k, 93.3% for AGIs $50k-75k, 91.7% for AGIs $75k-100k, 92.2% for AGIs $100k-200k, 93.3% for AGIs over 200k)
Averages for the 2012 tax year for zip code 95111, filed in 2013:
Average Adjusted Gross Income (AGI) in 2012: $41,341 (Individual Income Tax Returns)
Here:
$41,341
State:
$72,726
Salary/wage: $40,064 (reported on 88.5% of returns)
Here:
$40,064
State:
$59,079
(% of AGI for various income ranges: 79.4% for AGIs below $25k, 88.6% for AGIs $25k-50k, 87.8% for AGIs $50k-75k, 86.7% for AGIs $75k-100k, 88.1% for AGIs $100k-200k, 76.0% for AGIs over 200k)
Taxable interest for individuals: $372 (reported on 22.3% of returns)
This zip code:
$372
California:
$2,146
(% of AGI for various income ranges: 0.3% for AGIs below $25k, 0.2% for AGIs $25k-50k, 0.2% for AGIs $50k-75k, 0.2% for AGIs $75k-100k, 0.1% for AGIs $100k-200k, 0.3% for AGIs over 200k)
Ordinary dividends: $1,633 (reported on 7.4% of returns)
Here:
$1,633
State:
$9,308
(% of AGI for various income ranges: 0.2% for AGIs below $25k, 0.1% for AGIs $25k-50k, 0.3% for AGIs $50k-75k, 0.4% for AGIs $75k-100k, 0.3% for AGIs $100k-200k, 0.7% for AGIs over 200k)
Net capital gain/loss in AGI: +$3,011 (reported on 7.6% of returns)
Here:
+$3,011
State:
+$30,460
(% of AGI for various income ranges: 0.4% for AGIs $100k-200k, 6.2% for AGIs over 200k)
Profit/loss from business: +$12,036 (reported on 14.1% of returns)
Here:
+$12,036
State:
+$17,064
(% of AGI for various income ranges: 10.9% for AGIs below $25k, 4.2% for AGIs $25k-50k, 2.3% for AGIs $50k-75k, 1.9% for AGIs $75k-100k, 2.2% for AGIs $100k-200k, 5.0% for AGIs over 200k)
Taxable individual retirement arrangement distribution: $13,016 (reported on 3.2% of returns)
95111:
$13,016
California:
$19,557
(% of AGI for various income ranges: 0.9% for AGIs below $25k, 0.7% for AGIs $25k-50k, 1.1% for AGIs $50k-75k, 1.5% for AGIs $75k-100k, 1.1% for AGIs $100k-200k, 1.0% for AGIs over 200k)
Self-employment retirement plans: $13,667 (reported on 0.1% of returns)
95111:
$13,667
California:
$24,530
Total itemized deductions: $23,412 (27% of AGI, reported on 23.9% of returns)
Here:
$23,412
State:
$34,004
Here:
27.0% of AGI
State:
22.7% of AGI
(% of AGI for various income ranges: 5.6% for AGIs below $25k, 9.4% for AGIs $25k-50k, 14.6% for AGIs $50k-75k, 17.7% for AGIs $75k-100k, 18.9% for AGIs $100k-200k, 15.3% for AGIs over 200k)
Charity contributions: $2,014 (reported on 17.7% of returns)
Here:
$2,014
State:
$4,659
(% of AGI for various income ranges: 0.2% for AGIs below $25k, 0.5% for AGIs $25k-50k, 0.9% for AGIs $50k-75k, 1.1% for AGIs $75k-100k, 1.3% for AGIs $100k-200k, 1.2% for AGIs over 200k)
Taxes paid: $8,608 (reported on 23.8% of returns)
95111:
$8,608
State:
$14,448
(% of AGI for various income ranges: 1.8% for AGIs below $25k, 2.5% for AGIs $25k-50k, 4.4% for AGIs $50k-75k, 6.2% for AGIs $75k-100k, 8.0% for AGIs $100k-200k, 8.7% for AGIs over 200k)
Earned income credit: $2,164 (reported on 25.1% of returns)
Here:
$2,164
State:
$2,286
(% of AGI for various income ranges: 7.2% for AGIs below $25k, 1.3% for AGIs $25k-50k)
Percentage of individuals using paid preparers for their 2012 taxes: 70.4%
Here:
70%
State:
64%
(% for various income ranges: 68.5% for AGIs below $25k, 74.0% for AGIs $25k-50k, 73.3% for AGIs $50k-75k, 71.0% for AGIs $75k-100k, 64.4% for AGIs $100k-200k, 58.6% for AGIs over 200k)
Averages for the 2004 tax year for zip code 95111, filed in 2005:
Average Adjusted Gross Income (AGI) in 2004: $38,348 (Individual Income Tax Returns)
Here:
$38,348
State:
$58,600
Salary/wage: $37,831 (reported on 90.7% of returns)
Here:
$37,831
State:
$49,455
(% of AGI for various income ranges: 103.3% for AGIs below $10k, 85.0% for AGIs $10k-25k, 91.7% for AGIs $25k-50k, 91.1% for AGIs $50k-75k, 91.5% for AGIs $75k-100k, 84.7% for AGIs over 100k)
Taxable interest for individuals: $547 (reported on 31.7% of returns)
This zip code:
$547
California:
$2,365
(% of AGI for various income ranges: 1.3% for AGIs below $10k, 0.5% for AGIs $10k-25k, 0.4% for AGIs $25k-50k, 0.4% for AGIs $50k-75k, 0.3% for AGIs $75k-100k, 0.6% for AGIs over 100k)
Taxable dividends: $900 (reported on 9.8% of returns)
Here:
$900
State:
$4,746
(% of AGI for various income ranges: 0.5% for AGIs below $10k, 0.2% for AGIs $10k-25k, 0.2% for AGIs $25k-50k, 0.2% for AGIs $50k-75k, 0.2% for AGIs $75k-100k, 0.4% for AGIs over 100k)
Net capital gain/loss: +$3,881 (reported on 11.2% of returns)
Here:
+$3,881
State:
+$23,418
(% of AGI for various income ranges: -1.4% for AGIs below $10k, -0.2% for AGIs $10k-25k, -0.0% for AGIs $25k-50k, 0.1% for AGIs $50k-75k, 0.7% for AGIs $75k-100k, 4.9% for AGIs over 100k)
Profit/loss from business: +$10,280 (reported on 13.5% of returns)
Here:
+$10,280
State:
+$16,826
(% of AGI for various income ranges: 10.3% for AGIs below $10k, 7.1% for AGIs $10k-25k, 3.3% for AGIs $25k-50k, 2.3% for AGIs $50k-75k, 2.4% for AGIs $75k-100k, 3.7% for AGIs over 100k)
IRA payment deduction: $2,791 (reported on 1.4% of returns)
95111:
$2,791
California:
$3,192
(% of AGI for various income ranges: 0.2% for AGIs below $10k, 0.1% for AGIs $10k-25k, 0.1% for AGIs $25k-50k, 0.1% for AGIs $50k-75k, 0.1% for AGIs $75k-100k, 0.1% for AGIs over 100k)
Self-employed pension: $15,071 (reported on 0.3% of returns)
Here:
$15,071
California:
$17,688
(% of AGI for various income ranges: 0.0% for AGIs $10k-25k, 0.1% for AGIs $50k-75k, 0.1% for AGIs $75k-100k, 0.3% for AGIs over 100k)
Total itemized deductions: $23,246 (34% of AGI, reported on 32.8% of returns)
Here:
$23,246
State:
$28,113
Here:
34.2% of AGI
State:
25.3% of AGI
(% of AGI for various income ranges: 15.0% for AGIs below $10k, 12.7% for AGIs $10k-25k, 17.1% for AGIs $25k-50k, 23.6% for AGIs $50k-75k, 24.3% for AGIs $75k-100k, 21.3% for AGIs over 100k)
Charity contributions deductions: $1,840 (3% of AGI, reported on 27.0% of returns)
Here:
$1,840
State:
$3,923
Here:
2.6% of AGI
State:
3.3% of AGI
(% of AGI for various income ranges: 0.4% for AGIs below $10k, 0.5% for AGIs $10k-25k, 0.9% for AGIs $25k-50k, 1.4% for AGIs $50k-75k, 1.8% for AGIs $75k-100k, 1.9% for AGIs over 100k)
Total tax: $4,485 (reported on 68.0% of returns)
95111:
$4,485
State:
$10,761
(% of AGI for various income ranges: 4.1% for AGIs below $10k, 3.6% for AGIs $10k-25k, 5.4% for AGIs $25k-50k, 7.2% for AGIs $50k-75k, 8.9% for AGIs $75k-100k, 14.2% for AGIs over 100k)
Earned income credit: $1,678 (reported on 18.7% of returns)
Here:
$1,678
State:
$1,763
Percentage of individuals using paid preparers for their 2004 taxes: 73.3%
Here:
73%
State:
66%
(% for various income ranges: 66.8% for AGIs below $10k, 76.2% for AGIs $10k-25k, 76.8% for AGIs $25k-50k, 74.4% for AGIs $50k-75k, 69.8% for AGIs $75k-100k, 62.9% for AGIs over 100k)
Likely homosexual households (counted as self-reported same-sex unmarried-partner households)
Lesbian couples: 0.0% of all households
Gay men: 0.2% of all households
Household received Food Stamps/SNAP in the past 12 months: 2,597 Household did not receive Food Stamps/SNAP in the past 12 months: 13,485
Women who had a birth in the past 12 months: 541 (330 now married, 211 unmarried) Women who did not have a birth in the past 12 months: 13,020 (5,026 now married, 7,999 unmarried)
Housing units in zip code 95111 with a mortgage: 5,800 (665 second mortgage, 50 home equity loan, 476 both second mortgage and home equity loan) Houses without a mortgage: 71
Median monthly owner costs for units with a mortgage: $2,944 Median monthly owner costs for units without a mortgage: $1,008
Residents with income below the poverty level in 2022:
This zip code:
9.0%
Whole state:
12.2%
Residents with income below 50% of the poverty level in 2022:
This zip code:
6.4%
Whole state:
6.2%
Median number of rooms in houses and condos:
Here:
5.6
State:
6.0
Median number of rooms in apartments:
Here:
4.2
State:
3.9
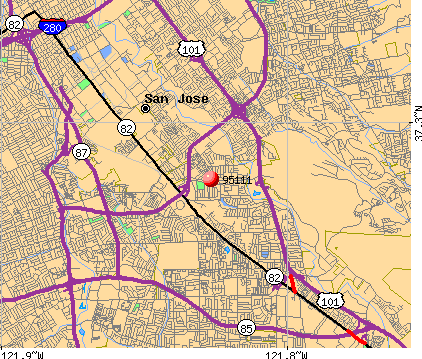
Notable locations in this zip code not listed on our city pages
Notable locations in zip code 95111: American Medical Response West (A), San Jose Fire Department Station 26 (B), San Jose Fire Department Station 18 (C). Display/hide their locations on the map
7,582 married couples with children.
3,935 single-parent households (908 men, 3,027 women).
27.1% of residents of 95111 zip code speak English at home.
39.1% of residents speak Spanish at home (59% very well, 18% well, 18% not well, 5% not at all).
1.4% of residents speak other Indo-European language at home (69% very well, 16% well, 13% not well, 2% not at all).
30.7% of residents speak Asian or Pacific Island language at home (37% very well, 26% well, 30% not well, 7% not at all).
1.3% of residents speak other language at home (69% very well, 25% well, 4% not well, 2% not at all).
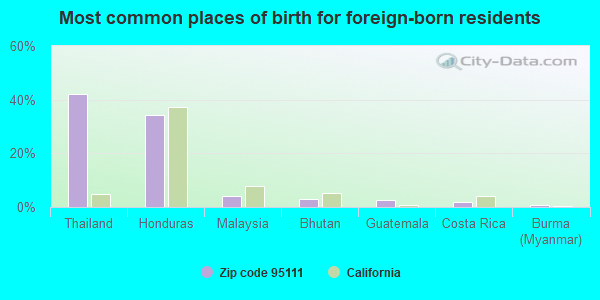
Foreign born population: 25,954 (43.8%) (61.4% of them are naturalized citizens)
This zip code:
43.8%
Whole state:
26.7%
42%Thailand
34%Honduras
4%Malaysia
3%Bhutan
3%Guatemala
2%Costa Rica
1%Burma (Myanmar)
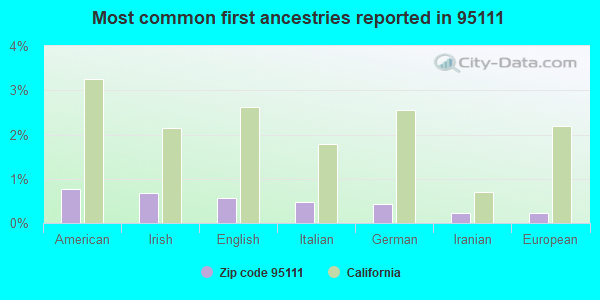
1%American
1%Irish
1%English
0%Italian
0%German
0%Iranian
0%European
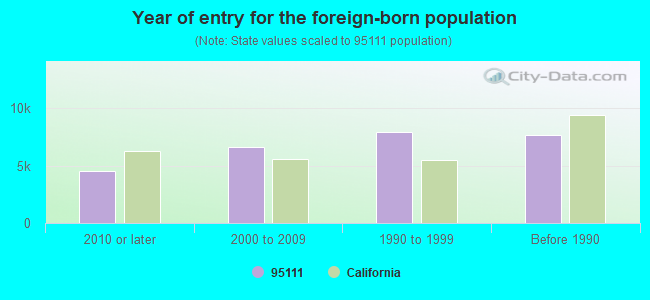
Year of entry for the foreign-born population
4,5402010 or later
6,5842000 to 2009
7,8881990 to 1999
7,648Before 1990
Major facilities with environmental interests located in this zip code:
M A COM TEK INC SAN JOSE OPERATIONS (5300 HELLYER AVENUE in SAN JOSE, CA)
STATE MASTER (California - Hazardous Waste Tracking) - HAZARDOU WASTE PROGRAM CRITERIA AND HAZARDOUS AIR POLLUTANT INVENTORY (Inventory of air pollution sources) Small Quantity Generators, between 100 kg and 1000 kg of hazardous waste/month (Resource Conservation and Recovery Act (tracking hazardous waste)) Business SIC classification: PRINTED CIRCUIT BOARDS Organizations: M/A-COM, INC. (CONTACT/OPERATOR)
, BERG AND BERG ENTERPRISES INC (CONTACT/OWNER)
Alternative names: M/A-COM, INC., SAN JOSE OPERATIONS, M/A-COM TECH, INC, M / A COM TECH INC SAN JOSE OPS, STELLEX ELECTRONICS
MONTEREY COLLISION FRAME INC (2871 MONTEREY HWY in SAN JOSE, CA)
STATE MASTER (California - Hazardous Waste Tracking) - HAZARDOU WASTE PROGRAM CRITERIA AND HAZARDOUS AIR POLLUTANT INVENTORY (Inventory of air pollution sources) Small Quantity Generators, between 100 kg and 1000 kg of hazardous waste/month (Resource Conservation and Recovery Act (tracking hazardous waste)) - notification Business SIC classification: TOP, BODY, AND UPHOLSTERY REPAIR SHOPS AND PAINT SHOPS Organizations: ROBERT SNOW (CONTACT/OWNER)
MAACO AUTO PAINTING AND BODYWORK (80 PULLMAN WY in SAN JOSE, CA)
STATE MASTER (California - Hazardous Waste Tracking) - HAZARDOU WASTE PROGRAM CRITERIA AND HAZARDOUS AIR POLLUTANT INVENTORY (Inventory of air pollution sources) Small Quantity Generators, between 100 kg and 1000 kg of hazardous waste/month (Resource Conservation and Recovery Act (tracking hazardous waste)) - notification Business SIC classification: TOP, BODY, AND UPHOLSTERY REPAIR SHOPS AND PAINT SHOPS Organizations: MURRAY BLAKE (CONTACT/OWNER)
A&A AUTO SUPPLY (3015 MONTEREY RD in SAN JOSE, CA)
STATE MASTER (California - Hazardous Waste Tracking) - HAZARDOU WASTE PROGRAM Small Quantity Generators, between 100 kg and 1000 kg of hazardous waste/month (Resource Conservation and Recovery Act (tracking hazardous waste)) - notification Organizations: ART THORNE (CONTACT/OWNER)
AMTECH LIGHTING SERVICES (2941 DAYLIGHT WAY in SAN JOSE, CA)
STATE MASTER (California - Hazardous Waste Tracking) - HAZARDOU WASTE PROGRAM TRANSPORTER (Resource Conservation and Recovery Act (tracking hazardous waste)) Organizations: AMTECH LIGHTING SVCS (CONTACT/OWNER)
ANDREW P. HILL HIGH SCHOOL (3200 SENTER RD in SAN JOSE, CA)
COMPLIANCE ACTIVITY (Tracking inspections of insecticide, fungicide, and rodenticide, and toxic substances) (National Center for Education Statistics) - STATE ID-4332995 Organizations: EAST SIDE UNION HIGH (SCHOOL DISTRICT)
FOCUS PHOTOGRAPHY (344 TULLY RD in SAN JOSE, CA)
STATE MASTER (California - Hazardous Waste Tracking) - HAZARDOU WASTE PROGRAM Small Quantity Generators, between 100 kg and 1000 kg of hazardous waste/month (Resource Conservation and Recovery Act (tracking hazardous waste)) - notification Organizations: JOHN GRAY (CONTACT/OWNER)
CHEVRON STATION NO 97686 (3151 SENTER RD in SAN JOSE, CA)
STATE MASTER (California - Hazardous Waste Tracking) - HAZARDOU WASTE PROGRAM Small Quantity Generators, between 100 kg and 1000 kg of hazardous waste/month (Resource Conservation and Recovery Act (tracking hazardous waste)) - notification Organizations: CHEVRON PRODUCTS CO (CONTACT/OWNER)
EDENVALE ELEMENTARY (285 AZUCAR AVE. in SAN JOSE, CA)
(National Center for Education Statistics) - STATE ID-6048128 Organizations: OAK GROVE ELEMENTARY (SCHOOL DISTRICT)
LOS ARBOLES ELEMENTARY (455 LOS ARBOLES AVE. in SAN JOSE, CA)
(National Center for Education Statistics) - STATE ID-6047237 Organizations: FRANKLIN-MCKINLEY ELEMENTARY (SCHOOL DISTRICT)
FRANKLIN ELEMENTARY (420 TULLY ROAD in SAN JOSE, CA)
(National Center for Education Statistics) - STATE ID-6047195 Organizations: FRANKLIN-MCKINLEY ELEMENTARY (SCHOOL DISTRICT)
HELLYER (G. W.) ELEMENTARY (725 HELLYER AVE. in SAN JOSE, CA)
(National Center for Education Statistics) - STATE ID-6047203 Organizations: FRANKLIN-MCKINLEY ELEMENTARY (SCHOOL DISTRICT)
CHRISTOPHER ELEMENTARY (565 COYOTE ROAD in SAN JOSE, CA)
(National Center for Education Statistics) - STATE ID-6048102 Organizations: OAK GROVE ELEMENTARY (SCHOOL DISTRICT)
Housing units lacking complete plumbing facilities: 0.6% Housing units lacking complete kitchen facilities: 0.9%
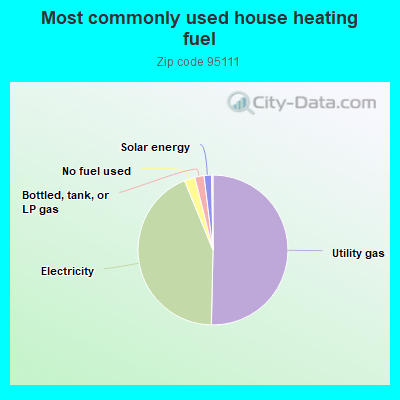
50.4%Utility gas
43.5%Electricity
2.3%No fuel used
2.0%Bottled, tank, or LP gas
1.6%Solar energy
Population in 1990: 48,286. Population change in the 1990s: +9,449 (+19.6%).
Place of birth for U.S.-born residents:
This state: 29,077
Northeast: 1,112
Midwest: 761
South: 965
West: 677
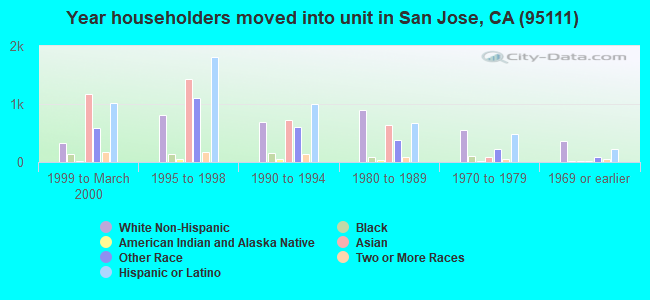
54% of the 95111 zip code residents lived in the same house 5 years ago. Out of people who lived in different houses, 85% lived in this county. Out of people who lived in different counties, 50% lived in California.
93% of the 95111 zip code residents lived in the same house 1 year ago. Out of people who lived in different houses, 74% moved from this county. Out of people who lived in different houses, 13% moved from different county within same state. Out of people who lived in different houses, 3% moved from different state. Out of people who lived in different houses, 11% moved from abroad.
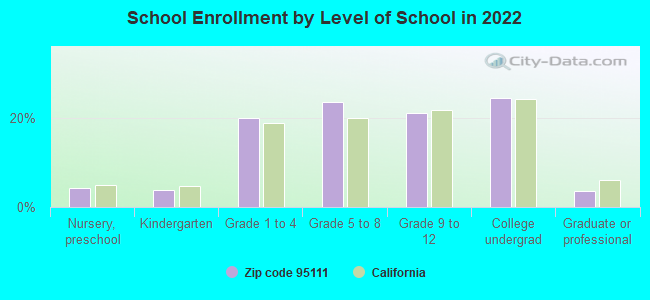
Private vs. public school enrollment:
Students in private schools in grades 1 to 8 (elementary and middle school): 197
Here:
2.7%
California:
10.5%
Students in private schools in grades 9 to 12 (high school): 210
Here:
5.9%
California:
8.5%
Students in private undergraduate colleges: 403
Here:
9.7%
California:
15.9%
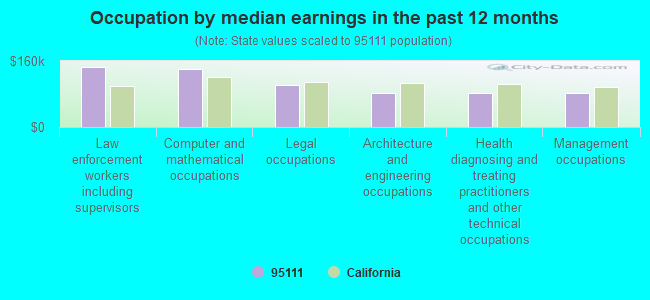
Occupation by median earnings in the past 12 months ($)
145,630Law enforcement workers including supervisors
140,982Computer and mathematical occupations
101,942Legal occupations
83,094Architecture and engineering occupations
82,234Health diagnosing and treating practitioners and other technical occupations
82,217Management occupations
Companies with federal contracts located in this zip code (SAN JOSE, CA):
MANUFACTURING ENGINEERING TECH (2758 AIELLO DR; small business) : $658,422 in 49 contractsfrom 2000 to 2006
Contracts for Bearings, Plain, Unmounted, Bushings, Rings, Shims, and Spacers, Hardware, Commercial, Airframe Structural Components, and moreby Defense Logistics Agency, Navy Signed by year:2000: $28,900; 2001: $69,502; 2002: $0; 2003: $0; 2004: $24,953; 2005: $205,509; 2006: $329,558.
Biggest contracts:
$82,959 with Defense Logistics Agency for Bearings, Plain, Unmounted. Signed on 2006-01-30. Completion date: 2006-04-20.
$82,959, same as above.Signed on 2005-11-21. Completion date: 2006-02-19.
$82,958, same as above.Signed on 2006-01-18. Completion date: 2006-04-20.
$48,356, same as above.Signed on 2006-03-09. Completion date: 2006-06-22.
R&D TOOLS SPECIALIST (2742 AIELLO DRIVE; small business) : $343,508 in 15 contractsfrom 2004 to 2005
Contracts for Night Vision Equipment, Emitted and Reflected Radiation, Guns, through 30 mm, Vehicular Furniture and Accessories, Miscellaneous Electric Power and Distribution Equipment, and moreby Defense Logistics Agency Signed by year:2000: $0; 2001: $0; 2002: $0; 2003: $0; 2004: $266,822; 2005: $76,686; 2006: $0.
Biggest contracts:
$76,800 with Defense Logistics Agency for Night Vision Equipment, Emitted and Reflected Radiation. Signed on 2004-07-28. Completion date: 2004-11-25.
$47,566 with Defense Logistics Agency for Guns, through 30 mm. Signed on 2005-05-11. Completion date: 2005-09-08.
$42,660 with Defense Logistics Agency for Vehicular Furniture and Accessories. Signed on 2004-12-09. Completion date: 2005-03-10.
$37,260 with Defense Logistics Agency for Miscellaneous Electric Power and Distribution Equipment. Signed on 2004-08-16. Completion date: 2004-11-14.
SPK MANUFACTURING (2883 AIELLO DR; small business) : $153,518 in 36 contractsfrom 2005 to 2006
Contracts for Hardware, Commercial, Fittings for Rope, Cable, and Chain, Bushings, Rings, Shims, and Spacers, Optical Sighting and Ranging Equipment, and moreby Defense Logistics Agency Signed by year:2000: $0; 2001: $0; 2002: $0; 2003: $0; 2004: $0; 2005: $144,029; 2006: $9,489.
Biggest contracts:
$10,511 with Defense Logistics Agency for Hardware, Commercial. Signed on 2005-04-19. Completion date: 2005-07-19.
$10,250 with Defense Logistics Agency for Fittings for Rope, Cable, and Chain. Signed on 2005-04-22. Completion date: 2005-08-21.
$9,450 with Defense Logistics Agency for Bushings, Rings, Shims, and Spacers. Signed on 2005-06-23. Completion date: 2005-10-21.
$6,718 with Defense Logistics Agency for Optical Sighting and Ranging Equipment. Signed on 2006-04-26. Completion date: 2006-07-25.
SHIV INC (2742 AIELLO DR; small business) : $139,088 in 3 contractsfrom 2003 to 2005
$85,500 with Defense Logistics Agency for Vehicular Cab, Body, and Frame Structural Components. Signed on 2003-11-28. Completion date: 2004-02-26.
$28,500 with Defense Logistics Agency for Pipe, Tube and Rigid Tubing. Signed on 2005-10-25. Completion date: 2006-02-22.
$25,088 with Defense Logistics Agency for Bushings, Rings, Shims, and Spacers. Signed on 2004-02-12. Completion date: 2004-05-12.
GREAT WEST EQUIPMENT, INC. (354 UMBARGER ROAD # 1; small business)
$81,800 with Air Force for Miscellaneous Construction Equipment. Taking place in MO. Signed on 2000-06-01. Completion date: 2000-07-01.
J&E PRECISION MACHINING, INC (2814 AIELLO DRIVE, UNIT A; small business)
$3,004 with Navy for Production Jigs, Fixtures, and Templates. Signed on 2005-05-09. Completion date: 2005-06-09.
Top industries in this zip code by the number of employees in 2005:
Health Care and Social Assistance: Ambulance Services (250-499 employees: 1 establishment)
Educational Services: Apprenticeship Training (250-499: 1)
2010 - 2017 National Fire Incident Reporting System (NFIRS) incidents
Based on the data from the years 2010 - 2017 the average number of fire incidents per year is 131. The highest number of fire incidents - 344 took place in 2017, and the least - 0 in 2014. The data has a growing trend.
When looking into fire subcategories, the most incidents belonged to: Outside Fires (66.3%), and Structure Fires (16.4%).
Fire incident types reported to NFIRS in Zip Code 95111


 Nearest zip codes: 95121, 95136, 95123, 95122, 95125, 95119.


 Based on the data from the years 2010 - 2017 the average number of fire incidents per year is 131. The highest number of fire incidents - 344 took place in 2017, and the least - 0 in 2014. The data has a growing trend.
 When looking into fire subcategories, the most incidents belonged to: Outside Fires (66.3%), and Structure Fires (16.4%).