Arctic Sue neighborhood in San Jose, California (CA), 95111 detailed profile
Settings
X

Business Search - 14 Million verified businesses
Area: 0.040 square miles
Population: 392
Population density:
| Arctic Sue: | 9,803 people per square mile |
| San Jose: | 5,554 people per square mile |

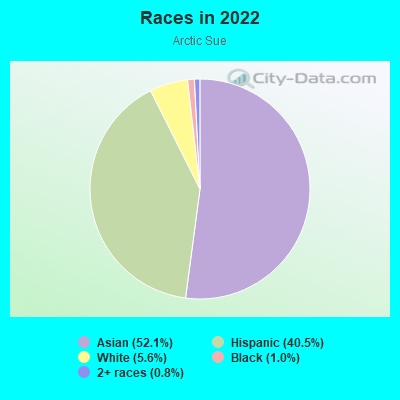
- 20352.1%Asian
- 15840.5%Hispanic or Latino
- 225.6%White
- 41.0%Black
- 30.8%Two or more races
Median household income in 2022:
| Arctic Sue: | $76,250 |
| San Jose: | $133,835 |
Distribution of median household income
![Distribution of median household income]()
- 7Less than $10,000
- 7$10,000 to $19,999
- 9$20,000 to $29,999
- 8$30,000 to $39,999
- 5$40,000 to $49,999
- 1$50,000 to $59,999
- 17$60,000 to $74,999
- 15$75,000 to $99,999
- 12$100,000 to $124,999
- 13$125,000 to $149,999
- 16$150,000 to $199,999
- 4$200,000 or more

Distribution of owner-occupied house/condo value
![Distribution of owner-occupied house/condo value]()
- 9Less than $50,000
- 2$50,000 to $99,999
- 9$100,000 to $149,999
- 3$150,000 to $199,999
- 18$200,000 to $249,999
- 7$250,000 to $299,999
- 20$300,000 to $399,999
- 9$400,000 to $499,999
- 10$500,000 to $749,999
- 6$750,000 to $999,999
- 3$1,000,000 or more

Distribution of rent paid by renters
![Distribution of rent paid by renters]()
- 2Less than $100
- 1$200 to $299
- 4$300 to $399
- 1$500 to $599
- 2$600 to $699
- 1$700 to $799
- 2$1,000 to $1,249
- 6$1,250 to $1,499
- 6$1,500 to $1,999
- 9$2,000 or more

Median rent in 2022:
| Arctic Sue: | $1,463 |
| San Jose: | $2,001 |
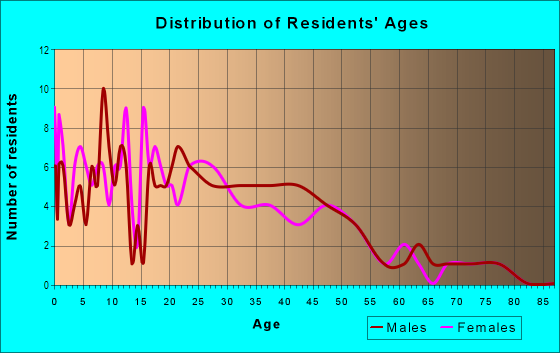
| Males: | 187 |
| Females: | 205 |
Males:
| This neighborhood: | 39.8 years |
| Whole city: | 37.6 years |
| This neighborhood: | 36.1 years |
| Whole city: | 39.1 years |
Average household size:
| Arctic Sue: | 3.6 people |
| San Jose: | 2.9 people |
Percentage of family households:
| Arctic Sue: | 70.0% |
| San Jose: | 49.9% |
| Here: | 51.8% |
| San Jose: | 53.0% |
Percentage of married-couple families with children (among all households):
| Arctic Sue: | 18.0% |
| San Jose: | 25.8% |
Percentage of single-mother households (among all households):
| Arctic Sue: | 9.2% |
| San Jose: | 5.2% |
Percentage of never married males 15 years old and over:
Percentage of never married females 15 years old and over:
| Arctic Sue: | 16.3% |
| San Jose: | 20.9% |
Percentage of never married females 15 years old and over:
| Arctic Sue: | 18.3% |
| city: | 16.7% |
Percentage of people born in this state:
Percentage of people born in another U.S. state:
Percentage of native residents but born outside the U.S.:
Percentage of foreign born residents:
| Here: | 46.8% |
| San Jose: | 46.1% |
Percentage of people born in another U.S. state:
| Arctic Sue: | 3.5% |
| San Jose: | 10.4% |
Percentage of native residents but born outside the U.S.:
| Here: | 1.2% |
| city: | 1.7% |
Percentage of foreign born residents:
| Here: | 48.5% |
| San Jose: | 41.8% |
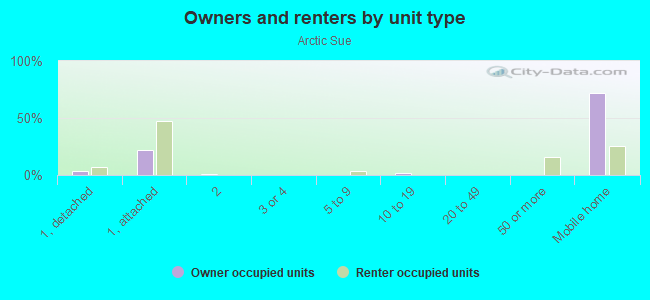
Owner-occupied
Renter-occupied

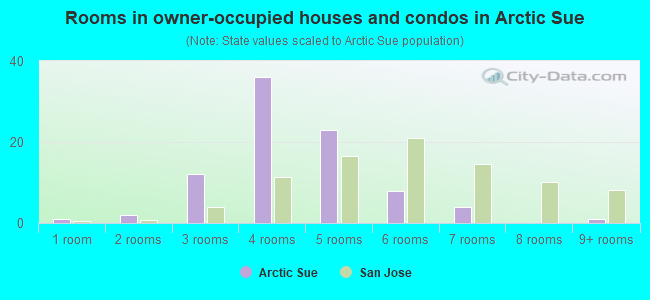
- Rooms in owner-occupied houses and condos in Arctic Sue
- 11 room
- 22 rooms
- 123 rooms
- 364 rooms
- 235 rooms
- 86 rooms
- 47 rooms
- 08 rooms
- 19+ rooms
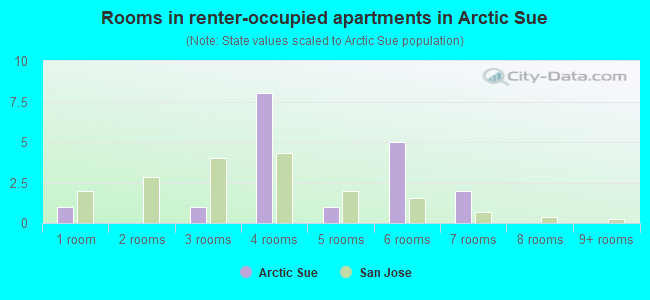
- Rooms in renter-occupied apartments in Arctic Sue
- 11 room
- 02 rooms
- 13 rooms
- 84 rooms
- 15 rooms
- 56 rooms
- 27 rooms
- 08 rooms
- 09+ rooms
Owner-occupied
Renter-occupied
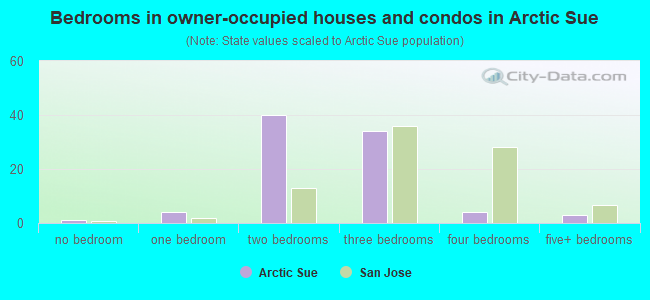
- Bedrooms in owner-occupied houses and condos in Arctic Sue
- 1no bedroom
- 41 bedroom
- 402 bedrooms
- 343 bedrooms
- 44 bedrooms
- 35+ bedrooms
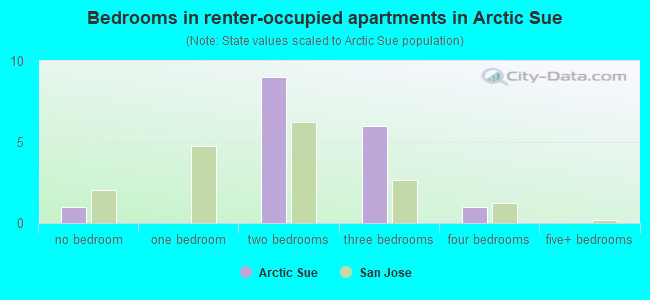
- Bedrooms in renter-occupied apartments in Arctic Sue
- 1no bedroom
- 01 bedroom
- 92 bedrooms
- 63 bedrooms
- 14 bedrooms
- 05+ bedrooms
Average number of cars or other vehicles available in houses/condos:
Average number of cars or other vehicles available in apartments:
| This neighborhood: | 2.1 |
| San Jose: | 2.3 |
Average number of cars or other vehicles available in apartments:
| Here: | 1.4 |
| city: | 1.6 |
Percentage of units with a mortgage:
| Arctic Sue: | 39.2% |
| San Jose: | 66.9% |
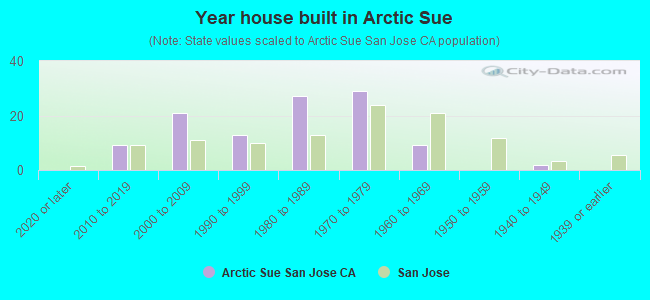
- Year house built in Arctic Sue
- 02020 or later
- 92010 to 2019
- 212000 to 2009
- 131990 to 1999
- 271980 to 1989
- 291970 to 1979
- 91960 to 1969
- 01950 to 1959
- 21940 to 1949
- 01939 or earlier
City-data.com crime index for city in 2020 (higher means more crime):
| City: | 268.4 |
| U.S. average: | 219.5 |
Travel time to work (commute)
![Travel time to work (commute)]()
- 810 to 14 minutes
- 815 to 19 minutes
- 2820 to 24 minutes
- 2025 to 29 minutes
- 2930 to 34 minutes
- 435 to 39 minutes
- 740 to 44 minutes
- 645 to 59 minutes
- 560 to 89 minutes
- 190 or more minutes

Means of transportation to work
![Means of transportation to work]()
- 69.3%124Drove a car alone
- 18.4%33Carpooled
- 1.1%2Bus
- 10.1%18Worked at home

Time leaving home to go to work
![Time leaving home to go to work]()
- 212:00 a.m. to 4:59 a.m.
- 35:00 a.m. to 5:29 a.m.
- 85:30 a.m. to 5:59 a.m.
- 96:00 a.m. to 6:29 a.m.
- 46:30 a.m. to 6:59 a.m.
- 227:00 a.m. to 7:29 a.m.
- 137:30 a.m. to 7:59 a.m.
- 208:00 a.m. to 8:29 a.m.
- 18:30 a.m. to 8:59 a.m.
- 119:00 a.m. to 9:59 a.m.
- 210:00 a.m. to 10:59 a.m.
- 412:00 p.m. to 3:59 p.m.
- 134:00 p.m. to 11:59 p.m.

Occupations of males:
- Percentage of males in management occupations (except farmers):
Here: 5.4% city: 13.0%
- Percentage of males in business and financial operations occupations:
Here: 1.4% city: 4.6%
- Percentage of males in computer and mathematical occupations:
Here: 3.4% city: 13.6%
- Percentage of males in architecture and engineering occupations:
Here: 7.9% city: 10.2%
- Percentage of males in life, physical, and social science occupations:
Here: 2.7% city: 1.1%
- Percentage of males in community and social services occupations:
Here: 1.2% city: 0.8%
- Percentage of males in education, training, and library occupations:
Here: 3.7% city: 2.8%
- Percentage of males in service occupations:
Here: 10.8% city: 12.7%
- Percentage of males in sales and office occupations:
Here: 5.7% city: 12.8%
- Percentage of males in construction, extraction, and maintenance occupations:
Here: 13.0% city: 7.8%
- Percentage of males in production occupations:
Here: 22.4% city: 5.5%
- Percentage of males in transportation occupations:
Here: 9.8% city: 3.6%
- Percentage of males in material moving occupations:
Here: 4.7% city: 3.1%
Occupations of females:
- Percentage of females in management occupations (except farmers):
Here: 9.3% city: 11.0%
- Percentage of females in business and financial operations occupations:
Here: 8.3% city: 8.6%
- Percentage of females in architecture and engineering occupations:
Here: 1.4% city: 2.8%
- Percentage of females in life, physical, and social science occupations:
Here: 3.7% city: 1.7%
- Percentage of females in education, training, and library occupations:
Here: 6.4% city: 8.1%
- Percentage of females in healthcare practitioners and technical occupations:
Here: 9.2% city: 6.8%
- Percentage of females in service occupations:
Here: 38.8% city: 21.7%
- Percentage of females in sales and office occupations:
Here: 6.8% city: 22.0%
- Percentage of females in production occupations:
Here: 13.6% city: 4.0%
- Percentage of females in transportation occupations:
Here: 1.4% city: 0.7%
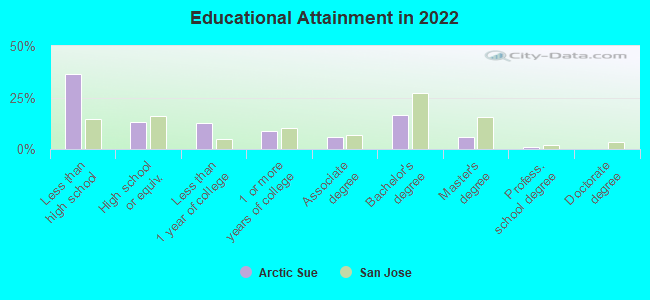
Education in this neighborhood (subdivision or community):
- Percentage of people 3 years and older in K-12 schools:
Arctic Sue: 22.8% San Jose: 16.1%
- Percentage of people 3 years and older in undergraduate colleges:
Arctic Sue: 8.6% San Jose: 6.5%
- Percentage of people 3 years and older in grad. or professional schools:
Arctic Sue: 0.0% San Jose: 2.0%
- Percentage of students K-12 enrolled in private schools:
Arctic Sue: 12.6% San Jose: 14.9%
Percentage of population below poverty level:
| Arctic Sue: | 10.7% |
| San Jose: | 9.0% |
Median year owner moved in (as recorded in 2022):
Median year renter moved in (as recorded in 2022):
| Arctic Sue: | 2008 |
| San Jose: | 2008 |
Median year renter moved in (as recorded in 2022):
| Arctic Sue: | 2014 |
| San Jose: | 2020 |
Percentage of married-couple families with both working:
| Arctic Sue: | 79.4% |
| San Jose: | 72.5% |
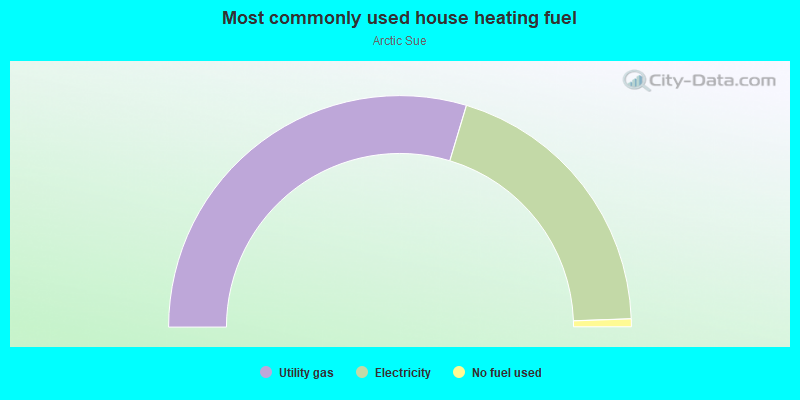
- 59.3%Utility gas
- 39.6%Electricity
- 1.1%No fuel used
Roads and streets:
Baltic Way
Length: 0.21 miles
Directions: N-S, SW-NE
Address range: 400 to 599
Directions: N-S, SW-NE
Address range: 400 to 599
Feldspar Dr
Length: 0.21 miles
Directions: E-W, SW-NE
Address range: 401 to 599
Directions: E-W, SW-NE
Address range: 401 to 599
Senter Rd
Length: 0.19 miles
Directions: SE-NW, SW-NE
Address range: 2501 to 2599
Directions: SE-NW, SW-NE
Address range: 2501 to 2599
Sue Ave
Length: 0.17 miles
Direction: SE-NW
Address range: 2500 to 2598
Direction: SE-NW
Address range: 2500 to 2598
Arctic Ave
Length: 0.17 miles
Directions: E-W, N-S, SE-NW
Address range: 2500 to 2599
Directions: E-W, N-S, SE-NW
Address range: 2500 to 2599
Salmon Dr
Length: 0.15 miles
Direction: SW-NE
Address range: 400 to 599
Direction: SW-NE
Address range: 400 to 599
Sheridan Pl
Length: 0.15 miles
Direction: SW-NE
Address range: 400 to 599
Direction: SW-NE
Address range: 400 to 599