Estimated zip code population in 2022: 36,352
Zip code population in 2010: 37,469
Zip code population in 2000: 37,126
Houses and condos: 10,134
Renter-occupied apartments: 2,509
% of renters here:
25%State:
44%
March 2022 cost of living index in zip code 95121: 122.6
(high, U.S. average is 100)
Land area: 4.4
sq. mi.
Water area: 0.0
sq. mi.
Population density: 8,197 people per square mile (high).
OSM Map
General Map
Google Map
MSN Map
OSM Map
General Map
Google Map
MSN Map
OSM Map
General Map
Google Map
MSN Map
OSM Map
General Map
Google Map
MSN Map
Please wait while loading the map...
Real estate property taxes paid for housing units in 2022:
This zip code:
0.8% ($7,791)California:
0.7% ($4,831)
Median real estate property taxes paid for housing units with mortgages in 2022: $8,577 (0.8%)
Median real estate property taxes paid for housing units with no mortgage in 2022: $6,212 (0.6%)
Profiles of local businesses
Business Search - 14 Million verified businesses
Males: 18,894 Females: 17,457
For population 25 years and over in 95121:
High school or higher: 79.2%Bachelor's degree or higher: 34.8%Graduate or professional degree: 10.0%Unemployed: 5.5%Mean travel time to work (commute): 29.5 minutes
For population 15 years and over in 95121:
Never married: 35.5%Now married: 49.4%Separated: 1.3%Widowed: 5.9%Divorced: 7.8%
Zip code 95121 compared to state average:
Black race population percentage below state average. Median age above state average. Foreign-born population percentage above state average. Renting percentage below state average. Length of stay since moving in significantly above state average. 22,466 61.8% Asian 8,683 23.9% Hispanic or Latino 2,974 8.2% White 1,102 3.0% Black 756 2.1% Two or more races 170 0.5% Native Hawaiian and Other 182 0.5% Some other race 15 0.04% American Indian
Data:
Median household income ($)
Median household income (% change since 2000)
Household income diversity
Ratio of average income to average house value (%)
Ratio of average income to average rent
Median household income ($) - White
Median household income ($) - Black or African American
Median household income ($) - Asian
Median household income ($) - Hispanic or Latino
Median household income ($) - American Indian and Alaska Native
Median household income ($) - Multirace
Median household income ($) - Other Race
Median household income for houses/condos with a mortgage ($)
Median household income for apartments without a mortgage ($)
Races - White alone (%)
Races - White alone (% change since 2000)
Races - Black alone (%)
Races - Black alone (% change since 2000)
Races - American Indian alone (%)
Races - American Indian alone (% change since 2000)
Races - Asian alone (%)
Races - Asian alone (% change since 2000)
Races - Hispanic (%)
Races - Hispanic (% change since 2000)
Races - Native Hawaiian and Other Pacific Islander alone (%)
Races - Native Hawaiian and Other Pacific Islander alone (% change since 2000)
Races - Two or more races (%)
Races - Two or more races (% change since 2000)
Races - Other race alone (%)
Races - Other race alone (% change since 2000)
Racial diversity
Unemployment (%)
Unemployment (% change since 2000)
Unemployment (%) - White
Unemployment (%) - Black or African American
Unemployment (%) - Asian
Unemployment (%) - Hispanic or Latino
Unemployment (%) - American Indian and Alaska Native
Unemployment (%) - Multirace
Unemployment (%) - Other Race
Population density (people per square mile)
Population - Males (%)
Population - Females (%)
Population - Males (%) - White
Population - Males (%) - Black or African American
Population - Males (%) - Asian
Population - Males (%) - Hispanic or Latino
Population - Males (%) - American Indian and Alaska Native
Population - Males (%) - Multirace
Population - Males (%) - Other Race
Population - Females (%) - White
Population - Females (%) - Black or African American
Population - Females (%) - Asian
Population - Females (%) - Hispanic or Latino
Population - Females (%) - American Indian and Alaska Native
Population - Females (%) - Multirace
Population - Females (%) - Other Race
Coronavirus confirmed cases (Apr 26, 2024)
Deaths caused by coronavirus (Apr 26, 2024)
Coronavirus confirmed cases (per 100k population) (Apr 26, 2024)
Deaths caused by coronavirus (per 100k population) (Apr 26, 2024)
Daily increase in number of cases (Apr 26, 2024)
Weekly increase in number of cases (Apr 26, 2024)
Cases doubled (in days) (Apr 26, 2024)
Hospitalized patients (Apr 18, 2022)
Negative test results (Apr 18, 2022)
Total test results (Apr 18, 2022)
COVID Vaccine doses distributed (per 100k population) (Sep 19, 2023)
COVID Vaccine doses administered (per 100k population) (Sep 19, 2023)
COVID Vaccine doses distributed (Sep 19, 2023)
COVID Vaccine doses administered (Sep 19, 2023)
Likely homosexual households (%)
Likely homosexual households (% change since 2000)
Likely homosexual households - Lesbian couples (%)
Likely homosexual households - Lesbian couples (% change since 2000)
Likely homosexual households - Gay men (%)
Likely homosexual households - Gay men (% change since 2000)
Cost of living index
Median gross rent ($)
Median contract rent ($)
Median monthly housing costs ($)
Median house or condo value ($)
Median house or condo value ($ change since 2000)
Mean house or condo value by units in structure - 1, detached ($)
Mean house or condo value by units in structure - 1, attached ($)
Mean house or condo value by units in structure - 2 ($)
Mean house or condo value by units in structure by units in structure - 3 or 4 ($)
Mean house or condo value by units in structure - 5 or more ($)
Mean house or condo value by units in structure - Boat, RV, van, etc. ($)
Mean house or condo value by units in structure - Mobile home ($)
Median house or condo value ($) - White
Median house or condo value ($) - Black or African American
Median house or condo value ($) - Asian
Median house or condo value ($) - Hispanic or Latino
Median house or condo value ($) - American Indian and Alaska Native
Median house or condo value ($) - Multirace
Median house or condo value ($) - Other Race
Median resident age
Resident age diversity
Median resident age - Males
Median resident age - Females
Median resident age - White
Median resident age - Black or African American
Median resident age - Asian
Median resident age - Hispanic or Latino
Median resident age - American Indian and Alaska Native
Median resident age - Multirace
Median resident age - Other Race
Median resident age - Males - White
Median resident age - Males - Black or African American
Median resident age - Males - Asian
Median resident age - Males - Hispanic or Latino
Median resident age - Males - American Indian and Alaska Native
Median resident age - Males - Multirace
Median resident age - Males - Other Race
Median resident age - Females - White
Median resident age - Females - Black or African American
Median resident age - Females - Asian
Median resident age - Females - Hispanic or Latino
Median resident age - Females - American Indian and Alaska Native
Median resident age - Females - Multirace
Median resident age - Females - Other Race
Commute - mean travel time to work (minutes)
Travel time to work - Less than 5 minutes (%)
Travel time to work - Less than 5 minutes (% change since 2000)
Travel time to work - 5 to 9 minutes (%)
Travel time to work - 5 to 9 minutes (% change since 2000)
Travel time to work - 10 to 19 minutes (%)
Travel time to work - 10 to 19 minutes (% change since 2000)
Travel time to work - 20 to 29 minutes (%)
Travel time to work - 20 to 29 minutes (% change since 2000)
Travel time to work - 30 to 39 minutes (%)
Travel time to work - 30 to 39 minutes (% change since 2000)
Travel time to work - 40 to 59 minutes (%)
Travel time to work - 40 to 59 minutes (% change since 2000)
Travel time to work - 60 to 89 minutes (%)
Travel time to work - 60 to 89 minutes (% change since 2000)
Travel time to work - 90 or more minutes (%)
Travel time to work - 90 or more minutes (% change since 2000)
Marital status - Never married (%)
Marital status - Now married (%)
Marital status - Separated (%)
Marital status - Widowed (%)
Marital status - Divorced (%)
Median family income ($)
Median family income (% change since 2000)
Median non-family income ($)
Median non-family income (% change since 2000)
Median per capita income ($)
Median per capita income (% change since 2000)
Median family income ($) - White
Median family income ($) - Black or African American
Median family income ($) - Asian
Median family income ($) - Hispanic or Latino
Median family income ($) - American Indian and Alaska Native
Median family income ($) - Multirace
Median family income ($) - Other Race
Median year house/condo built
Median year apartment built
Year house built - Built 2005 or later (%)
Year house built - Built 2000 to 2004 (%)
Year house built - Built 1990 to 1999 (%)
Year house built - Built 1980 to 1989 (%)
Year house built - Built 1970 to 1979 (%)
Year house built - Built 1960 to 1969 (%)
Year house built - Built 1950 to 1959 (%)
Year house built - Built 1940 to 1949 (%)
Year house built - Built 1939 or earlier (%)
Average household size
Household density (households per square mile)
Average household size - White
Average household size - Black or African American
Average household size - Asian
Average household size - Hispanic or Latino
Average household size - American Indian and Alaska Native
Average household size - Multirace
Average household size - Other Race
Occupied housing units (%)
Vacant housing units (%)
Owner occupied housing units (%)
Renter occupied housing units (%)
Vacancy status - For rent (%)
Vacancy status - For sale only (%)
Vacancy status - Rented or sold, not occupied (%)
Vacancy status - For seasonal, recreational, or occasional use (%)
Vacancy status - For migrant workers (%)
Vacancy status - Other vacant (%)
Residents with income below the poverty level (%)
Residents with income below 50% of the poverty level (%)
Children below poverty level (%)
Poor families by family type - Married-couple family (%)
Poor families by family type - Male, no wife present (%)
Poor families by family type - Female, no husband present (%)
Poverty status for native-born residents (%)
Poverty status for foreign-born residents (%)
Poverty among high school graduates not in families (%)
Poverty among people who did not graduate high school not in families (%)
Residents with income below the poverty level (%) - White
Residents with income below the poverty level (%) - Black or African American
Residents with income below the poverty level (%) - Asian
Residents with income below the poverty level (%) - Hispanic or Latino
Residents with income below the poverty level (%) - American Indian and Alaska Native
Residents with income below the poverty level (%) - Multirace
Residents with income below the poverty level (%) - Other Race
Air pollution - Air Quality Index (AQI)
Air pollution - CO
Air pollution - NO2
Air pollution - SO2
Air pollution - Ozone
Air pollution - PM10
Air pollution - PM25
Air pollution - Pb
Crime - Murders per 100,000 population
Crime - Rapes per 100,000 population
Crime - Robberies per 100,000 population
Crime - Assaults per 100,000 population
Crime - Burglaries per 100,000 population
Crime - Thefts per 100,000 population
Crime - Auto thefts per 100,000 population
Crime - Arson per 100,000 population
Crime - City-data.com crime index
Crime - Violent crime index
Crime - Property crime index
Crime - Murders per 100,000 population (5 year average)
Crime - Rapes per 100,000 population (5 year average)
Crime - Robberies per 100,000 population (5 year average)
Crime - Assaults per 100,000 population (5 year average)
Crime - Burglaries per 100,000 population (5 year average)
Crime - Thefts per 100,000 population (5 year average)
Crime - Auto thefts per 100,000 population (5 year average)
Crime - Arson per 100,000 population (5 year average)
Crime - City-data.com crime index (5 year average)
Crime - Violent crime index (5 year average)
Crime - Property crime index (5 year average)
1996 Presidential Elections Results (%) - Democratic Party (Clinton)
1996 Presidential Elections Results (%) - Republican Party (Dole)
1996 Presidential Elections Results (%) - Other
2000 Presidential Elections Results (%) - Democratic Party (Gore)
2000 Presidential Elections Results (%) - Republican Party (Bush)
2000 Presidential Elections Results (%) - Other
2004 Presidential Elections Results (%) - Democratic Party (Kerry)
2004 Presidential Elections Results (%) - Republican Party (Bush)
2004 Presidential Elections Results (%) - Other
2008 Presidential Elections Results (%) - Democratic Party (Obama)
2008 Presidential Elections Results (%) - Republican Party (McCain)
2008 Presidential Elections Results (%) - Other
2012 Presidential Elections Results (%) - Democratic Party (Obama)
2012 Presidential Elections Results (%) - Republican Party (Romney)
2012 Presidential Elections Results (%) - Other
2016 Presidential Elections Results (%) - Democratic Party (Clinton)
2016 Presidential Elections Results (%) - Republican Party (Trump)
2016 Presidential Elections Results (%) - Other
2020 Presidential Elections Results (%) - Democratic Party (Biden)
2020 Presidential Elections Results (%) - Republican Party (Trump)
2020 Presidential Elections Results (%) - Other
Ancestries Reported - Arab (%)
Ancestries Reported - Czech (%)
Ancestries Reported - Danish (%)
Ancestries Reported - Dutch (%)
Ancestries Reported - English (%)
Ancestries Reported - French (%)
Ancestries Reported - French Canadian (%)
Ancestries Reported - German (%)
Ancestries Reported - Greek (%)
Ancestries Reported - Hungarian (%)
Ancestries Reported - Irish (%)
Ancestries Reported - Italian (%)
Ancestries Reported - Lithuanian (%)
Ancestries Reported - Norwegian (%)
Ancestries Reported - Polish (%)
Ancestries Reported - Portuguese (%)
Ancestries Reported - Russian (%)
Ancestries Reported - Scotch-Irish (%)
Ancestries Reported - Scottish (%)
Ancestries Reported - Slovak (%)
Ancestries Reported - Subsaharan African (%)
Ancestries Reported - Swedish (%)
Ancestries Reported - Swiss (%)
Ancestries Reported - Ukrainian (%)
Ancestries Reported - United States (%)
Ancestries Reported - Welsh (%)
Ancestries Reported - West Indian (%)
Ancestries Reported - Other (%)
Educational Attainment - No schooling completed (%)
Educational Attainment - Less than high school (%)
Educational Attainment - High school or equivalent (%)
Educational Attainment - Less than 1 year of college (%)
Educational Attainment - 1 or more years of college (%)
Educational Attainment - Associate degree (%)
Educational Attainment - Bachelor's degree (%)
Educational Attainment - Master's degree (%)
Educational Attainment - Professional school degree (%)
Educational Attainment - Doctorate degree (%)
School Enrollment - Nursery, preschool (%)
School Enrollment - Kindergarten (%)
School Enrollment - Grade 1 to 4 (%)
School Enrollment - Grade 5 to 8 (%)
School Enrollment - Grade 9 to 12 (%)
School Enrollment - College undergrad (%)
School Enrollment - Graduate or professional (%)
School Enrollment - Not enrolled in school (%)
School enrollment - Public schools (%)
School enrollment - Private schools (%)
School enrollment - Not enrolled (%)
Median number of rooms in houses and condos
Median number of rooms in apartments
Housing units lacking complete plumbing facilities (%)
Housing units lacking complete kitchen facilities (%)
Density of houses
Urban houses (%)
Rural houses (%)
Households with people 60 years and over (%)
Households with people 65 years and over (%)
Households with people 75 years and over (%)
Households with one or more nonrelatives (%)
Households with no nonrelatives (%)
Population in households (%)
Family households (%)
Nonfamily households (%)
Population in families (%)
Family households with own children (%)
Median number of bedrooms in owner occupied houses
Mean number of bedrooms in owner occupied houses
Median number of bedrooms in renter occupied houses
Mean number of bedrooms in renter occupied houses
Median number of vehichles in owner occupied houses
Mean number of vehichles in owner occupied houses
Median number of vehichles in renter occupied houses
Mean number of vehichles in renter occupied houses
Mortgage status - with mortgage (%)
Mortgage status - with second mortgage (%)
Mortgage status - with home equity loan (%)
Mortgage status - with both second mortgage and home equity loan (%)
Mortgage status - without a mortgage (%)
Average family size
Average family size - White
Average family size - Black or African American
Average family size - Asian
Average family size - Hispanic or Latino
Average family size - American Indian and Alaska Native
Average family size - Multirace
Average family size - Other Race
Geographical mobility - Same house 1 year ago (%)
Geographical mobility - Moved within same county (%)
Geographical mobility - Moved from different county within same state (%)
Geographical mobility - Moved from different state (%)
Geographical mobility - Moved from abroad (%)
Place of birth - Born in state of residence (%)
Place of birth - Born in other state (%)
Place of birth - Native, outside of US (%)
Place of birth - Foreign born (%)
Housing units in structures - 1, detached (%)
Housing units in structures - 1, attached (%)
Housing units in structures - 2 (%)
Housing units in structures - 3 or 4 (%)
Housing units in structures - 5 to 9 (%)
Housing units in structures - 10 to 19 (%)
Housing units in structures - 20 to 49 (%)
Housing units in structures - 50 or more (%)
Housing units in structures - Mobile home (%)
Housing units in structures - Boat, RV, van, etc. (%)
House/condo owner moved in on average (years ago)
Renter moved in on average (years ago)
Year householder moved into unit - Moved in 1999 to March 2000 (%)
Year householder moved into unit - Moved in 1995 to 1998 (%)
Year householder moved into unit - Moved in 1990 to 1994 (%)
Year householder moved into unit - Moved in 1980 to 1989 (%)
Year householder moved into unit - Moved in 1970 to 1979 (%)
Year householder moved into unit - Moved in 1969 or earlier (%)
Means of transportation to work - Drove car alone (%)
Means of transportation to work - Carpooled (%)
Means of transportation to work - Public transportation (%)
Means of transportation to work - Bus or trolley bus (%)
Means of transportation to work - Streetcar or trolley car (%)
Means of transportation to work - Subway or elevated (%)
Means of transportation to work - Railroad (%)
Means of transportation to work - Ferryboat (%)
Means of transportation to work - Taxicab (%)
Means of transportation to work - Motorcycle (%)
Means of transportation to work - Bicycle (%)
Means of transportation to work - Walked (%)
Means of transportation to work - Other means (%)
Working at home (%)
Industry diversity
Most Common Industries - Agriculture, forestry, fishing and hunting, and mining (%)
Most Common Industries - Agriculture, forestry, fishing and hunting (%)
Most Common Industries - Mining, quarrying, and oil and gas extraction (%)
Most Common Industries - Construction (%)
Most Common Industries - Manufacturing (%)
Most Common Industries - Wholesale trade (%)
Most Common Industries - Retail trade (%)
Most Common Industries - Transportation and warehousing, and utilities (%)
Most Common Industries - Transportation and warehousing (%)
Most Common Industries - Utilities (%)
Most Common Industries - Information (%)
Most Common Industries - Finance and insurance, and real estate and rental and leasing (%)
Most Common Industries - Finance and insurance (%)
Most Common Industries - Real estate and rental and leasing (%)
Most Common Industries - Professional, scientific, and management, and administrative and waste management services (%)
Most Common Industries - Professional, scientific, and technical services (%)
Most Common Industries - Management of companies and enterprises (%)
Most Common Industries - Administrative and support and waste management services (%)
Most Common Industries - Educational services, and health care and social assistance (%)
Most Common Industries - Educational services (%)
Most Common Industries - Health care and social assistance (%)
Most Common Industries - Arts, entertainment, and recreation, and accommodation and food services (%)
Most Common Industries - Arts, entertainment, and recreation (%)
Most Common Industries - Accommodation and food services (%)
Most Common Industries - Other services, except public administration (%)
Most Common Industries - Public administration (%)
Occupation diversity
Most Common Occupations - Management, business, science, and arts occupations (%)
Most Common Occupations - Management, business, and financial occupations (%)
Most Common Occupations - Management occupations (%)
Most Common Occupations - Business and financial operations occupations (%)
Most Common Occupations - Computer, engineering, and science occupations (%)
Most Common Occupations - Computer and mathematical occupations (%)
Most Common Occupations - Architecture and engineering occupations (%)
Most Common Occupations - Life, physical, and social science occupations (%)
Most Common Occupations - Education, legal, community service, arts, and media occupations (%)
Most Common Occupations - Community and social service occupations (%)
Most Common Occupations - Legal occupations (%)
Most Common Occupations - Education, training, and library occupations (%)
Most Common Occupations - Arts, design, entertainment, sports, and media occupations (%)
Most Common Occupations - Healthcare practitioners and technical occupations (%)
Most Common Occupations - Health diagnosing and treating practitioners and other technical occupations (%)
Most Common Occupations - Health technologists and technicians (%)
Most Common Occupations - Service occupations (%)
Most Common Occupations - Healthcare support occupations (%)
Most Common Occupations - Protective service occupations (%)
Most Common Occupations - Fire fighting and prevention, and other protective service workers including supervisors (%)
Most Common Occupations - Law enforcement workers including supervisors (%)
Most Common Occupations - Food preparation and serving related occupations (%)
Most Common Occupations - Building and grounds cleaning and maintenance occupations (%)
Most Common Occupations - Personal care and service occupations (%)
Most Common Occupations - Sales and office occupations (%)
Most Common Occupations - Sales and related occupations (%)
Most Common Occupations - Office and administrative support occupations (%)
Most Common Occupations - Natural resources, construction, and maintenance occupations (%)
Most Common Occupations - Farming, fishing, and forestry occupations (%)
Most Common Occupations - Construction and extraction occupations (%)
Most Common Occupations - Installation, maintenance, and repair occupations (%)
Most Common Occupations - Production, transportation, and material moving occupations (%)
Most Common Occupations - Production occupations (%)
Most Common Occupations - Transportation occupations (%)
Most Common Occupations - Material moving occupations (%)
People in Group quarters - Institutionalized population (%)
People in Group quarters - Correctional institutions (%)
People in Group quarters - Federal prisons and detention centers (%)
People in Group quarters - Halfway houses (%)
People in Group quarters - Local jails and other confinement facilities (including police lockups) (%)
People in Group quarters - Military disciplinary barracks (%)
People in Group quarters - State prisons (%)
People in Group quarters - Other types of correctional institutions (%)
People in Group quarters - Nursing homes (%)
People in Group quarters - Hospitals/wards, hospices, and schools for the handicapped (%)
People in Group quarters - Hospitals/wards and hospices for chronically ill (%)
People in Group quarters - Hospices or homes for chronically ill (%)
People in Group quarters - Military hospitals or wards for chronically ill (%)
People in Group quarters - Other hospitals or wards for chronically ill (%)
People in Group quarters - Hospitals or wards for drug/alcohol abuse (%)
People in Group quarters - Mental (Psychiatric) hospitals or wards (%)
People in Group quarters - Schools, hospitals, or wards for the mentally retarded (%)
People in Group quarters - Schools, hospitals, or wards for the physically handicapped (%)
People in Group quarters - Institutions for the deaf (%)
People in Group quarters - Institutions for the blind (%)
People in Group quarters - Orthopedic wards and institutions for the physically handicapped (%)
People in Group quarters - Wards in general hospitals for patients who have no usual home elsewhere (%)
People in Group quarters - Wards in military hospitals for patients who have no usual home elsewhere (%)
People in Group quarters - Juvenile institutions (%)
People in Group quarters - Long-term care (%)
People in Group quarters - Homes for abused, dependent, and neglected children (%)
People in Group quarters - Residential treatment centers for emotionally disturbed children (%)
People in Group quarters - Training schools for juvenile delinquents (%)
People in Group quarters - Short-term care, detention or diagnostic centers for delinquent children (%)
People in Group quarters - Type of juvenile institution unknown (%)
People in Group quarters - Noninstitutionalized population (%)
People in Group quarters - College dormitories (includes college quarters off campus) (%)
People in Group quarters - Military quarters (%)
People in Group quarters - On base (%)
People in Group quarters - Barracks, unaccompanied personnel housing (UPH), (Enlisted/Officer), ;and similar group living quarters for military personnel (%)
People in Group quarters - Transient quarters for temporary residents (%)
People in Group quarters - Military ships (%)
People in Group quarters - Group homes (%)
People in Group quarters - Homes or halfway houses for drug/alcohol abuse (%)
People in Group quarters - Homes for the mentally ill (%)
People in Group quarters - Homes for the mentally retarded (%)
People in Group quarters - Homes for the physically handicapped (%)
People in Group quarters - Other group homes (%)
People in Group quarters - Religious group quarters (%)
People in Group quarters - Dormitories (%)
People in Group quarters - Agriculture workers' dormitories on farms (%)
People in Group quarters - Job Corps and vocational training facilities (%)
People in Group quarters - Other workers' dormitories (%)
People in Group quarters - Crews of maritime vessels (%)
People in Group quarters - Other nonhousehold living situations (%)
People in Group quarters - Other noninstitutional group quarters (%)
Residents speaking English at home (%)
Residents speaking English at home - Born in the United States (%)
Residents speaking English at home - Native, born elsewhere (%)
Residents speaking English at home - Foreign born (%)
Residents speaking Spanish at home (%)
Residents speaking Spanish at home - Born in the United States (%)
Residents speaking Spanish at home - Native, born elsewhere (%)
Residents speaking Spanish at home - Foreign born (%)
Residents speaking other language at home (%)
Residents speaking other language at home - Born in the United States (%)
Residents speaking other language at home - Native, born elsewhere (%)
Residents speaking other language at home - Foreign born (%)
Class of Workers - Employee of private company (%)
Class of Workers - Self-employed in own incorporated business (%)
Class of Workers - Private not-for-profit wage and salary workers (%)
Class of Workers - Local government workers (%)
Class of Workers - State government workers (%)
Class of Workers - Federal government workers (%)
Class of Workers - Self-employed workers in own not incorporated business and Unpaid family workers (%)
House heating fuel used in houses and condos - Utility gas (%)
House heating fuel used in houses and condos - Bottled, tank, or LP gas (%)
House heating fuel used in houses and condos - Electricity (%)
House heating fuel used in houses and condos - Fuel oil, kerosene, etc. (%)
House heating fuel used in houses and condos - Coal or coke (%)
House heating fuel used in houses and condos - Wood (%)
House heating fuel used in houses and condos - Solar energy (%)
House heating fuel used in houses and condos - Other fuel (%)
House heating fuel used in houses and condos - No fuel used (%)
House heating fuel used in apartments - Utility gas (%)
House heating fuel used in apartments - Bottled, tank, or LP gas (%)
House heating fuel used in apartments - Electricity (%)
House heating fuel used in apartments - Fuel oil, kerosene, etc. (%)
House heating fuel used in apartments - Coal or coke (%)
House heating fuel used in apartments - Wood (%)
House heating fuel used in apartments - Solar energy (%)
House heating fuel used in apartments - Other fuel (%)
House heating fuel used in apartments - No fuel used (%)
Armed forces status - In Armed Forces (%)
Armed forces status - Civilian (%)
Armed forces status - Civilian - Veteran (%)
Armed forces status - Civilian - Nonveteran (%)
Fatal accidents locations in years 2005-2021
Fatal accidents locations in 2005
Fatal accidents locations in 2006
Fatal accidents locations in 2007
Fatal accidents locations in 2008
Fatal accidents locations in 2009
Fatal accidents locations in 2010
Fatal accidents locations in 2011
Fatal accidents locations in 2012
Fatal accidents locations in 2013
Fatal accidents locations in 2014
Fatal accidents locations in 2015
Fatal accidents locations in 2016
Fatal accidents locations in 2017
Fatal accidents locations in 2018
Fatal accidents locations in 2019
Fatal accidents locations in 2020
Fatal accidents locations in 2021
Alcohol use - People drinking some alcohol every month (%)
Alcohol use - People not drinking at all (%)
Alcohol use - Average days/month drinking alcohol
Alcohol use - Average drinks/week
Alcohol use - Average days/year people drink much
Audiometry - Average condition of hearing (%)
Audiometry - People that can hear a whisper from across a quiet room (%)
Audiometry - People that can hear normal voice from across a quiet room (%)
Audiometry - Ears ringing, roaring, buzzing (%)
Audiometry - Had a job exposure to loud noise (%)
Audiometry - Had off-work exposure to loud noise (%)
Blood Pressure & Cholesterol - Has high blood pressure (%)
Blood Pressure & Cholesterol - Checking blood pressure at home (%)
Blood Pressure & Cholesterol - Frequently checking blood cholesterol (%)
Blood Pressure & Cholesterol - Has high cholesterol level (%)
Consumer Behavior - Money monthly spent on food at supermarket/grocery store
Consumer Behavior - Money monthly spent on food at other stores
Consumer Behavior - Money monthly spent on eating out
Consumer Behavior - Money monthly spent on carryout/delivered foods
Consumer Behavior - Income spent on food at supermarket/grocery store (%)
Consumer Behavior - Income spent on food at other stores (%)
Consumer Behavior - Income spent on eating out (%)
Consumer Behavior - Income spent on carryout/delivered foods (%)
Current Health Status - General health condition (%)
Current Health Status - Blood donors (%)
Current Health Status - Has blood ever tested for HIV virus (%)
Current Health Status - Left-handed people (%)
Dermatology - People using sunscreen (%)
Diabetes - Diabetics (%)
Diabetes - Had a blood test for high blood sugar (%)
Diabetes - People taking insulin (%)
Diet Behavior & Nutrition - Diet health (%)
Diet Behavior & Nutrition - Milk product consumption (# of products/month)
Diet Behavior & Nutrition - Meals not home prepared (#/week)
Diet Behavior & Nutrition - Meals from fast food or pizza place (#/week)
Diet Behavior & Nutrition - Ready-to-eat foods (#/month)
Diet Behavior & Nutrition - Frozen meals/pizza (#/month)
Drug Use - People that ever used marijuana or hashish (%)
Drug Use - Ever used hard drugs (%)
Drug Use - Ever used any form of cocaine (%)
Drug Use - Ever used heroin (%)
Drug Use - Ever used methamphetamine (%)
Health Insurance - People covered by health insurance (%)
Kidney Conditions-Urology - Avg. # of times urinating at night
Medical Conditions - People with asthma (%)
Medical Conditions - People with anemia (%)
Medical Conditions - People with psoriasis (%)
Medical Conditions - People with overweight (%)
Medical Conditions - Elderly people having difficulties in thinking or remembering (%)
Medical Conditions - People who ever received blood transfusion (%)
Medical Conditions - People having trouble seeing even with glass/contacts (%)
Medical Conditions - People with arthritis (%)
Medical Conditions - People with gout (%)
Medical Conditions - People with congestive heart failure (%)
Medical Conditions - People with coronary heart disease (%)
Medical Conditions - People with angina pectoris (%)
Medical Conditions - People who ever had heart attack (%)
Medical Conditions - People who ever had stroke (%)
Medical Conditions - People with emphysema (%)
Medical Conditions - People with thyroid problem (%)
Medical Conditions - People with chronic bronchitis (%)
Medical Conditions - People with any liver condition (%)
Medical Conditions - People who ever had cancer or malignancy (%)
Mental Health - People who have little interest in doing things (%)
Mental Health - People feeling down, depressed, or hopeless (%)
Mental Health - People who have trouble sleeping or sleeping too much (%)
Mental Health - People feeling tired or having little energy (%)
Mental Health - People with poor appetite or overeating (%)
Mental Health - People feeling bad about themself (%)
Mental Health - People who have trouble concentrating on things (%)
Mental Health - People moving or speaking slowly or too fast (%)
Mental Health - People having thoughts they would be better off dead (%)
Oral Health - Average years since last visit a dentist
Oral Health - People embarrassed because of mouth (%)
Oral Health - People with gum disease (%)
Oral Health - General health of teeth and gums (%)
Oral Health - Average days a week using dental floss/device
Oral Health - Average days a week using mouthwash for dental problem
Oral Health - Average number of teeth
Pesticide Use - Households using pesticides to control insects (%)
Pesticide Use - Households using pesticides to kill weeds (%)
Physical Activity - People doing vigorous-intensity work activities (%)
Physical Activity - People doing moderate-intensity work activities (%)
Physical Activity - People walking or bicycling (%)
Physical Activity - People doing vigorous-intensity recreational activities (%)
Physical Activity - People doing moderate-intensity recreational activities (%)
Physical Activity - Average hours a day doing sedentary activities
Physical Activity - Average hours a day watching TV or videos
Physical Activity - Average hours a day using computer
Physical Functioning - People having limitations keeping them from working (%)
Physical Functioning - People limited in amount of work they can do (%)
Physical Functioning - People that need special equipment to walk (%)
Physical Functioning - People experiencing confusion/memory problems (%)
Physical Functioning - People requiring special healthcare equipment (%)
Prescription Medications - Average number of prescription medicines taking
Preventive Aspirin Use - Adults 40+ taking low-dose aspirin (%)
Reproductive Health - Vaginal deliveries (%)
Reproductive Health - Cesarean deliveries (%)
Reproductive Health - Deliveries resulted in a live birth (%)
Reproductive Health - Pregnancies resulted in a delivery (%)
Reproductive Health - Women breastfeeding newborns (%)
Reproductive Health - Women that had a hysterectomy (%)
Reproductive Health - Women that had both ovaries removed (%)
Reproductive Health - Women that have ever taken birth control pills (%)
Reproductive Health - Women taking birth control pills (%)
Reproductive Health - Women that have ever used Depo-Provera or injectables (%)
Reproductive Health - Women that have ever used female hormones (%)
Sexual Behavior - People 18+ that ever had sex (vaginal, anal, or oral) (%)
Sexual Behavior - Males 18+ that ever had vaginal sex with a woman (%)
Sexual Behavior - Males 18+ that ever performed oral sex on a woman (%)
Sexual Behavior - Males 18+ that ever had anal sex with a woman (%)
Sexual Behavior - Males 18+ that ever had any sex with a man (%)
Sexual Behavior - Females 18+ that ever had vaginal sex with a man (%)
Sexual Behavior - Females 18+ that ever performed oral sex on a man (%)
Sexual Behavior - Females 18+ that ever had anal sex with a man (%)
Sexual Behavior - Females 18+ that ever had any kind of sex with a woman (%)
Sexual Behavior - Average age people first had sex
Sexual Behavior - Average number of female sex partners in lifetime (males 18+)
Sexual Behavior - Average number of female vaginal sex partners in lifetime (males 18+)
Sexual Behavior - Average age people first performed oral sex on a woman (18+)
Sexual Behavior - Average number of woman performed oral sex on in lifetime (18+)
Sexual Behavior - Average number of male sex partners in lifetime (males 18+)
Sexual Behavior - Average number of male anal sex partners in lifetime (males 18+)
Sexual Behavior - Average age people first performed oral sex on a man (18+)
Sexual Behavior - Average number of male oral sex partners in lifetime (18+)
Sexual Behavior - People using protection when performing oral sex (%)
Sexual Behavior - Average number of times people have vaginal or anal sex a year
Sexual Behavior - People having sex without condom (%)
Sexual Behavior - Average number of male sex partners in lifetime (females 18+)
Sexual Behavior - Average number of male vaginal sex partners in lifetime (females 18+)
Sexual Behavior - Average number of female sex partners in lifetime (females 18+)
Sexual Behavior - Circumcised males 18+ (%)
Sleep Disorders - Average hours sleeping at night
Sleep Disorders - People that has trouble sleeping (%)
Smoking-Cigarette Use - People smoking cigarettes (%)
Taste & Smell - People 40+ having problems with smell (%)
Taste & Smell - People 40+ having problems with taste (%)
Taste & Smell - People 40+ that ever had wisdom teeth removed (%)
Taste & Smell - People 40+ that ever had tonsils teeth removed (%)
Taste & Smell - People 40+ that ever had a loss of consciousness because of a head injury (%)
Taste & Smell - People 40+ that ever had a broken nose or other serious injury to face or skull (%)
Taste & Smell - People 40+ that ever had two or more sinus infections (%)
Weight - Average height (inches)
Weight - Average weight (pounds)
Weight - Average BMI
Weight - People that are obese (%)
Weight - People that ever were obese (%)
Weight - People trying to lose weight (%)
100%
urban population.
Estimated median house/condo value in 2022: $1,037,311
95121:
$1,037,311California:
$715,900
According to our research of California and other state lists, there were 45 registered sex offenders living in 95121 zip code as of April 26, 2024 . The ratio of all residents to sex offenders in zip code 95121 is 867 to 1.The ratio of registered sex offenders to all residents in this zip code is near the state average.
Median resident age: This zip code:
43.3 yearsCalifornia median age:
37.9 years
Average household size: This zip code:
3.6 peopleCalifornia:
2.8 people
Averages for the 2020 tax year for zip code 95121, filed in 2021:
Average Adjusted Gross Income (AGI) in 2020: $85,029 (Individual Income Tax Returns) Here:
$85,029State:
$95,910
Salary/wage: $78,493 (reported on 85.1% of returns )Here:
$78,493State:
$77,331
(% of AGI for various income ranges: 1132.4% for AGIs below $25k , 4100.1% for AGIs $25k-50k , 7576.1% for AGIs $50k-75k , 11503.5% for AGIs $75k-100k , 21924.8% for AGIs $100k-200k , 116950.7% for AGIs over 200k ) Taxable interest for individuals: $995 (reported on 33.3% of returns )This zip code:
$995California:
$2,294
(% of AGI for various income ranges: 13.0% for AGIs below $25k , 18.4% for AGIs $25k-50k , 39.9% for AGIs $50k-75k , 45.4% for AGIs $75k-100k , 108.0% for AGIs $100k-200k , 556.9% for AGIs over 200k ) Ordinary dividends: $3,294 (reported on 18.6% of returns )(% of AGI for various income ranges: 10.7% for AGIs below $25k , 16.5% for AGIs $25k-50k , 26.7% for AGIs $50k-75k , 79.5% for AGIs $75k-100k , 160.1% for AGIs $100k-200k , 1661.9% for AGIs over 200k ) Net capital gain/loss in AGI: +$24,371 (reported on 21.5% of returns )Here:
+$24,371State:
+$49,306
(% of AGI for various income ranges: 17.4% for AGIs below $25k , 21.9% for AGIs $25k-50k , 77.3% for AGIs $50k-75k , 207.9% for AGIs $75k-100k , 657.3% for AGIs $100k-200k , 20389.5% for AGIs over 200k ) Profit/loss from business: +$10,747 (reported on 15.0% of returns )Here:
+$10,747State:
+$15,671
(% of AGI for various income ranges: 148.2% for AGIs below $25k , 185.7% for AGIs $25k-50k , 191.6% for AGIs $50k-75k , 317.4% for AGIs $75k-100k , 436.3% for AGIs $100k-200k , 1371.2% for AGIs over 200k ) Taxable individual retirement arrangement distribution: $17,748 (reported on 4.7% of returns )95121:
$17,748California:
$23,505
(% of AGI for various income ranges: 34.8% for AGIs below $25k , 59.5% for AGIs $25k-50k , 89.3% for AGIs $50k-75k , 185.0% for AGIs $75k-100k , 371.0% for AGIs $100k-200k , 754.5% for AGIs over 200k ) Self-employed (Keogh) retirement plans: $17,086 (reported on 0.4% of returns )95121:
$17,086California:
$30,163
(% of AGI for various income ranges: 42.1% for AGIs $75k-100k , 167.6% for AGIs over 200k ) Total itemized deductions: $31,006 (reported on 15.2% of returns )Here:
$31,006State:
$39,517
(% of AGI for various income ranges: 79.3% for AGIs below $25k , 205.5% for AGIs $25k-50k , 476.1% for AGIs $50k-75k , 911.5% for AGIs $75k-100k , 1939.2% for AGIs $100k-200k , 7496.2% for AGIs over 200k ) Charity contributions: $4,783 (reported on 12.2% of returns )(% of AGI for various income ranges: 3.4% for AGIs below $25k , 15.7% for AGIs $25k-50k , 51.2% for AGIs $50k-75k , 102.2% for AGIs $75k-100k , 236.0% for AGIs $100k-200k , 1136.4% for AGIs over 200k ) Taxes paid: $9,352 (reported on 15.2% of returns )(% of AGI for various income ranges: 23.8% for AGIs below $25k , 60.1% for AGIs $25k-50k , 152.7% for AGIs $50k-75k , 306.2% for AGIs $75k-100k , 613.9% for AGIs $100k-200k , 2013.8% for AGIs over 200k ) Earned income credit: $1,825 (reported on 12.5% of returns )(% of AGI for various income ranges: 78.7% for AGIs below $25k , 54.5% for AGIs $25k-50k , 0.4% for AGIs $50k-75k ) Percentage of individuals using paid preparers for their 2020 taxes: 90.6%(% for various income ranges: 88.9% for AGIs below $25k , 91.4% for AGIs $25k-50k , 89.8% for AGIs $50k-75k , 91.7% for AGIs $75k-100k , 90.9% for AGIs $100k-200k , 93.5% for AGIs over 200k )
Averages for the 2012 tax year for zip code 95121, filed in 2013:
Average Adjusted Gross Income (AGI) in 2012: $57,545 (Individual Income Tax Returns) Here:
$57,545State:
$72,726
Salary/wage: $54,937 (reported on 87.2% of returns )Here:
$54,937State:
$59,079
(% of AGI for various income ranges: 75.6% for AGIs below $25k , 85.6% for AGIs $25k-50k , 84.5% for AGIs $50k-75k , 83.8% for AGIs $75k-100k , 86.0% for AGIs $100k-200k , 79.4% for AGIs over 200k ) Taxable interest for individuals: $632 (reported on 32.2% of returns )This zip code:
$632California:
$2,146
(% of AGI for various income ranges: 0.4% for AGIs below $25k , 0.3% for AGIs $25k-50k , 0.4% for AGIs $50k-75k , 0.3% for AGIs $75k-100k , 0.3% for AGIs $100k-200k , 0.5% for AGIs over 200k ) Ordinary dividends: $2,876 (reported on 14.1% of returns )(% of AGI for various income ranges: 0.4% for AGIs below $25k , 0.3% for AGIs $25k-50k , 0.4% for AGIs $50k-75k , 0.6% for AGIs $75k-100k , 0.7% for AGIs $100k-200k , 1.4% for AGIs over 200k ) Net capital gain/loss in AGI: +$4,392 (reported on 14.7% of returns )Here:
+$4,392State:
+$30,460
(% of AGI for various income ranges: 0.7% for AGIs $100k-200k , 4.7% for AGIs over 200k ) Profit/loss from business: +$13,721 (reported on 15.3% of returns )Here:
+$13,721State:
+$17,064
(% of AGI for various income ranges: 11.7% for AGIs below $25k , 4.4% for AGIs $25k-50k , 3.1% for AGIs $50k-75k , 2.7% for AGIs $75k-100k , 2.7% for AGIs $100k-200k , 2.2% for AGIs over 200k ) Taxable individual retirement arrangement distribution: $15,290 (reported on 5.0% of returns )95121:
$15,290California:
$19,557
(% of AGI for various income ranges: 1.7% for AGIs below $25k , 1.4% for AGIs $25k-50k , 1.6% for AGIs $50k-75k , 1.7% for AGIs $75k-100k , 1.4% for AGIs $100k-200k , 0.7% for AGIs over 200k ) Self-employment retirement plans: $14,886 (reported on 0.4% of returns )95121:
$14,886California:
$24,530
Total itemized deductions: $27,749 (25% of AGI, reported on 34.1% of returns )Here:
$27,749State:
$34,004
Here:
25.0% of AGIState:
22.7% of AGI
(% of AGI for various income ranges: 9.3% for AGIs below $25k , 11.8% for AGIs $25k-50k , 16.0% for AGIs $50k-75k , 19.3% for AGIs $75k-100k , 19.9% for AGIs $100k-200k , 16.8% for AGIs over 200k ) Charity contributions: $2,390 (reported on 26.9% of returns )(% of AGI for various income ranges: 0.4% for AGIs below $25k , 0.7% for AGIs $25k-50k , 1.0% for AGIs $50k-75k , 1.3% for AGIs $75k-100k , 1.5% for AGIs $100k-200k , 1.2% for AGIs over 200k ) Taxes paid: $11,560 (reported on 34.1% of returns )95121:
$11,560State:
$14,448
(% of AGI for various income ranges: 2.4% for AGIs below $25k , 3.4% for AGIs $25k-50k , 5.2% for AGIs $50k-75k , 6.9% for AGIs $75k-100k , 8.6% for AGIs $100k-200k , 9.9% for AGIs over 200k ) Earned income credit: $2,059 (reported on 19.3% of returns )(% of AGI for various income ranges: 6.6% for AGIs below $25k , 1.0% for AGIs $25k-50k ) Percentage of individuals using paid preparers for their 2012 taxes: 68.5%(% for various income ranges: 67.5% for AGIs below $25k , 70.8% for AGIs $25k-50k , 69.7% for AGIs $50k-75k , 70.1% for AGIs $75k-100k , 66.7% for AGIs $100k-200k , 60.3% for AGIs over 200k )
Averages for the 2004 tax year for zip code 95121, filed in 2005:
Average Adjusted Gross Income (AGI) in 2004: $47,921 (Individual Income Tax Returns) Here:
$47,921State:
$58,600
Salary/wage: $46,737 (reported on 89.2% of returns )Here:
$46,737State:
$49,455
(% of AGI for various income ranges: 103.8% for AGIs below $10k , 81.8% for AGIs $10k-25k , 89.0% for AGIs $25k-50k , 88.7% for AGIs $50k-75k , 89.9% for AGIs $75k-100k , 84.3% for AGIs over 100k ) Taxable interest for individuals: $677 (reported on 41.2% of returns )This zip code:
$677California:
$2,365
(% of AGI for various income ranges: 3.0% for AGIs below $10k , 0.8% for AGIs $10k-25k , 0.5% for AGIs $25k-50k , 0.6% for AGIs $50k-75k , 0.5% for AGIs $75k-100k , 0.5% for AGIs over 100k ) Taxable dividends: $1,094 (reported on 15.0% of returns )(% of AGI for various income ranges: 1.4% for AGIs below $10k , 0.4% for AGIs $10k-25k , 0.2% for AGIs $25k-50k , 0.2% for AGIs $50k-75k , 0.4% for AGIs $75k-100k , 0.4% for AGIs over 100k ) Net capital gain/loss: +$2,973 (reported on 18.2% of returns )Here:
+$2,973State:
+$23,418
(% of AGI for various income ranges: -1.2% for AGIs below $10k , -0.2% for AGIs $10k-25k , -0.1% for AGIs $25k-50k , -0.2% for AGIs $50k-75k , 0.5% for AGIs $75k-100k , 3.1% for AGIs over 100k ) Profit/loss from business: +$14,102 (reported on 15.5% of returns )Here:
+$14,102State:
+$16,826
(% of AGI for various income ranges: 8.5% for AGIs below $10k , 8.6% for AGIs $10k-25k , 4.4% for AGIs $25k-50k , 3.8% for AGIs $50k-75k , 2.9% for AGIs $75k-100k , 4.8% for AGIs over 100k ) IRA payment deduction: $3,179 (reported on 1.7% of returns )95121:
$3,179California:
$3,192
(% of AGI for various income ranges: 0.2% for AGIs $10k-25k , 0.2% for AGIs $25k-50k , 0.1% for AGIs $50k-75k , 0.1% for AGIs $75k-100k , 0.1% for AGIs over 100k ) Self-employed pension: $13,494 (reported on 0.5% of returns )Here:
$13,494California:
$17,688
(% of AGI for various income ranges: 0.1% for AGIs $10k-25k , 0.1% for AGIs $50k-75k , 0.1% for AGIs $75k-100k , 0.3% for AGIs over 100k ) Total itemized deductions: $26,261 (32% of AGI, reported on 40.5% of returns )Here:
$26,261State:
$28,113
Here:
31.6% of AGIState:
25.3% of AGI
(% of AGI for various income ranges: 19.8% for AGIs below $10k , 13.8% for AGIs $10k-25k , 20.0% for AGIs $25k-50k , 25.0% for AGIs $50k-75k , 26.1% for AGIs $75k-100k , 22.3% for AGIs over 100k ) Charity contributions deductions: $2,118 (2% of AGI, reported on 34.5% of returns )Here:
2.4% of AGIState:
3.3% of AGI
(% of AGI for various income ranges: 0.5% for AGIs below $10k , 0.6% for AGIs $10k-25k , 1.1% for AGIs $25k-50k , 1.7% for AGIs $50k-75k , 1.9% for AGIs $75k-100k , 1.7% for AGIs over 100k ) Total tax: $6,639 (reported on 73.9% of returns )95121:
$6,639State:
$10,761
(% of AGI for various income ranges: 4.3% for AGIs below $10k , 4.2% for AGIs $10k-25k , 6.2% for AGIs $25k-50k , 7.9% for AGIs $50k-75k , 8.8% for AGIs $75k-100k , 15.8% for AGIs over 100k ) Earned income credit: $1,621 (reported on 15.5% of returns )Percentage of individuals using paid preparers for their 2004 taxes: 68.9%(% for various income ranges: 61.7% for AGIs below $10k , 70.6% for AGIs $10k-25k , 72.1% for AGIs $25k-50k , 71.7% for AGIs $50k-75k , 70.2% for AGIs $75k-100k , 65.0% for AGIs over 100k )
Estimated median household income in 2022: This zip code:
$127,940California:
$91,551
Nearest zip codes: 95111 ,
95122 ,
95148 ,
95136 ,
95116 ,
95123 .
San Jose Zip Code Map
Percentage of family households: This zip code:
50.0%California:
46.8%
Percentage of households with unmarried partners: This zip code:
4.7%California:
48.1%
Likely homosexual households (counted as self-reported same-sex unmarried-partner households)
Lesbian couples: 0.2% of all households Gay men: 0.1% of all households
Household received Food Stamps/SNAP in the past 12 months: 1,223Household did not receive Food Stamps/SNAP in the past 12 months: 8,766
Women who had a birth in the past 12 months: 293 (262 now married , 30 unmarried) Women who did not have a birth in the past 12 months: 7,523 (2,956 now married , 4,568 unmarried)
Housing units in zip code 95121 with a mortgage: 4,738 (460
second mortgage , 10
home equity loan , 395
both second mortgage and home equity loan )
Houses without a mortgage: 112
Median monthly owner costs for units with a mortgage: $3,175
Median monthly owner costs for units without a mortgage: $1,000
Residents with income below the poverty level in 2022:
This zip code:
8.3%Whole state:
12.2%
Residents with income below 50% of the poverty level in 2022:
This zip code:
4.2%Whole state:
6.2%
Median number of rooms in houses and condos: Median number of rooms in apartments:
Year house built (houses)
0 2020 or later177 2010 to 2019587 2000 to 2009725 1990 to 19991,559 1980 to 19894,449 1970 to 19792,065 1960 to 1969208 1950 to 195960 1940 to 194928 1939 or earlier
Zip code 95121 household income distribution in 2022 318 Less than $10,000210 $10,000 to $14,999158 $15,000 to $19,999162 $20,000 to $24,999154 $25,000 to $29,999213 $30,000 to $34,999185 $35,000 to $39,999256 $40,000 to $44,999167 $45,000 to $49,999389 $50,000 to $59,999648 $60,000 to $74,9991,013 $75,000 to $99,999990 $100,000 to $124,999833 $125,000 to $149,9991,494 $150,000 to $199,9992,813 $200,000 or moreEstimate of home value of owner-occupied houses/condos in 2022 in zip code 95121 28 Less than $10,00056 $40,000 to $49,99922 $50,000 to $59,99922 $60,000 to $69,99913 $70,000 to $79,9991 $80,000 to $89,99972 $100,000 to $124,9998 $125,000 to $149,99917 $150,000 to $174,99913 $175,000 to $199,999148 $200,000 to $249,99919 $250,000 to $299,999111 $300,000 to $399,999105 $400,000 to $499,999856 $500,000 to $749,9992,896 $750,000 to $999,9992,470 $1,000,000 to $1,499,999636 $1,500,000 to $1,999,999558 $2,000,000 or moreRent paid by renters in 2022 in zip code 95121 24 $200 to $24955 $250 to $29922 $300 to $34925 $350 to $39955 $500 to $54938 $550 to $59963 $600 to $6496 $650 to $69939 $700 to $74935 $800 to $89946 $1,000 to $1,24940 $1,250 to $1,499257 $1,500 to $1,999355 $2,000 to $2,499467 $2,500 to $2,999577 $3,000 to $3,499243 $3,500 or more204 No cash rent
Median gross rent in 2022: $2,811.
Median price asked for vacant for-sale houses and condos in 2022: $698,153.
Estimated median house (or condo) value in 2022 for: White Non-Hispanic householders: $1,034,463Black or African American householders: $1,082,246American Indian or Alaska Native householders: $1,562,612Asian householders: $1,091,739Native Hawaiian and other Pacific Islander householders: $1,100,600Some other race householders: $1,050,601Two or more races householders: $1,144,902Hispanic or Latino householders: $1,066,107Estimated median house or condo value in 2022: $1,037,311
95121:
$1,037,311California:
$715,900
Lower value quartile - upper value quartile: $859,363 - $1,309,095
Mean price in 2022: Detached houses: $1,292,873Here:
$1,292,873State:
$988,808
Townhouses or other attached units: $787,367Here:
$787,367State:
$838,546
In 3-to-4-unit structures: $668,056Here:
$668,056State:
$824,253
In 5-or-more-unit structures: $524,516Here:
$524,516State:
$730,996
Mobile homes: $206,723Here:
$206,723State:
$184,506
Housing units in structures:
One, detached: 7,521One, attached: 1,283Two: 333 or 4: 695 to 9: 13810 to 19: 17420 to 49: 12450 or more: 277Mobile homes: 508Unemployment : 5.5%
Means of transportation to work in zip code 95121 66.5% 11,654 Drove a car alone13.9% 2,436 Carpooled1.2% 216 Bus or trolley bus0.5% 79 Subway or elevated0.1% 16 Railroad0.2% 28 Taxi0.0% 8 Motorcycle0.0% 3 Bicycle0.8% 143 Walked0.5% 83 Other means16.5% 2,886 Worked at homeTravel time to work (commute) in zip code 95121 108 Less than 5 minutes567 5 to 9 minutes1,285 10 to 14 minutes2,150 15 to 19 minutes2,597 20 to 24 minutes711 25 to 29 minutes3,034 30 to 34 minutes271 35 to 39 minutes725 40 to 44 minutes1,531 45 to 59 minutes1,182 60 to 89 minutes433 90 or more minutes
Neighborhoods in zip code 95121: Percentage of zip code residents living and working in this county: 90.1%
Household type by relationship:
Households: 36,352
Male householders: 5,440 (334 living alone ), Female householders: 4,554 (473 living alone )6,055 spouses (6,034 opposite-sex spouses ), 524 unmarried partners , (519 opposite-sex unmarried partners ), 10,809 children (10,524 natural , 101 adopted , 187 stepchildren ), 989 grandchildren , 1,450 brothers or sisters , 2,335 parents , 0 foster children , 1,806 other relatives , 1,481 non-relatives In group quarters: 798 (-1 institutionalized population )
Size of family households: 2,059 2-persons , 2,315 3-persons , 2,261 4-persons , 801 5-persons , 620 6-persons , 526 7-or-more-persons
Size of nonfamily households: 807 1-person , 419 2-persons , 81 3-persons , 6 4-persons
4,420 married couples with children. single-parent households (224 men , 865 women ).
30.2% of residents of 95121 zip code speak English at home. of residents speak Spanish at home (58% very well, 17% well, 21% not well, 4% not at all ).of residents speak other Indo-European language at home (63% very well, 21% well, 9% not well, 6% not at all ).of residents speak Asian or Pacific Island language at home (45% very well, 27% well, 21% not well, 6% not at all ).of residents speak other language at home (83% very well, 13% well, 4% not well ).
Foreign born population: 18,390 (50.6%)
(74.0%
of them are naturalized citizens )
This zip code:
50.6%Whole state:
26.7%
50% Thailand 15% Honduras 13% Bhutan 11% Malaysia 1% Sweden 1% Guyana 1% Costa Rica 1% German 1% English 1% American 1% Irish 0% Portuguese 0% Italian 0% Egyptian
Year of entry for the foreign-born population
3,840 2010 or later 3,506 2000 to 2009 4,886 1990 to 1999 6,867 Before 1990
There are
128 Medical Specialists in Zip Code 95121 .
Facilities with environmental interests located in this zip code:
GENESIS HIGH (CONT.) (3434 SILVER CREEK ROAD in SAN JOSE, CA)
(National Center for Education Statistics) - STATE ID-4330346 Organizations: EAST SIDE UNION HIGH (SCHOOL DISTRICT)
LAURELWOOD ELEMENTARY (4280 PARTRIDGE DR. in SAN JOSE, CA)
(National Center for Education Statistics) - STATE ID-6071534 Organizations: EVERGREEN ELEMENTARY (SCHOOL DISTRICT)
MONTGOMERY (JOHN J.) ELEMENTARY (2010 DANIEL MALONEY DR. in SAN JOSE, CA)
(National Center for Education Statistics) - STATE ID-6095988 Organizations: EVERGREEN ELEMENTARY (SCHOOL DISTRICT)
CADWALLADER ELEMENTARY (3799 CADWALLADER ROAD in SAN JOSE, CA)
(National Center for Education Statistics) - STATE ID-6047120 Organizations: EVERGREEN ELEMENTARY (SCHOOL DISTRICT)
AER DAN PRECISION (1458 SEAREEL PL in SAN JOSE, CA)
Small Quantity Generators, between 100 kg and 1000 kg of hazardous waste/month (Resource Conservation and Recovery Act (tracking hazardous waste)) Organizations: STEVE MARTIN (CONTACT/OWNER)
EVERGREEN CLEANERS (3311 S WHITE RD in SAN JOSE, CA)
Small Quantity Generators, between 100 kg and 1000 kg of hazardous waste/month (Resource Conservation and Recovery Act (tracking hazardous waste)) Organizations: BOO LEE (CONTACT/OWNER)
ABORNS 1 HR PHOTO (2770 ABORN RD in SAN JOSE, CA)
Small Quantity Generators, between 100 kg and 1000 kg of hazardous waste/month (Resource Conservation and Recovery Act (tracking hazardous waste)) - notification Organizations: MOHAMED FAROUK (CONTACT/OWNER)
FREDRICK PORTILLO (2719 KENDRICK CIR in SAN JOSE, CA)
TRANSPORTER (Resource Conservation and Recovery Act (tracking hazardous waste)) - notification
NUCKTON (NIEMAN BLVD NR CAPITOL EXPWY in SAN JOSE, CA)
Small Quantity Generators, between 100 kg and 1000 kg of hazardous waste/month (Resource Conservation and Recovery Act (tracking hazardous waste))
Housing units lacking complete plumbing facilities: 0.3%
Housing units lacking complete kitchen facilities: 0.4%
62.6% Utility gas 28.7% Electricity 3.2% Bottled, tank, or LP gas 2.8% Solar energy 2.1% No fuel used
Population in 1990: 32,572. Population change in the 1990s: +4,554 (+14.0%).
Place of birth for U.S.-born residents:
This state: 15,354Northeast: 438Midwest: 393South: 682West: 421
62% of the 95121 zip code residents lived in the same house 5 years ago.
Out of people who lived in different houses, 83% lived in this county.
Out of people who lived in different counties, 50% lived in California.
95% of the 95121 zip code residents lived in the same house 1 year ago.
Out of people who lived in different houses, 75% moved from this county.
Out of people who lived in different houses, 11% moved from different county within same state.
Out of people who lived in different houses, 2% moved from different state.
Out of people who lived in different houses, 18% moved from abroad.
Private vs. public school enrollment:
Students in private schools in grades 1 to 8 (elementary and middle school): 167
Here:
5.3%California:
10.5%
Students in private schools in grades 9 to 12 (high school): 162
Students in private undergraduate colleges: 185
Here:
7.9%California:
15.9%
Occupation by median earnings in the past 12 months ($)
127,977 Architecture and engineering occupations 120,977 Computer and mathematical occupations 113,569 Management occupations 109,663 Health diagnosing and treating practitioners and other technical occupations 89,120 Business and financial operations occupations 82,619 Legal occupations
Companies with federal contracts located in this zip code:
TELECOMM1STOP LLC (1331 ERINWOOD CT in SAN JOSE, CA; small business) in 35 contracts from 2003 to 2006
Contracts for Radio and Television Communication Equipment, Except Airborne, Other ADP and Telecommunications Services (includes data storage on tapes, compact disks, etc.), Medical and Surgical Instruments, Equipment, and Supplies, Other Cryptologic Equipment and Components, and more by Air Force, ENERGY, Department of, Department of Veterans Affairs, Defense Contract Management Agency, and others Signed by year: 2000: $0; 2001: $0; 2002: $0; 2003: $31,097; 2004: $248,191; 2005: $188,329; 2006: $748,365.
Biggest contracts: with Air Force for Radio and Television Communication Equipment, Except Airborne. Signed on 2003-08-01. Completion date: 2003-08-15.
with ENERGY, Department of for Other ADP and Telecommunications Services (includes data storage on tapes, compact disks, etc.). Signed on 2006-06-26. Completion date: 2007-06-29.
with Department of Veterans Affairs for Medical and Surgical Instruments, Equipment, and Supplies. Signed on 2006-01-10. Completion date: 2006-02-10.
, same as above. Signed on 2005-12-20. Completion date: 2006-01-31.
MULLAPUDI TECHNOLOGIES (2117 SHIANGZONE COURT in SAN JOSE, CA; small business)
$99,200 with Air Force for Blocks, Tackle, Rigging, and Slings. Signed on 2003-05-02. Completion date: 2003-09-30.
Top industries in this zip code by the number of employees in 2005:
Accommodation and Food Services: Full-Service Restaurants (50-99 employees: 3 establishments, 20-49 employees: 2 establishments, 10-19 employees: 3 establishments, 5-9 employees: 3 establishments, 1-4 employees: 5 establishments)Accommodation and Food Services: Limited-Service Restaurants (50-99: 1, 20-49: 3, 10-19: 4, 5-9: 4, 1-4: 6)Health Care and Social Assistance: Nursing Care Facilities (100-249: 1, 10-19: 2, 1-4: 1)Health Care and Social Assistance: Services for the Elderly and Persons with Disabilities (20-49: 2, 10-19: 1, 1-4: 1)Health Care and Social Assistance: Offices of Physicians (except Mental Health Specialists) (5-9: 8, 1-4: 10)Arts, Entertainment, and Recreation: Fitness and Recreational Sports Centers (50-99: 1, 1-4: 1)Professional, Scientific, and Technical Services: Tax Preparation Services (20-49: 2, 1-4: 3)
People in group quarters in 2010:
192 people in group homes intended for adults
158 people in nursing facilities/skilled-nursing facilities
80 people in workers' group living quarters and job corps centers
21 people in residential treatment centers for adults
19 people in group homes for juveniles (non-correctional)
8 people in other noninstitutional facilities
5 people in residential treatment centers for juveniles (non-correctional)
People in group quarters in 2000:
169 people in nursing homes
27 people in homes for the mentally retarded
23 people in religious group quarters
4 people in other noninstitutional group quarters
3 people in homes or halfway houses for drug/alcohol abuse
Fatal accident statistics in 2014:
Fatal accident count: 4Vehicles involved in fatal accidents: 4Fatal accidents caused by drunken drivers: 1Fatalities: 4Persons involved in fatal accidents: 5Pedestrians involved in fatal accidents: 3
Fatal accident statistics in 2013:
Fatal accident count: 4Vehicles involved in fatal accidents: 6Fatal accidents caused by drunken drivers: 2Fatalities: 4Persons involved in fatal accidents: 8Pedestrians involved in fatal accidents: 2
Home Mortgage Disclosure Act Aggregated Statistics For Year 2009(Based on 8 full and 6 partial tracts) A) FHA, FSA/RHS & VA B) Conventional C) Refinancings D) Home Improvement Loans E) Loans on Dwellings For 5+ Families F) Non-occupant Loans on G) Loans On Manufactured Number Average Value Number Average Value Number Average Value Number Average Value Number Average Value Number Average Value Number Average Value
LOANS ORIGINATED 82 $337,375 566 $289,740 1,161 $312,472 35 $270,083 2 $7,570,080 128 $236,524 18 $76,542 APPLICATIONS APPROVED, NOT ACCEPTED 15 $338,657 96 $279,768 212 $334,302 9 $198,307 0 $0 14 $270,438 6 $87,567 APPLICATIONS DENIED 31 $259,463 199 $269,880 442 $361,464 25 $125,611 2 $7,529,115 57 $241,141 38 $65,070 APPLICATIONS WITHDRAWN 14 $382,921 100 $301,567 251 $346,750 14 $138,411 0 $0 52 $254,640 2 $122,580 FILES CLOSED FOR INCOMPLETENESS 0 $0 36 $307,957 77 $344,525 4 $35,902 0 $0 10 $271,492 2 $98,665
Aggregated Statistics For Year 2008(Based on 8 full and 6 partial tracts) A) FHA, FSA/RHS & VA B) Conventional C) Refinancings D) Home Improvement Loans F) Non-occupant Loans on G) Loans On Manufactured Number Average Value Number Average Value Number Average Value Number Average Value Number Average Value Number Average Value
LOANS ORIGINATED 26 $362,075 476 $333,100 722 $356,140 48 $183,714 121 $290,086 26 $93,735 APPLICATIONS APPROVED, NOT ACCEPTED 2 $324,045 163 $302,443 206 $380,937 12 $168,633 34 $285,977 30 $90,570 APPLICATIONS DENIED 10 $293,935 201 $329,298 585 $401,087 107 $205,295 76 $297,653 37 $98,756 APPLICATIONS WITHDRAWN 6 $295,145 82 $319,868 228 $395,511 31 $219,900 38 $267,465 0 $0 FILES CLOSED FOR INCOMPLETENESS 2 $590,985 28 $438,579 98 $408,756 2 $402,345 4 $441,872 0 $0
Aggregated Statistics For Year 2007(Based on 8 full and 6 partial tracts) B) Conventional C) Refinancings D) Home Improvement Loans F) Non-occupant Loans on G) Loans On Manufactured Number Average Value Number Average Value Number Average Value Number Average Value Number Average Value
LOANS ORIGINATED 579 $398,944 1,544 $417,366 151 $312,254 183 $353,049 24 $87,743 APPLICATIONS APPROVED, NOT ACCEPTED 161 $382,999 460 $402,807 39 $346,472 38 $338,715 12 $101,196 APPLICATIONS DENIED 381 $374,810 1,165 $440,840 151 $285,384 102 $362,602 27 $76,489 APPLICATIONS WITHDRAWN 142 $422,139 339 $423,999 23 $281,261 44 $386,124 4 $119,592 FILES CLOSED FOR INCOMPLETENESS 27 $343,738 140 $444,981 14 $326,117 7 $527,197 0 $0
Aggregated Statistics For Year 2006(Based on 8 full and 6 partial tracts) B) Conventional C) Refinancings D) Home Improvement Loans F) Non-occupant Loans on G) Loans On Manufactured Number Average Value Number Average Value Number Average Value Number Average Value Number Average Value
LOANS ORIGINATED 1,152 $386,018 2,021 $420,280 292 $342,340 180 $371,116 21 $113,002 APPLICATIONS APPROVED, NOT ACCEPTED 301 $368,795 492 $394,298 49 $363,896 34 $353,548 22 $69,523 APPLICATIONS DENIED 457 $382,022 1,006 $416,783 152 $262,141 85 $386,770 24 $93,659 APPLICATIONS WITHDRAWN 242 $380,288 536 $422,222 44 $249,910 41 $406,124 6 $231,132 FILES CLOSED FOR INCOMPLETENESS 52 $328,074 149 $407,529 23 $276,943 8 $330,200 0 $0
Aggregated Statistics For Year 2005(Based on 8 full and 6 partial tracts) B) Conventional C) Refinancings D) Home Improvement Loans E) Loans on Dwellings For 5+ Families F) Non-occupant Loans on G) Loans On Manufactured Number Average Value Number Average Value Number Average Value Number Average Value Number Average Value Number Average Value
LOANS ORIGINATED 1,673 $383,985 2,586 $389,885 280 $329,863 2 $1,394,820 269 $355,307 16 $84,492 APPLICATIONS APPROVED, NOT ACCEPTED 351 $354,272 478 $385,561 32 $241,582 0 $0 52 $340,486 29 $90,653 APPLICATIONS DENIED 592 $372,727 1,165 $381,643 191 $203,298 0 $0 92 $357,851 82 $97,958 APPLICATIONS WITHDRAWN 240 $381,311 689 $370,033 90 $300,226 0 $0 35 $379,517 4 $84,222 FILES CLOSED FOR INCOMPLETENESS 89 $415,581 225 $423,698 12 $155,870 0 $0 16 $422,528 0 $0
Aggregated Statistics For Year 2004(Based on 8 full and 6 partial tracts) B) Conventional C) Refinancings D) Home Improvement Loans F) Non-occupant Loans on G) Loans On Manufactured Number Average Value Number Average Value Number Average Value Number Average Value Number Average Value
LOANS ORIGINATED 1,697 $331,479 2,986 $328,207 203 $241,143 280 $285,220 32 $93,313 APPLICATIONS APPROVED, NOT ACCEPTED 369 $303,706 731 $328,307 35 $170,739 70 $301,764 31 $86,134 APPLICATIONS DENIED 544 $325,773 1,231 $330,603 93 $170,768 92 $305,415 35 $106,869 APPLICATIONS WITHDRAWN 229 $309,384 802 $320,346 63 $204,421 33 $286,952 4 $80,238 FILES CLOSED FOR INCOMPLETENESS 56 $312,169 247 $319,333 7 $231,397 27 $263,391 0 $0
Aggregated Statistics For Year 2003(Based on 8 full and 6 partial tracts) A) FHA, FSA/RHS & VA B) Conventional C) Refinancings D) Home Improvement Loans F) Non-occupant Loans on Number Average Value Number Average Value Number Average Value Number Average Value Number Average Value
LOANS ORIGINATED 0 $0 1,257 $307,526 5,994 $276,761 84 $69,720 454 $224,002 APPLICATIONS APPROVED, NOT ACCEPTED 0 $0 226 $282,256 1,502 $277,477 24 $49,527 115 $225,533 APPLICATIONS DENIED 2 $99,660 366 $293,372 1,467 $297,601 62 $64,249 125 $265,616 APPLICATIONS WITHDRAWN 2 $294,755 146 $315,826 1,301 $260,675 19 $82,292 55 $233,000 FILES CLOSED FOR INCOMPLETENESS 0 $0 34 $342,071 317 $327,363 8 $33,044 22 $269,306
Aggregated Statistics For Year 2002(Based on 6 full tracts) A) FHA, FSA/RHS & VA B) Conventional C) Refinancings D) Home Improvement Loans F) Non-occupant Loans on Number Average Value Number Average Value Number Average Value Number Average Value Number Average Value
LOANS ORIGINATED 0 $0 837 $271,937 2,411 $251,915 41 $88,618 226 $209,116 APPLICATIONS APPROVED, NOT ACCEPTED 4 $70,260 217 $309,577 515 $255,990 18 $105,747 51 $242,381 APPLICATIONS DENIED 0 $0 229 $247,212 596 $242,116 61 $41,715 53 $262,861 APPLICATIONS WITHDRAWN 2 $242,175 127 $263,784 491 $274,925 14 $42,171 18 $226,946 FILES CLOSED FOR INCOMPLETENESS 0 $0 43 $344,436 165 $307,165 2 $48,770 18 $267,228
Aggregated Statistics For Year 2001(Based on 6 full tracts) A) FHA, FSA/RHS & VA B) Conventional C) Refinancings D) Home Improvement Loans E) Loans on Dwellings For 5+ Families F) Non-occupant Loans on Number Average Value Number Average Value Number Average Value Number Average Value Number Average Value Number Average Value
LOANS ORIGINATED 0 $0 692 $254,544 1,902 $232,051 109 $65,143 0 $0 156 $208,558 APPLICATIONS APPROVED, NOT ACCEPTED 0 $0 201 $215,239 384 $221,590 20 $40,598 0 $0 22 $186,526 APPLICATIONS DENIED 0 $0 243 $246,114 605 $236,053 77 $41,879 0 $0 39 $216,773 APPLICATIONS WITHDRAWN 2 $219,250 119 $220,898 456 $231,263 20 $132,757 2 $182,380 18 $150,584 FILES CLOSED FOR INCOMPLETENESS 0 $0 34 $230,701 176 $226,119 12 $137,909 0 $0 14 $183,402
Aggregated Statistics For Year 2000(Based on 6 full tracts) A) FHA, FSA/RHS & VA B) Conventional C) Refinancings D) Home Improvement Loans E) Loans on Dwellings For 5+ Families F) Non-occupant Loans on Number Average Value Number Average Value Number Average Value Number Average Value Number Average Value Number Average Value
LOANS ORIGINATED 14 $199,596 665 $217,018 575 $193,142 143 $47,131 0 $0 73 $194,112 APPLICATIONS APPROVED, NOT ACCEPTED 0 $0 134 $171,641 125 $178,285 32 $53,857 0 $0 16 $206,024 APPLICATIONS DENIED 2 $139,875 225 $172,787 259 $167,264 73 $80,348 2 $101,910 26 $195,270 APPLICATIONS WITHDRAWN 2 $243,850 117 $214,419 140 $154,931 20 $79,162 0 $0 10 $91,389 FILES CLOSED FOR INCOMPLETENESS 0 $0 22 $253,515 172 $207,886 6 $25,537 0 $0 2 $175,570
Aggregated Statistics For Year 1999(Based on 2 full and 4 partial tracts) A) FHA, FSA/RHS & VA B) Conventional C) Refinancings D) Home Improvement Loans E) Loans on Dwellings For 5+ Families F) Non-occupant Loans on Number Average Value Number Average Value Number Average Value Number Average Value Number Average Value Number Average Value
LOANS ORIGINATED 18 $159,683 639 $222,636 838 $176,312 109 $29,202 0 $0 76 $135,019 APPLICATIONS APPROVED, NOT ACCEPTED 2 $189,160 124 $257,080 175 $164,246 18 $44,147 0 $0 17 $128,280 APPLICATIONS DENIED 2 $161,675 164 $208,919 264 $171,384 66 $33,127 0 $0 20 $128,536 APPLICATIONS WITHDRAWN 1 $248,430 96 $213,037 244 $171,342 7 $42,616 1 $296,470 11 $132,215 FILES CLOSED FOR INCOMPLETENESS 0 $0 28 $288,737 157 $160,952 2 $25,580 0 $0 6 $159,508
Private Mortgage Insurance Companies Aggregated Statistics For Year 2009(Based on 8 full and 6 partial tracts) A) Conventional B) Refinancings Number Average Value Number Average Value
LOANS ORIGINATED 51 $290,866 12 $349,876 APPLICATIONS APPROVED, NOT ACCEPTED 25 $318,259 4 $526,642 APPLICATIONS DENIED 14 $299,950 0 $0 APPLICATIONS WITHDRAWN 7 $269,813 0 $0 FILES CLOSED FOR INCOMPLETENESS 0 $0 0 $0
Aggregated Statistics For Year 2008(Based on 8 full and 6 partial tracts) A) Conventional B) Refinancings C) Non-occupant Loans on Number Average Value Number Average Value Number Average Value
LOANS ORIGINATED 65 $388,062 22 $393,617 0 $0 APPLICATIONS APPROVED, NOT ACCEPTED 29 $387,830 22 $456,430 0 $0 APPLICATIONS DENIED 18 $353,041 6 $414,782 3 $412,240 APPLICATIONS WITHDRAWN 7 $454,623 8 $505,985 0 $0 FILES CLOSED FOR INCOMPLETENESS 0 $0 0 $0 0 $0
Aggregated Statistics For Year 2007(Based on 8 full and 6 partial tracts) A) Conventional B) Refinancings Number Average Value Number Average Value
LOANS ORIGINATED 26 $480,623 22 $523,386 APPLICATIONS APPROVED, NOT ACCEPTED 8 $542,072 16 $511,738 APPLICATIONS DENIED 0 $0 6 $517,718 APPLICATIONS WITHDRAWN 10 $462,611 1 $849,370 FILES CLOSED FOR INCOMPLETENESS 0 $0 2 $652,635
Aggregated Statistics For Year 2006(Based on 8 full and 6 partial tracts) A) Conventional B) Refinancings Number Average Value Number Average Value
LOANS ORIGINATED 16 $561,539 19 $476,674 APPLICATIONS APPROVED, NOT ACCEPTED 4 $514,023 9 $455,420 APPLICATIONS DENIED 0 $0 2 $470,565 APPLICATIONS WITHDRAWN 0 $0 2 $448,900 FILES CLOSED FOR INCOMPLETENESS 0 $0 2 $466,410
Aggregated Statistics For Year 2005(Based on 4 full and 6 partial tracts) A) Conventional B) Refinancings C) Non-occupant Loans on Number Average Value Number Average Value Number Average Value
LOANS ORIGINATED 22 $429,878 15 $462,604 2 $304,325 APPLICATIONS APPROVED, NOT ACCEPTED 4 $489,588 4 $369,240 0 $0 APPLICATIONS DENIED 0 $0 4 $466,410 0 $0 APPLICATIONS WITHDRAWN 2 $282,865 2 $466,410 0 $0 FILES CLOSED FOR INCOMPLETENESS 2 $535,565 0 $0 0 $0
Aggregated Statistics For Year 2004(Based on 8 full and 6 partial tracts) A) Conventional B) Refinancings C) Non-occupant Loans on Number Average Value Number Average Value Number Average Value
LOANS ORIGINATED 25 $361,197 40 $368,650 2 $408,340 APPLICATIONS APPROVED, NOT ACCEPTED 13 $345,091 10 $408,424 4 $322,720 APPLICATIONS DENIED 0 $0 2 $388,675 0 $0 APPLICATIONS WITHDRAWN 0 $0 0 $0 0 $0 FILES CLOSED FOR INCOMPLETENESS 0 $0 0 $0 0 $0
Aggregated Statistics For Year 2003(Based on 8 full and 6 partial tracts) A) Conventional B) Refinancings C) Non-occupant Loans on Number Average Value Number Average Value Number Average Value
LOANS ORIGINATED 43 $299,916 34 $281,075 0 $0 APPLICATIONS APPROVED, NOT ACCEPTED 15 $409,631 22 $321,338 0 $0 APPLICATIONS DENIED 0 $0 2 $428,540 0 $0 APPLICATIONS WITHDRAWN 4 $270,672 6 $327,620 2 $324,810 FILES CLOSED FOR INCOMPLETENESS 0 $0 0 $0 0 $0
Aggregated Statistics For Year 2002(Based on 6 full tracts) A) Conventional B) Refinancings C) Non-occupant Loans on Number Average Value Number Average Value Number Average Value
LOANS ORIGINATED 42 $301,716 39 $309,464 0 $0 APPLICATIONS APPROVED, NOT ACCEPTED 36 $323,796 8 $258,879 4 $209,275 APPLICATIONS DENIED 0 $0 4 $360,898 0 $0 APPLICATIONS WITHDRAWN 2 $235,070 2 $385,685 0 $0 FILES CLOSED FOR INCOMPLETENESS 0 $0 0 $0 0 $0
Aggregated Statistics For Year 2001(Based on 6 full tracts) A) Conventional B) Refinancings C) Non-occupant Loans on Number Average Value Number Average Value Number Average Value
LOANS ORIGINATED 102 $301,564 16 $303,052 8 $262,400 APPLICATIONS APPROVED, NOT ACCEPTED 18 $285,033 14 $274,303 0 $0 APPLICATIONS DENIED 4 $272,285 2 $216,540 0 $0 APPLICATIONS WITHDRAWN 2 $381,655 0 $0 0 $0 FILES CLOSED FOR INCOMPLETENESS 0 $0 2 $399,640 0 $0
Aggregated Statistics For Year 2000(Based on 6 full tracts) A) Conventional B) Refinancings C) Non-occupant Loans on Number Average Value Number Average Value Number Average Value
LOANS ORIGINATED 138 $251,291 32 $218,270 4 $161,918 APPLICATIONS APPROVED, NOT ACCEPTED 22 $226,711 8 $205,300 0 $0 APPLICATIONS DENIED 10 $194,803 2 $282,865 0 $0 APPLICATIONS WITHDRAWN 4 $240,362 0 $0 0 $0 FILES CLOSED FOR INCOMPLETENESS 4 $304,225 0 $0 0 $0
Aggregated Statistics For Year 1999(Based on 2 full and 4 partial tracts) A) Conventional B) Refinancings C) Non-occupant Loans on Number Average Value Number Average Value Number Average Value
LOANS ORIGINATED 136 $217,796 31 $209,276 1 $325,320 APPLICATIONS APPROVED, NOT ACCEPTED 10 $234,900 13 $218,031 1 $93,890 APPLICATIONS DENIED 4 $254,485 1 $308,240 0 $0 APPLICATIONS WITHDRAWN 7 $179,004 3 $254,607 0 $0 FILES CLOSED FOR INCOMPLETENESS 1 $324,060 1 $199,530 0 $0
2010 - 2017 National Fire Incident Reporting System (NFIRS) incidents See full 2006 National Fire Incident Reporting System statistics for zip code 95121, California
Most common first names in zip code 95121 among deceased individuals Name Count Lived (average)
John 59 72.8 years Mary 47 76.5 years William 43 71.3 years Robert 42 67.2 years Maria 32 79.3 years Joseph 31 74.5 years James 27 68.0 years Charles 25 66.0 years Frank 21 72.7 years George 21 75.0 years
Most common last names in zip code 95121 among deceased individuals Last name Count Lived (average)
Nguyen 82 76.5 years Tran 42 74.6 years Le 20 73.2 years Pham 19 66.0 years Smith 16 70.0 years Johnson 15 68.6 years Williams 15 69.5 years Vu 14 78.5 years Lopez 14 55.3 years Sanchez 14 70.5 years
Businesses in zip code 95121
Name Count Name Count
AT&T 1 Popeyes 1 Bally Total Fitness 1 Red Lobster 1 Baskin-Robbins 1 Rite Aid 1 Blockbuster 1 Safeway 1 Chuck E. Cheese's 1 Sears 1 Dennys 1 Starbucks 4 Domino's Pizza 1 Subway 2 FedEx 2 T-Mobile 2 H&R Block 1 Taco Bell 2 Jamba Juice 1 Target 1 Jones New York 1 UPS 2 Little Caesars Pizza 1 Vons 1 McDonald's 1 Walgreens 1 Motel 6 1 Wendy's 1 Office Depot 1
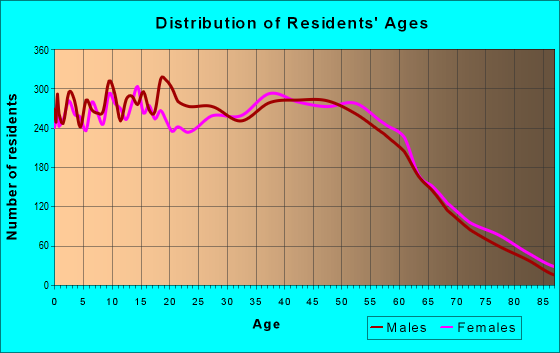
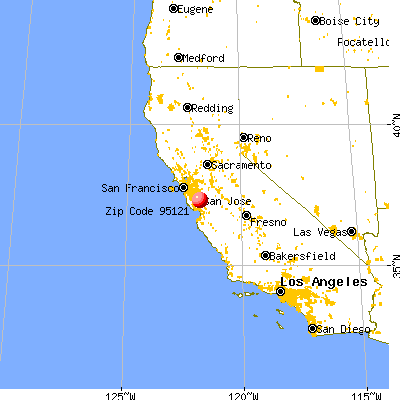


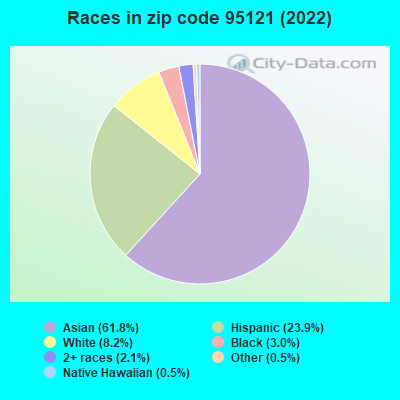


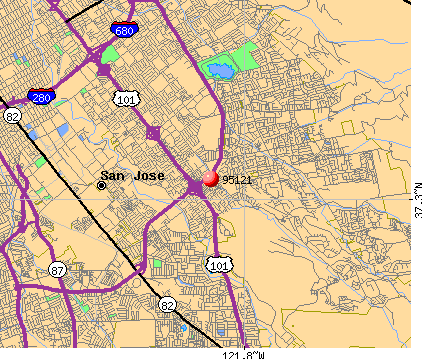 Nearest zip codes: 95111, 95122, 95148, 95136, 95116, 95123.
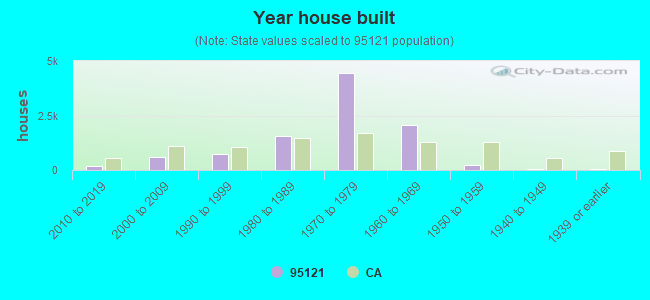
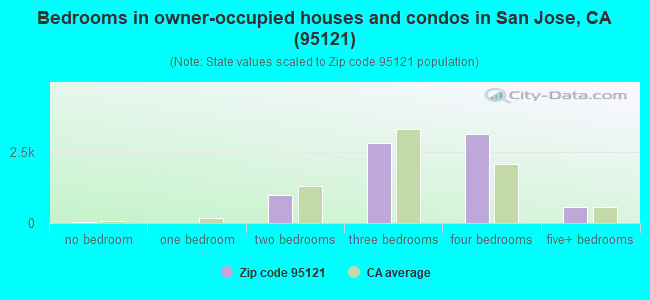
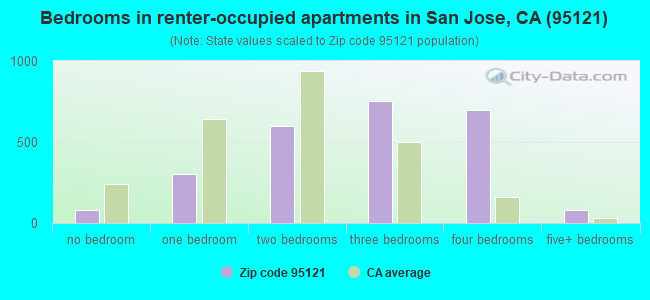
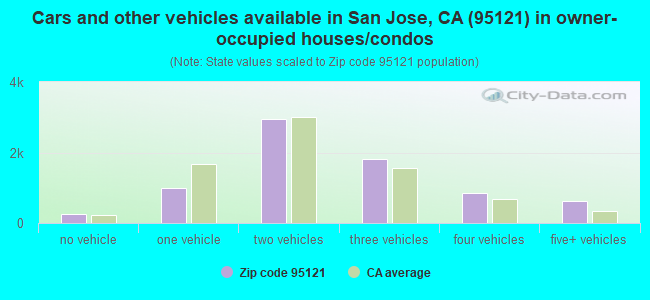
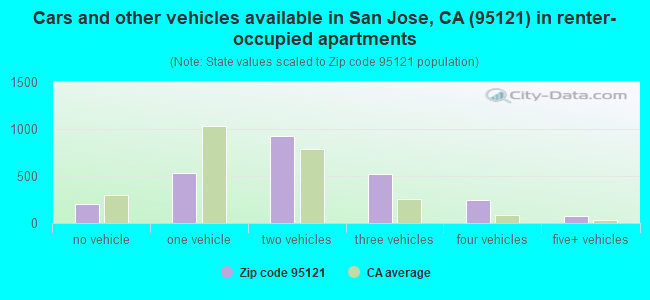


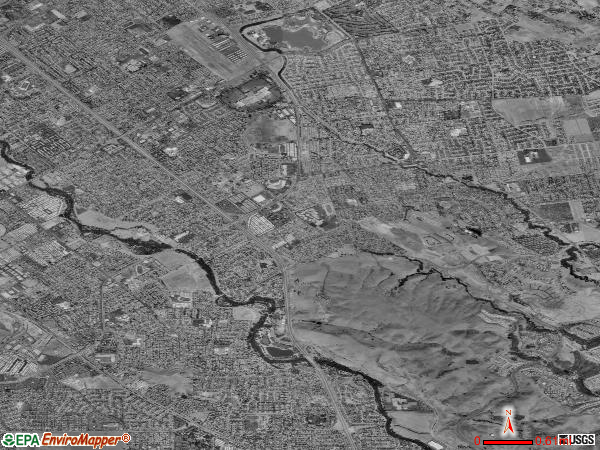
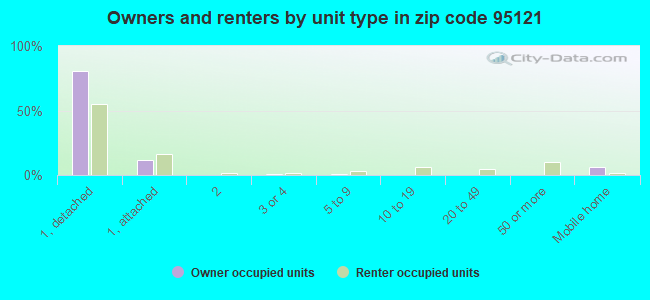
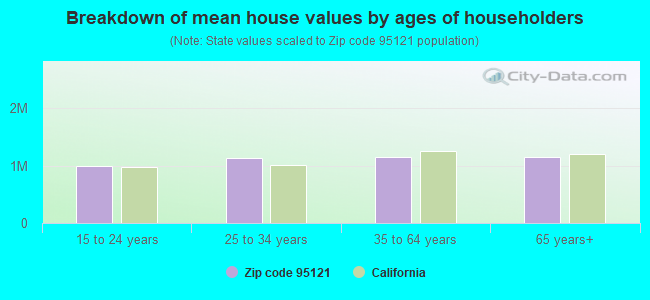


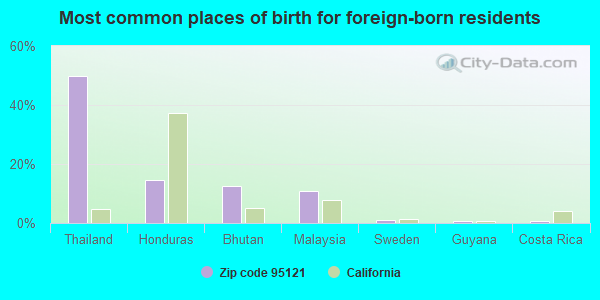
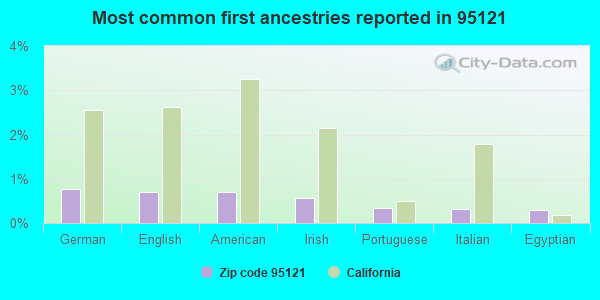
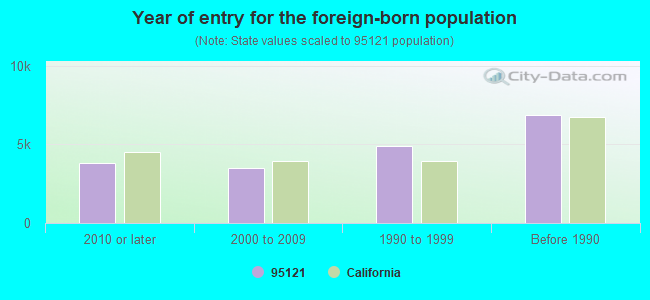
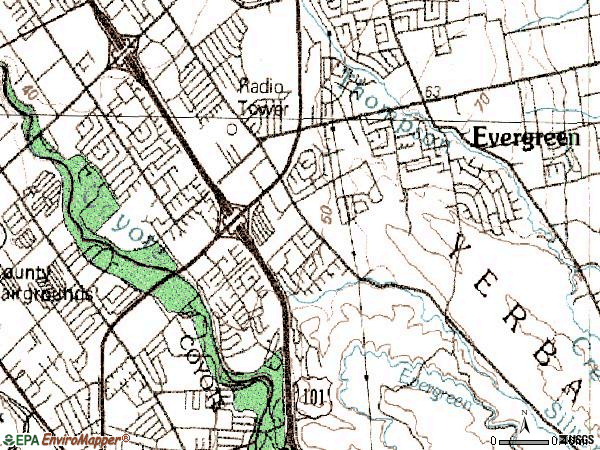

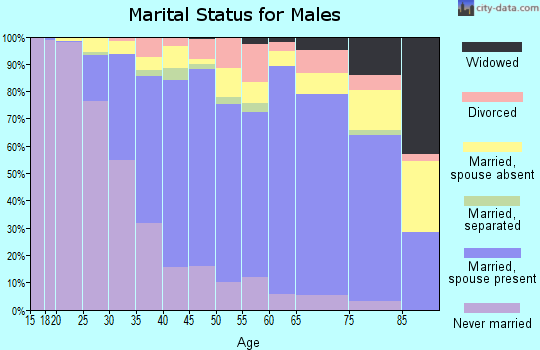
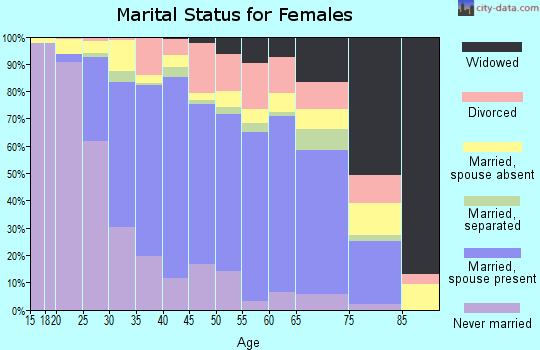
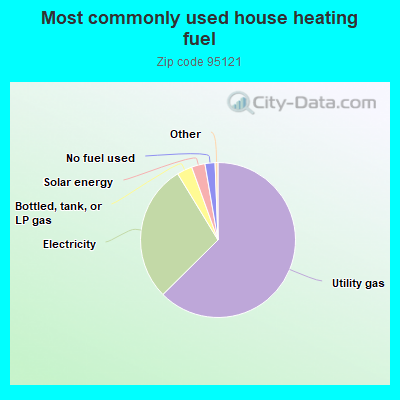
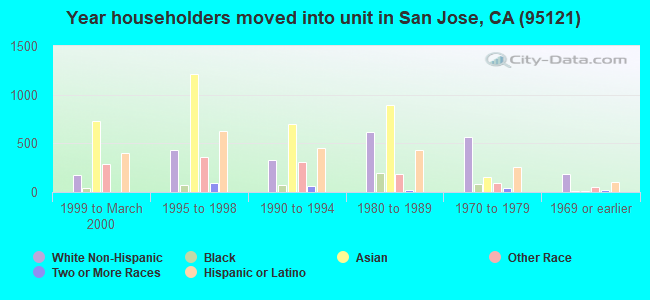
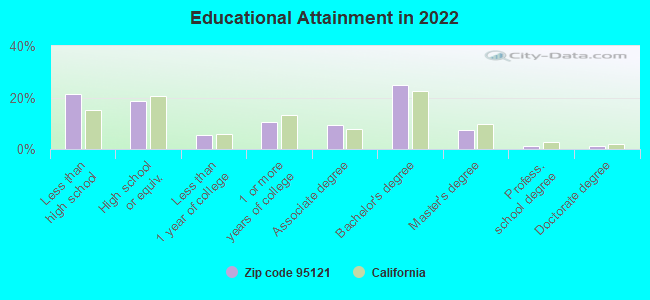
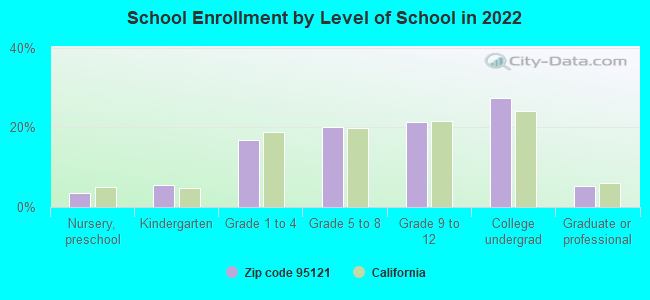
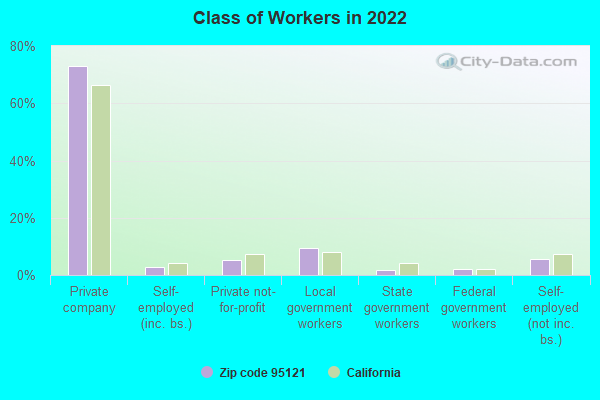
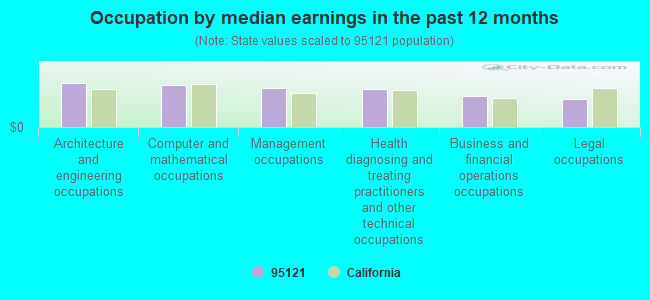
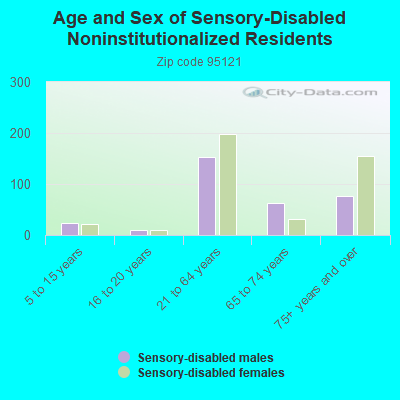
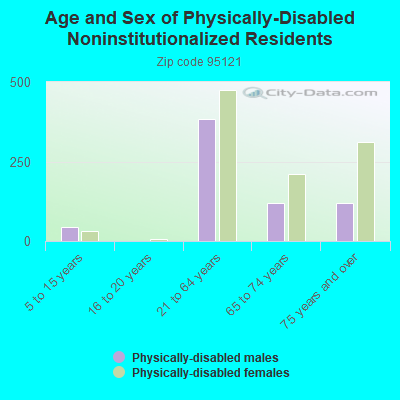
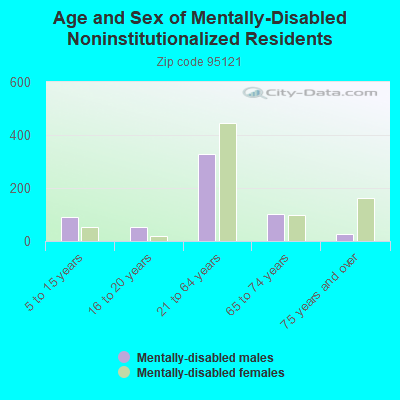
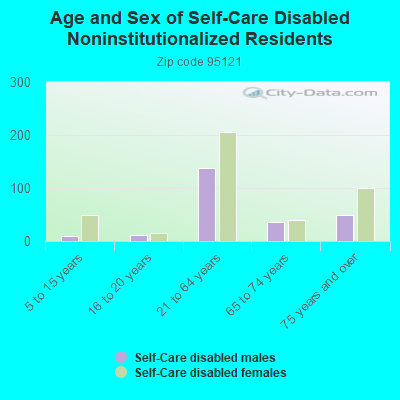
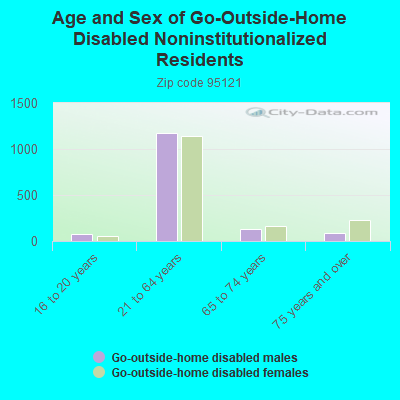
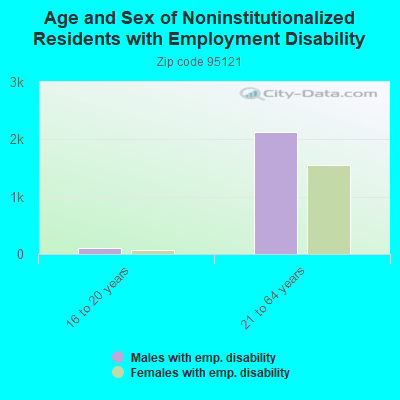
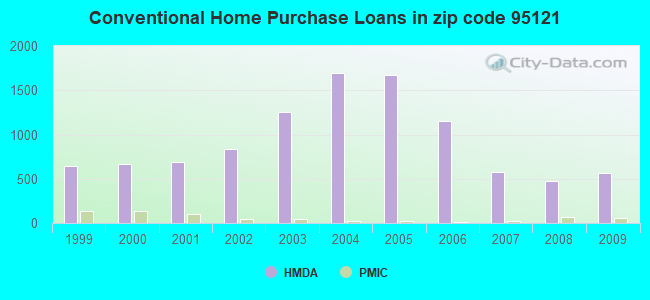
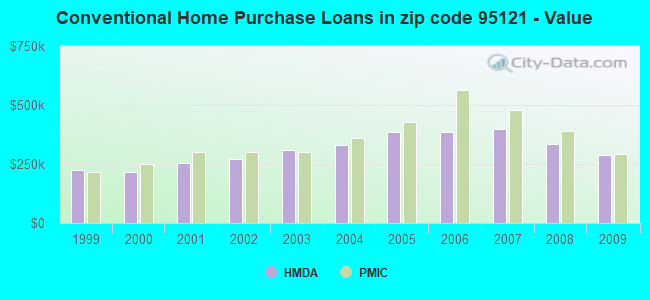
 Based on the data from the years 2010 - 2017 the average number of fire incidents per year is 45. The highest number of fire incidents - 120 took place in 2017, and the least - 1 in 2014. The data has a growing trend.
 When looking into fire subcategories, the most incidents belonged to: Outside Fires (64.4%), and Mobile Property/Vehicle Fires (18.6%).