Saint Leo's neighborhood in San Jose, California (CA), 95126 detailed profile
Settings
X

Business Search - 14 Million verified businesses
Area: 0.121 square miles
Population: 938
Population density:
| Saint Leo's: | 7,758 people per square mile |
| San Jose: | 5,554 people per square mile |

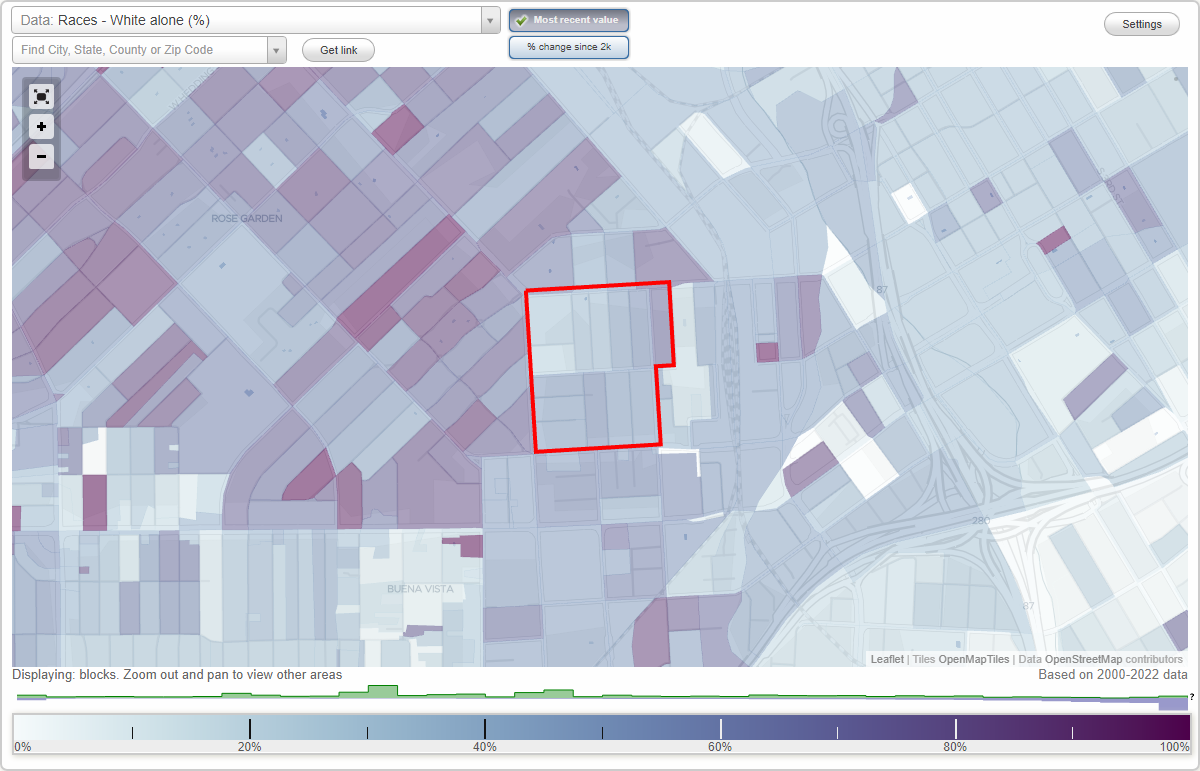
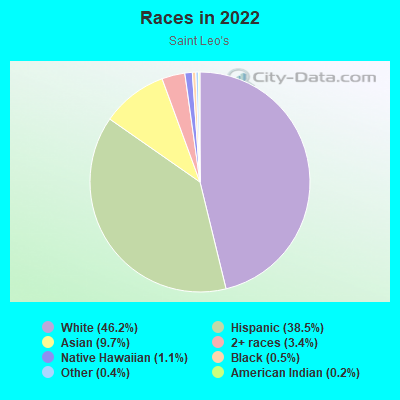
- 43646.2%White
- 36338.5%Hispanic or Latino
- 919.7%Asian
- 323.4%Two or more races
- 101.1%Native Hawaiian and Other
Pacific Islander - 50.5%Black
- 40.4%Some other race
- 20.2%American Indian
Median household income in 2022:
| Saint Leo's: | $164,999 |
| San Jose: | $133,835 |
Distribution of median household income
![Distribution of median household income]()
- 20Less than $10,000
- 82$10,000 to $19,999
- 10$20,000 to $29,999
- 11$30,000 to $39,999
- 28$40,000 to $49,999
- 17$50,000 to $59,999
- 13$60,000 to $74,999
- 122$75,000 to $99,999
- 12$100,000 to $124,999
- 24$125,000 to $149,999
- 50$150,000 to $199,999
- 87$200,000 or more

Distribution of owner-occupied house/condo value
![Distribution of owner-occupied house/condo value]()
- 8Less than $50,000
- 5$50,000 to $99,999
- 6$250,000 to $299,999
- 11$300,000 to $399,999
- 11$400,000 to $499,999
- 3$500,000 to $749,999
- 46$750,000 to $999,999
- 88$1,000,000 or more

Distribution of rent paid by renters
![Distribution of rent paid by renters]()
- 8Less than $100
- 87$300 to $399
- 3$400 to $499
- 11$500 to $599
- 3$600 to $699
- 24$700 to $799
- 24$800 to $899
- 4$900 to $999
- 12$1,000 to $1,249
- 8$1,250 to $1,499
- 83$1,500 to $1,999
- 117$2,000 or more

Median rent in 2022:
| Saint Leo's: | $2,079 |
| San Jose: | $2,001 |
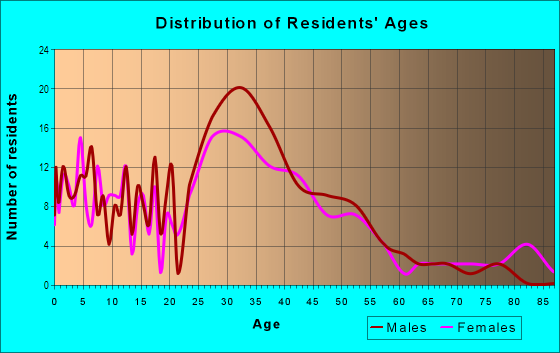
| Males: | 556 |
| Females: | 381 |
Males:
| This neighborhood: | 37.0 years |
| Whole city: | 37.6 years |
| This neighborhood: | 38.7 years |
| Whole city: | 39.1 years |
Average household size:
| Saint Leo's: | 2.7 people |
| San Jose: | 2.9 people |
Percentage of family households:
| Saint Leo's: | 36.2% |
| San Jose: | 49.9% |
| Here: | 29.1% |
| San Jose: | 53.0% |
Percentage of married-couple families with children (among all households):
| Saint Leo's: | 34.5% |
| San Jose: | 25.8% |
Percentage of single-mother households (among all households):
| Saint Leo's: | 3.3% |
| San Jose: | 5.2% |
Percentage of never married males 15 years old and over:
Percentage of never married females 15 years old and over:
| Saint Leo's: | 40.8% |
| San Jose: | 20.9% |
Percentage of never married females 15 years old and over:
| Saint Leo's: | 15.0% |
| city: | 16.7% |
Percentage of people that speak English not well or not at all:
| Saint Leo's: | 11.3% |
| San Jose: | 11.4% |
Percentage of people born in this state:
Percentage of people born in another U.S. state:
Percentage of native residents but born outside the U.S.:
Percentage of foreign born residents:
| Here: | 54.2% |
| San Jose: | 46.1% |
Percentage of people born in another U.S. state:
| Saint Leo's: | 15.6% |
| San Jose: | 10.4% |
Percentage of native residents but born outside the U.S.:
| Here: | 2.3% |
| city: | 1.7% |
Percentage of foreign born residents:
| Here: | 28.0% |
| San Jose: | 41.8% |
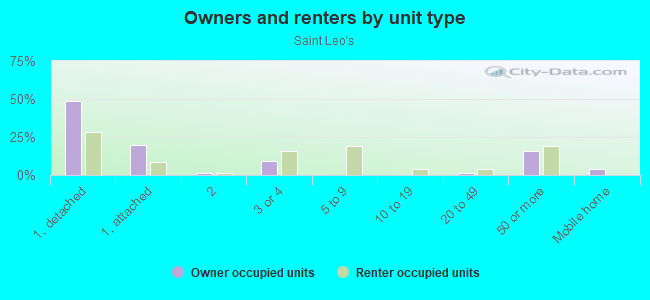
Owner-occupied
Renter-occupied

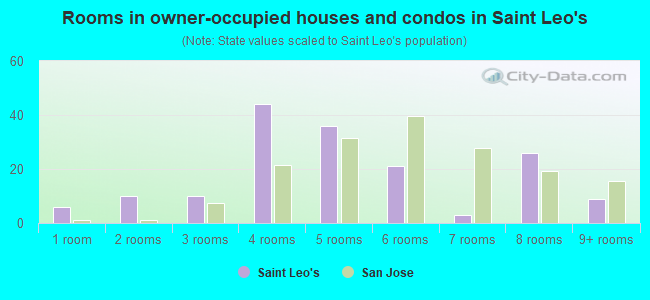
- Rooms in owner-occupied houses and condos in Saint Leo's
- 61 room
- 102 rooms
- 103 rooms
- 444 rooms
- 365 rooms
- 216 rooms
- 37 rooms
- 268 rooms
- 99+ rooms
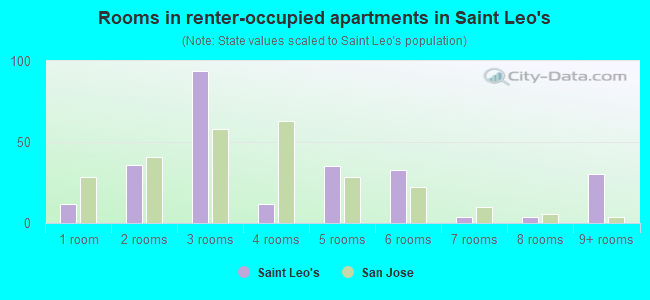
- Rooms in renter-occupied apartments in Saint Leo's
- 121 room
- 362 rooms
- 943 rooms
- 124 rooms
- 355 rooms
- 336 rooms
- 47 rooms
- 48 rooms
- 309+ rooms
Owner-occupied
Renter-occupied
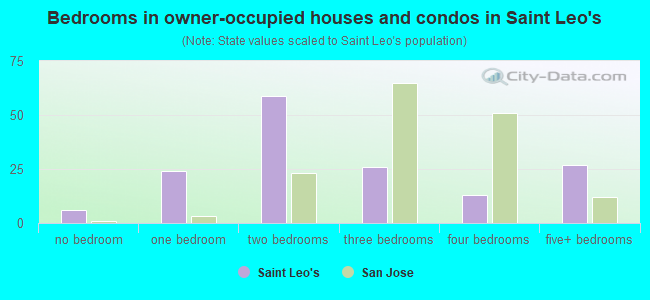
- Bedrooms in owner-occupied houses and condos in Saint Leo's
- 6no bedroom
- 241 bedroom
- 592 bedrooms
- 263 bedrooms
- 134 bedrooms
- 275+ bedrooms
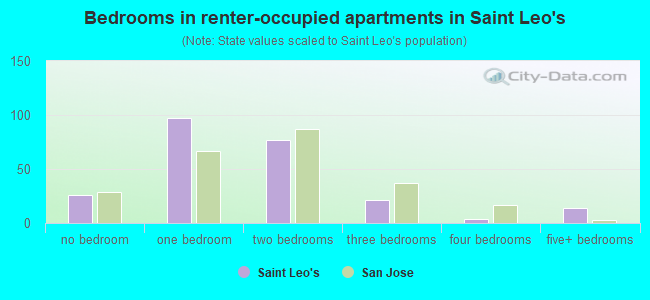
- Bedrooms in renter-occupied apartments in Saint Leo's
- 26no bedroom
- 971 bedroom
- 772 bedrooms
- 213 bedrooms
- 44 bedrooms
- 145+ bedrooms
Average number of cars or other vehicles available in houses/condos:
Average number of cars or other vehicles available in apartments:
| This neighborhood: | 2.2 |
| San Jose: | 2.3 |
Average number of cars or other vehicles available in apartments:
| Here: | 1.8 |
| city: | 1.6 |
Percentage of units with a mortgage:
| Saint Leo's: | 69.8% |
| San Jose: | 66.9% |
Average estimated value of detached houses in 2022 (43.8% of all units):
| Saint Leo's: | $1,236,868 |
| San Jose: | $1,532,815 |
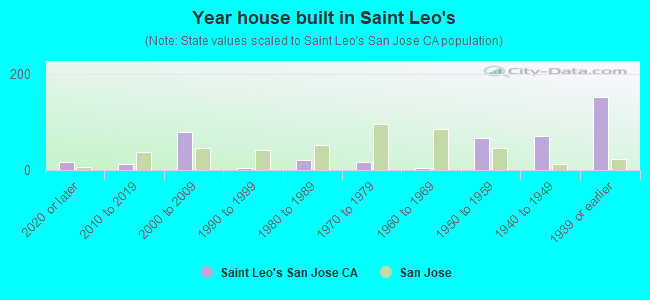
- Year house built in Saint Leo's
- 172020 or later
- 122010 to 2019
- 792000 to 2009
- 41990 to 1999
- 201980 to 1989
- 161970 to 1979
- 41960 to 1969
- 671950 to 1959
- 721940 to 1949
- 1521939 or earlier
City-data.com crime index for city in 2020 (higher means more crime):
| City: | 268.4 |
| U.S. average: | 219.5 |
Travel time to work (commute)
![Travel time to work (commute)]()
- 65Less than 5 minutes
- 285 to 9 minutes
- 12110 to 14 minutes
- 13815 to 19 minutes
- 8420 to 24 minutes
- 4825 to 29 minutes
- 8530 to 34 minutes
- 335 to 39 minutes
- 2240 to 44 minutes
- 3645 to 59 minutes
- 5360 to 89 minutes
- 2790 or more minutes

Means of transportation to work
![Means of transportation to work]()
- 54.6%326Drove a car alone
- 9.9%59Carpooled
- 6.9%41Bus
- 0.3%2Subway or elevated rail
- 1.7%10Long-distance train or commuter rail
- 0.2%1Motorcycle
- 0.8%5Bicycle
- 5.0%30Walked
- 5.9%35Other means
- 19.9%119Worked at home

Time leaving home to go to work
![Time leaving home to go to work]()
- 7012:00 a.m. to 4:59 a.m.
- 315:00 a.m. to 5:29 a.m.
- 45:30 a.m. to 5:59 a.m.
- 186:00 a.m. to 6:29 a.m.
- 566:30 a.m. to 6:59 a.m.
- 1607:00 a.m. to 7:29 a.m.
- 737:30 a.m. to 7:59 a.m.
- 998:00 a.m. to 8:29 a.m.
- 498:30 a.m. to 8:59 a.m.
- 839:00 a.m. to 9:59 a.m.
- 2610:00 a.m. to 10:59 a.m.
- 711:00 a.m. to 11:59 a.m.
- 1712:00 p.m. to 3:59 p.m.
- 414:00 p.m. to 11:59 p.m.

Occupations of males:
- Percentage of males in management occupations (except farmers):
Here: 10.0% city: 13.0%
- Percentage of males in business and financial operations occupations:
Here: 6.3% city: 4.6%
- Percentage of males in computer and mathematical occupations:
Here: 2.4% city: 13.6%
- Percentage of males in architecture and engineering occupations:
Here: 4.2% city: 10.2%
- Percentage of males in community and social services occupations:
Here: 10.2% city: 0.8%
- Percentage of males in education, training, and library occupations:
Here: 3.1% city: 2.8%
- Percentage of males in arts, design, entertainment, sports, and media occupations:
Here: 4.7% city: 1.8%
- Percentage of males in healthcare practitioners and technical occupations:
Here: 1.1% city: 2.0%
- Percentage of males in service occupations:
Here: 11.1% city: 12.7%
- Percentage of males in sales and office occupations:
Here: 25.3% city: 12.8%
- Percentage of males in construction, extraction, and maintenance occupations:
Here: 9.4% city: 7.8%
- Percentage of males in production occupations:
Here: 2.1% city: 5.5%
- Percentage of males in transportation occupations:
Here: 7.2% city: 3.6%
- Percentage of males in material moving occupations:
Here: 2.2% city: 3.1%
Occupations of females:
- Percentage of females in management occupations (except farmers):
Here: 12.3% city: 11.0%
- Percentage of females in business and financial operations occupations:
Here: 10.3% city: 8.6%
- Percentage of females in computer and mathematical occupations:
Here: 1.3% city: 5.4%
- Percentage of females in architecture and engineering occupations:
Here: 2.7% city: 2.8%
- Percentage of females in life, physical, and social science occupations:
Here: 1.4% city: 1.7%
- Percentage of females in community and social services occupations:
Here: 11.9% city: 1.8%
- Percentage of females in legal occupations:
Here: 1.7% city: 1.3%
- Percentage of females in education, training, and library occupations:
Here: 10.6% city: 8.1%
- Percentage of females in arts, design, entertainment, sports, and media occupations:
Here: 1.9% city: 2.0%
- Percentage of females in healthcare practitioners and technical occupations:
Here: 5.4% city: 6.8%
- Percentage of females in service occupations:
Here: 17.0% city: 21.7%
- Percentage of females in sales and office occupations:
Here: 17.8% city: 22.0%
- Percentage of females in production occupations:
Here: 7.0% city: 4.0%
Percentage of people 16-64 in Armed Forces:
| Saint Leo's: | 0.2% |
| San Jose: | 0.0% |
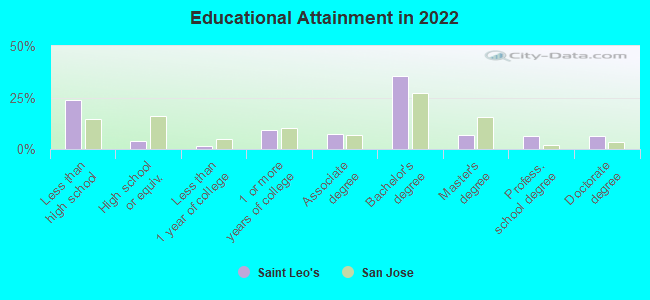
Education in this neighborhood (subdivision or community):
- Percentage of people 3 years and older in K-12 schools:
Saint Leo's: 18.2% San Jose: 16.1%
- Percentage of people 3 years and older in undergraduate colleges:
Saint Leo's: 6.0% San Jose: 6.5%
- Percentage of people 3 years and older in grad. or professional schools:
Saint Leo's: 4.8% San Jose: 2.0%
- Percentage of students K-12 enrolled in private schools:
Saint Leo's: 42.6% San Jose: 14.9%
Percentage of population below poverty level:
| Saint Leo's: | 13.9% |
| San Jose: | 9.0% |
Median year owner moved in (as recorded in 2022):
Median year renter moved in (as recorded in 2022):
| Saint Leo's: | 2009 |
| San Jose: | 2008 |
Median year renter moved in (as recorded in 2022):
| Saint Leo's: | 2018 |
| San Jose: | 2020 |
Percentage of married-couple families with both working:
| Saint Leo's: | 86.1% |
| San Jose: | 72.5% |
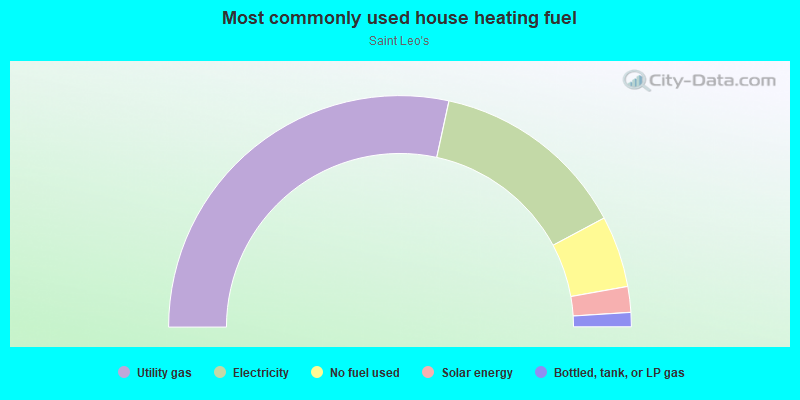
- 56.8%Utility gas
- 27.6%Electricity
- 10.0%No fuel used
- 3.6%Solar energy
- 2.0%Bottled, tank, or LP gas
Highways in this neighborhood:
State Hwy 82 (The Alameda)
Length: 0.27 miles
Direction: E-W
Address range: 800 to 1028
Direction: E-W
Address range: 800 to 1028
Roads and streets:
Sunol St
Length: 0.27 miles
Direction: N-S
Address range: 1 to 139
Direction: N-S
Address range: 1 to 139
S Morrison Ave
Length: 0.25 miles
Direction: N-S
Address range: 1 to 134
Direction: N-S
Address range: 1 to 134
W San Fernando St
Length: 0.20 miles
Direction: E-W
Address range: 800 to 1050
Direction: E-W
Address range: 800 to 1050
S Keeble Ave
Length: 0.20 miles
Directions: N-S, SW-NE
Address range: 1 to 99
Directions: N-S, SW-NE
Address range: 1 to 99
Atlas Ave
Length: 0.19 miles
Direction: N-S
Address range: 1 to 99
Direction: N-S
Address range: 1 to 99
Cleaves Ave
Length: 0.19 miles
Direction: N-S
Address range: 1 to 99
Direction: N-S
Address range: 1 to 99
Rainier Ave
Length: 0.11 miles
Direction: N-S
Address range: 100 to 157
Direction: N-S
Address range: 100 to 157
Luther Ave
Length: 0.03 miles
Direction: E-W
Address range: 1000 to 1038
Direction: E-W
Address range: 1000 to 1038