West San Carlos neighborhood in San Jose, California (CA), 95126, 95128 detailed profile
Settings
X

Business Search - 14 Million verified businesses
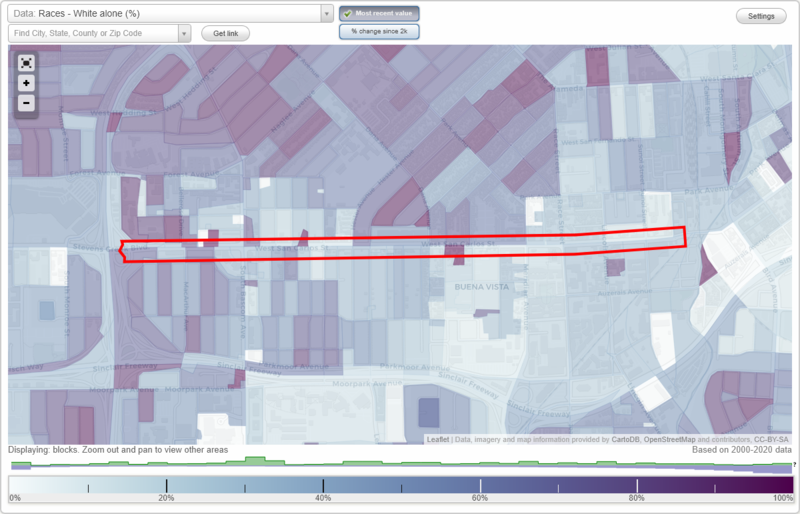
Area: 0.138 square miles
Population: 1,563
Population density:
| West San Carlos: | 11,318 people per square mile |
| San Jose: | 5,554 people per square mile |

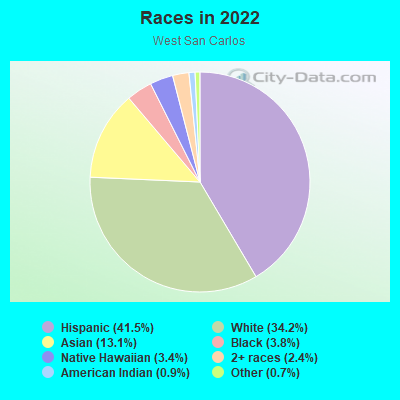
- 68741.5%Hispanic or Latino
- 56634.2%White
- 21713.1%Asian
- 633.8%Black
- 573.4%Native Hawaiian and Other
Pacific Islander - 402.4%Two or more races
- 150.9%American Indian
- 110.7%Some other race
Median household income in 2022:
| West San Carlos: | $121,501 |
| San Jose: | $133,835 |
Distribution of median household income
![Distribution of median household income]()
- 21Less than $10,000
- 54$10,000 to $19,999
- 103$20,000 to $29,999
- 35$30,000 to $39,999
- 55$40,000 to $49,999
- 77$50,000 to $59,999
- 34$60,000 to $74,999
- 81$75,000 to $99,999
- 78$100,000 to $124,999
- 68$125,000 to $149,999
- 77$150,000 to $199,999
- 153$200,000 or more

Distribution of owner-occupied house/condo value
![Distribution of owner-occupied house/condo value]()
- 10Less than $50,000
- 16$50,000 to $99,999
- 24$100,000 to $149,999
- 8$150,000 to $199,999
- 23$250,000 to $299,999
- 7$300,000 to $399,999
- 36$400,000 to $499,999
- 19$500,000 to $749,999
- 72$750,000 to $999,999
- 200$1,000,000 or more

Distribution of rent paid by renters
![Distribution of rent paid by renters]()
- 45$100 to $199
- 57$200 to $299
- 9$300 to $399
- 5$600 to $699
- 26$800 to $899
- 51$1,000 to $1,249
- 33$1,250 to $1,499
- 119$1,500 to $1,999
- 308$2,000 or more

Median rent in 2022:
| West San Carlos: | $2,174 |
| San Jose: | $2,001 |
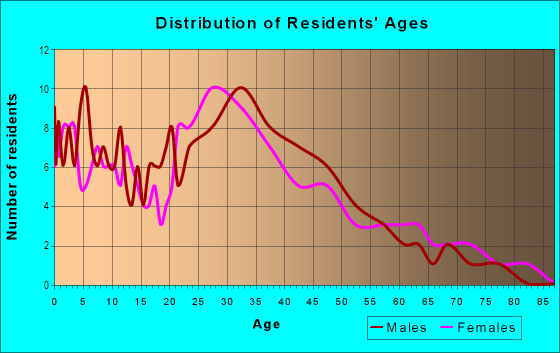
| Males: | 832 |
| Females: | 731 |
Males:
| This neighborhood: | 38.3 years |
| Whole city: | 37.6 years |
| This neighborhood: | 38.6 years |
| Whole city: | 39.1 years |
Average household size:
| West San Carlos: | 2.4 people |
| San Jose: | 2.9 people |
Percentage of family households:
| West San Carlos: | 42.9% |
| San Jose: | 49.9% |
| Here: | 36.1% |
| San Jose: | 53.0% |
Percentage of married-couple families with children (among all households):
| West San Carlos: | 31.5% |
| San Jose: | 25.8% |
Percentage of single-mother households (among all households):
| West San Carlos: | 3.5% |
| San Jose: | 5.2% |
Percentage of never married males 15 years old and over:
Percentage of never married females 15 years old and over:
| West San Carlos: | 25.9% |
| San Jose: | 20.9% |
Percentage of never married females 15 years old and over:
| West San Carlos: | 18.5% |
| city: | 16.7% |
Percentage of people that speak English not well or not at all:
| West San Carlos: | 12.2% |
| San Jose: | 11.4% |
Percentage of people born in this state:
Percentage of people born in another U.S. state:
Percentage of native residents but born outside the U.S.:
Percentage of foreign born residents:
| Here: | 54.8% |
| San Jose: | 46.1% |
Percentage of people born in another U.S. state:
| West San Carlos: | 10.8% |
| San Jose: | 10.4% |
Percentage of native residents but born outside the U.S.:
| Here: | 1.6% |
| city: | 1.7% |
Percentage of foreign born residents:
| Here: | 32.8% |
| San Jose: | 41.8% |
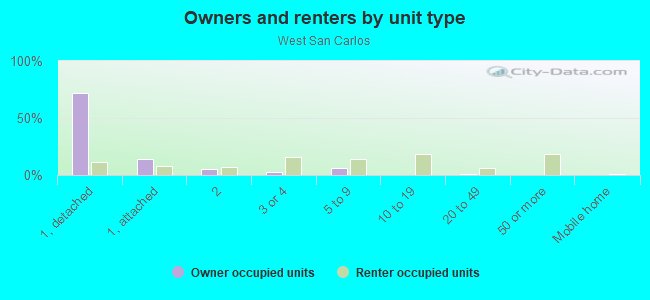
Owner-occupied
Renter-occupied

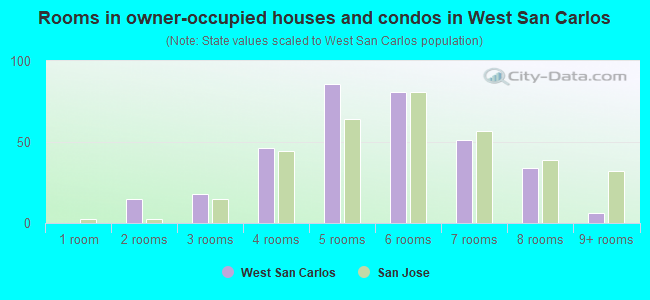
- Rooms in owner-occupied houses and condos in West San Carlos
- 01 room
- 152 rooms
- 183 rooms
- 464 rooms
- 865 rooms
- 816 rooms
- 517 rooms
- 348 rooms
- 69+ rooms
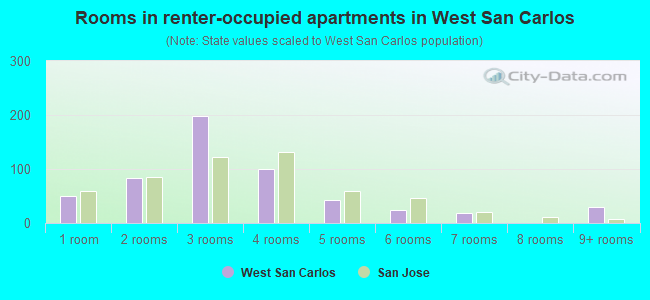
- Rooms in renter-occupied apartments in West San Carlos
- 501 room
- 842 rooms
- 1983 rooms
- 1004 rooms
- 425 rooms
- 256 rooms
- 197 rooms
- 08 rooms
- 309+ rooms
Owner-occupied
Renter-occupied
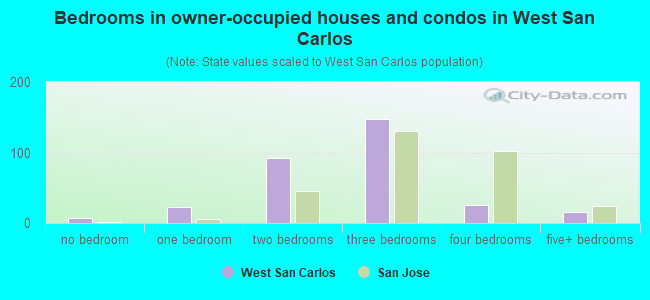
- Bedrooms in owner-occupied houses and condos in West San Carlos
- 7no bedroom
- 231 bedroom
- 922 bedrooms
- 1473 bedrooms
- 264 bedrooms
- 155+ bedrooms
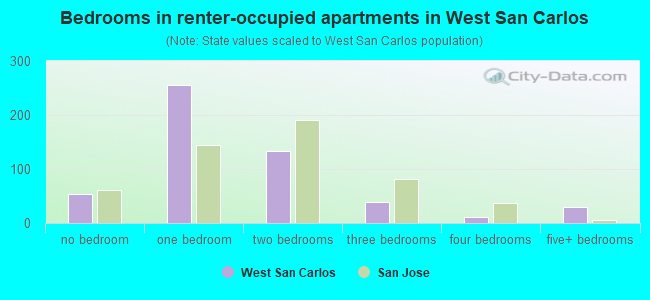
- Bedrooms in renter-occupied apartments in West San Carlos
- 53no bedroom
- 2551 bedroom
- 1332 bedrooms
- 393 bedrooms
- 124 bedrooms
- 305+ bedrooms
Average number of cars or other vehicles available in houses/condos:
Average number of cars or other vehicles available in apartments:
| This neighborhood: | 2.0 |
| San Jose: | 2.3 |
Average number of cars or other vehicles available in apartments:
| Here: | 1.4 |
| city: | 1.6 |
Percentage of units with a mortgage:
| West San Carlos: | 76.1% |
| San Jose: | 66.9% |
Average estimated value of detached houses in 2022 (44.9% of all units):
| West San Carlos: | $1,046,213 |
| San Jose: | $1,532,815 |
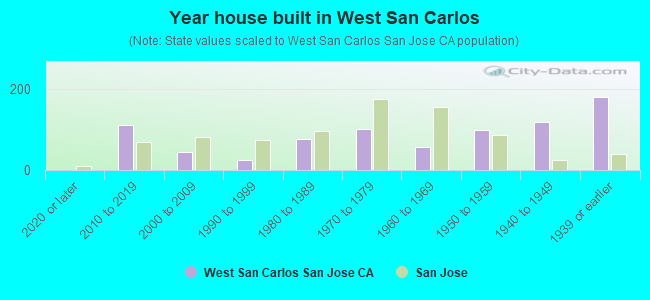
- Year house built in West San Carlos
- 02020 or later
- 1122010 to 2019
- 452000 to 2009
- 241990 to 1999
- 761980 to 1989
- 1021970 to 1979
- 581960 to 1969
- 1001950 to 1959
- 1191940 to 1949
- 1801939 or earlier
City-data.com crime index for city in 2020 (higher means more crime):
| City: | 268.4 |
| U.S. average: | 219.5 |
Travel time to work (commute)
![Travel time to work (commute)]()
- 13Less than 5 minutes
- 355 to 9 minutes
- 11410 to 14 minutes
- 12415 to 19 minutes
- 13520 to 24 minutes
- 5025 to 29 minutes
- 10230 to 34 minutes
- 1635 to 39 minutes
- 1840 to 44 minutes
- 8345 to 59 minutes
- 2160 to 89 minutes
- 1990 or more minutes

Means of transportation to work
![Means of transportation to work]()
- 65.3%632Drove a car alone
- 12.1%117Carpooled
- 5.5%53Bus
- 0.2%2Subway or elevated rail
- 2.7%26Long-distance train or commuter rail
- 4.6%45Light rail, streetcar or trolley
- 0.4%4Taxi
- 2.7%26Motorcycle
- 1.1%11Bicycle
- 3.2%31Walked
- 1.9%18Other means
- 14.1%136Worked at home

Time leaving home to go to work
![Time leaving home to go to work]()
- 1212:00 a.m. to 4:59 a.m.
- 245:00 a.m. to 5:29 a.m.
- 255:30 a.m. to 5:59 a.m.
- 616:00 a.m. to 6:29 a.m.
- 376:30 a.m. to 6:59 a.m.
- 1087:00 a.m. to 7:29 a.m.
- 847:30 a.m. to 7:59 a.m.
- 868:00 a.m. to 8:29 a.m.
- 358:30 a.m. to 8:59 a.m.
- 589:00 a.m. to 9:59 a.m.
- 3110:00 a.m. to 10:59 a.m.
- 1011:00 a.m. to 11:59 a.m.
- 8312:00 p.m. to 3:59 p.m.
- 394:00 p.m. to 11:59 p.m.

Occupations of males:
- Percentage of males in management occupations (except farmers):
Here: 12.1% city: 13.0%
- Percentage of males in business and financial operations occupations:
Here: 2.6% city: 4.6%
- Percentage of males in computer and mathematical occupations:
Here: 8.3% city: 13.6%
- Percentage of males in architecture and engineering occupations:
Here: 7.5% city: 10.2%
- Percentage of males in life, physical, and social science occupations:
Here: 1.6% city: 1.1%
- Percentage of males in education, training, and library occupations:
Here: 2.5% city: 2.8%
- Percentage of males in arts, design, entertainment, sports, and media occupations:
Here: 3.7% city: 1.8%
- Percentage of males in service occupations:
Here: 23.3% city: 12.7%
- Percentage of males in sales and office occupations:
Here: 13.4% city: 12.8%
- Percentage of males in construction, extraction, and maintenance occupations:
Here: 5.2% city: 7.8%
- Percentage of males in production occupations:
Here: 2.9% city: 5.5%
- Percentage of males in transportation occupations:
Here: 1.9% city: 3.6%
- Percentage of males in material moving occupations:
Here: 9.0% city: 3.1%
Occupations of females:
- Percentage of females in management occupations (except farmers):
Here: 15.1% city: 11.0%
- Percentage of females in business and financial operations occupations:
Here: 6.4% city: 8.6%
- Percentage of females in computer and mathematical occupations:
Here: 4.5% city: 5.4%
- Percentage of females in architecture and engineering occupations:
Here: 1.8% city: 2.8%
- Percentage of females in community and social services occupations:
Here: 2.9% city: 1.8%
- Percentage of females in legal occupations:
Here: 1.5% city: 1.3%
- Percentage of females in education, training, and library occupations:
Here: 7.5% city: 8.1%
- Percentage of females in healthcare practitioners and technical occupations:
Here: 6.9% city: 6.8%
- Percentage of females in service occupations:
Here: 29.1% city: 21.7%
- Percentage of females in sales and office occupations:
Here: 20.8% city: 22.0%
- Percentage of females in production occupations:
Here: 2.4% city: 4.0%
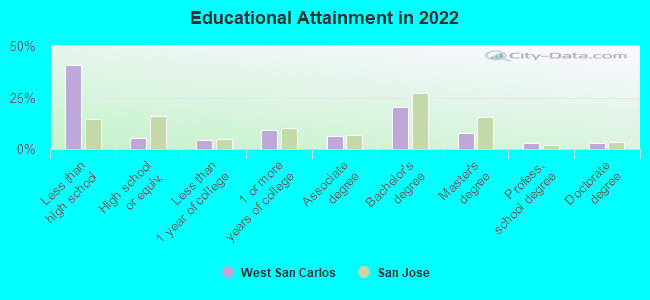
Education in this neighborhood (subdivision or community):
- Percentage of people 3 years and older in K-12 schools:
West San Carlos: 19.1% San Jose: 16.1%
- Percentage of people 3 years and older in undergraduate colleges:
West San Carlos: 6.4% San Jose: 6.5%
- Percentage of people 3 years and older in grad. or professional schools:
West San Carlos: 2.3% San Jose: 2.0%
- Percentage of students K-12 enrolled in private schools:
West San Carlos: 40.5% San Jose: 14.9%
Percentage of population below poverty level:
| West San Carlos: | 7.2% |
| San Jose: | 9.0% |
Median year owner moved in (as recorded in 2022):
Median year renter moved in (as recorded in 2022):
| West San Carlos: | 2006 |
| San Jose: | 2008 |
Median year renter moved in (as recorded in 2022):
| West San Carlos: | 2015 |
| San Jose: | 2020 |
Percentage of married-couple families with both working:
| West San Carlos: | 112.2% |
| San Jose: | 72.5% |
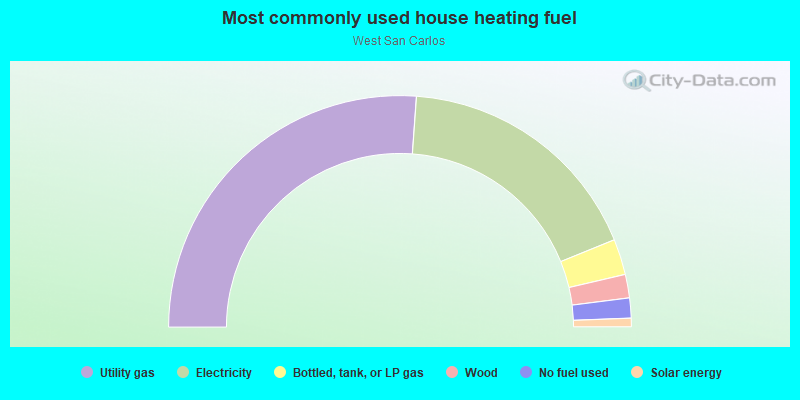
- 52.3%Utility gas
- 35.4%Electricity
- 5.0%Bottled, tank, or LP gas
- 3.3%Wood
- 2.8%No fuel used
- 1.2%Solar energy
Roads and streets:
W San Carlos St
Length: 1.88 miles
Direction: E-W
Address range: 749 to 2181
Direction: E-W
Address range: 749 to 2181
Stevens Creek Blvd
Length: 0.46 miles
Direction: E-W
Address range: 2200 to 2698
Direction: E-W
Address range: 2200 to 2698
Di Salvo Ave
Length: 0.05 miles
Directions: E-W, N-S
Address range: 236 to 299
Directions: E-W, N-S
Address range: 236 to 299
S Bascom Ave
Length: 0.04 miles
Direction: N-S
Address range: 300 to 356
Direction: N-S
Address range: 300 to 356
Wainwright Ave
Length: 0.04 miles
Direction: N-S
Address range: 300 to 319
Direction: N-S
Address range: 300 to 319
Laswell Ave
Length: 0.04 miles
Direction: N-S
Address range: 300 to 338
Direction: N-S
Address range: 300 to 338
Vaughn Ave
Length: 0.04 miles
Direction: N-S
Address range: 300 to 348
Direction: N-S
Address range: 300 to 348
Bradley Ave
Length: 0.04 miles
Direction: N-S
Address range: 300 to 326
Direction: N-S
Address range: 300 to 326
Page St
Length: 0.04 miles
Direction: N-S
Address range: 300 to 329
Direction: N-S
Address range: 300 to 329
Mac Arthur Ave (Macarthur Ave)
Length: 0.04 miles
Direction: N-S
Address range: 300 to 319
Direction: N-S
Address range: 300 to 319
Rutland Ave
Length: 0.03 miles
Direction: N-S
Address range: 300 to 336
Direction: N-S
Address range: 300 to 336
Leland Ave
Length: 0.03 miles
Direction: N-S
Address range: 300 to 347
Direction: N-S
Address range: 300 to 347
Richmond Ave
Length: 0.03 miles
Direction: N-S
Address range: 300 to 317
Direction: N-S
Address range: 300 to 317
Sunol St
Length: 0.03 miles
Direction: N-S
Address range: 300 to 331
Direction: N-S
Address range: 300 to 331
Leigh Ave
Length: 0.02 miles
Direction: N-S
Address range: 300 to 321
Direction: N-S
Address range: 300 to 321
Willard Ave
Length: 0.01 miles
Direction: N-S
Direction: N-S