Estimated zip code population in 2022: 31,074 Zip code population in 2010: 28,565 Zip code population in 2000: 26,384
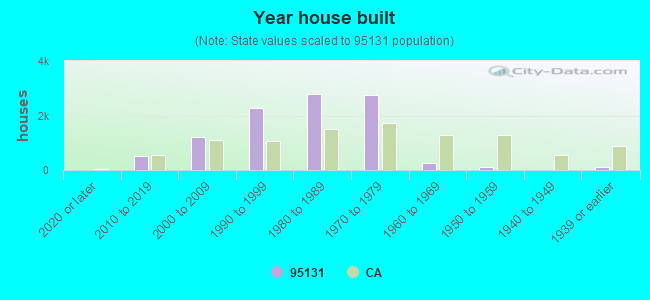
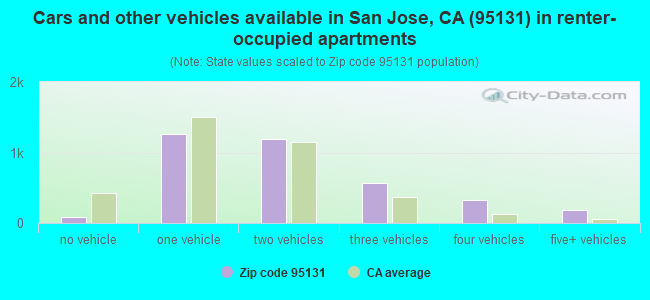
Houses and condos: 10,185 Renter-occupied apartments: 3,637
% of renters here:
37%
State:
44%
March 2022 cost of living index in zip code 95131: 122.1 (high, U.S. average is 100)
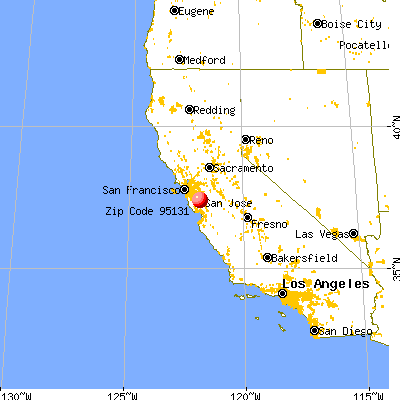
Land area: 5.8 sq. mi. Water area: 0.0 sq. mi.
Population density: 5,325 people per square mile
(average).
OSM Map
General Map
Google Map
MSN Map
OSM Map
General Map
Google Map
MSN Map
OSM Map
General Map
Google Map
MSN Map
OSM Map
General Map
Google Map
MSN Map
Please wait while loading the map...
Real estate property taxes paid for housing units in 2022:
This zip code:
0.7% ($8,893)
California:
0.7% ($4,831)
Median real estate property taxes paid for housing units with mortgages in 2022: $9,560 (0.8%) Median real estate property taxes paid for housing units with no mortgage in 2022: $7,178 (0.6%)
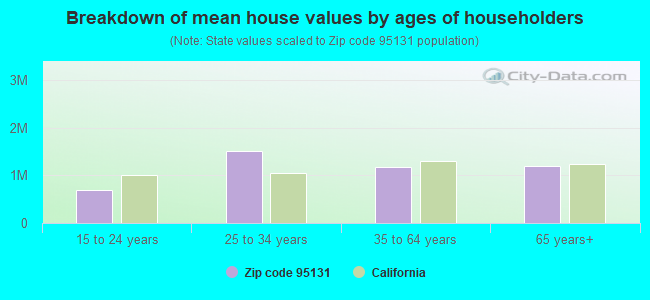
Estimated median house/condo value in 2022: $1,207,464
95131:
$1,207,464
California:
$715,900
According to our research of California and other state lists, there were 18 registered sex offenders living in 95131 zip code as of April 27, 2024. The ratio of all residents to sex offenders in zip code 95131 is 1,692 to 1. The ratio of registered sex offenders to all residents in this zip code is lower than the state average.
Median resident age:
This zip code:
37.3 years
California median age:
37.9 years
Average household size:
This zip code:
3.1 people
California:
2.8 people
Averages for the 2020 tax year for zip code 95131, filed in 2021:
Average Adjusted Gross Income (AGI) in 2020: $128,051 (Individual Income Tax Returns)
Here:
$128,051
State:
$95,910
Salary/wage: $119,546 (reported on 87.8% of returns)
Here:
$119,546
State:
$77,331
(% of AGI for various income ranges: 1193.1% for AGIs below $25k, 4060.5% for AGIs $25k-50k, 7688.8% for AGIs $50k-75k, 11397.5% for AGIs $75k-100k, 23743.3% for AGIs $100k-200k, 130472.7% for AGIs over 200k)
Taxable interest for individuals: $1,693 (reported on 43.1% of returns)
This zip code:
$1,693
California:
$2,294
(% of AGI for various income ranges: 28.6% for AGIs below $25k, 45.5% for AGIs $25k-50k, 46.4% for AGIs $50k-75k, 64.2% for AGIs $75k-100k, 177.8% for AGIs $100k-200k, 808.2% for AGIs over 200k)
Ordinary dividends: $4,024 (reported on 34.9% of returns)
Here:
$4,024
State:
$10,949
(% of AGI for various income ranges: 35.1% for AGIs below $25k, 43.6% for AGIs $25k-50k, 64.9% for AGIs $50k-75k, 98.6% for AGIs $75k-100k, 251.7% for AGIs $100k-200k, 2023.9% for AGIs over 200k)
Net capital gain/loss in AGI: +$29,047 (reported on 36.8% of returns)
Here:
+$29,047
State:
+$49,306
(% of AGI for various income ranges: 25.9% for AGIs below $25k, 80.3% for AGIs $25k-50k, 150.6% for AGIs $50k-75k, 187.8% for AGIs $75k-100k, 794.0% for AGIs $100k-200k, 20839.6% for AGIs over 200k)
Profit/loss from business: +$12,588 (reported on 12.9% of returns)
Here:
+$12,588
State:
+$15,671
(% of AGI for various income ranges: 150.8% for AGIs below $25k, 177.4% for AGIs $25k-50k, 202.9% for AGIs $50k-75k, 197.4% for AGIs $75k-100k, 333.7% for AGIs $100k-200k, 1202.3% for AGIs over 200k)
Taxable individual retirement arrangement distribution: $20,621 (reported on 5.2% of returns)
95131:
$20,621
California:
$23,505
(% of AGI for various income ranges: 56.9% for AGIs below $25k, 68.2% for AGIs $25k-50k, 146.6% for AGIs $50k-75k, 188.2% for AGIs $75k-100k, 368.5% for AGIs $100k-200k, 598.9% for AGIs over 200k)
Self-employed (Keogh) retirement plans: $20,200 (reported on 0.5% of returns)
95131:
$20,200
California:
$30,163
(% of AGI for various income ranges: 10.4% for AGIs $25k-50k, 23.1% for AGIs $100k-200k, 146.3% for AGIs over 200k)
Total itemized deductions: $31,295 (reported on 16.8% of returns)
Here:
$31,295
State:
$39,517
(% of AGI for various income ranges: 83.7% for AGIs below $25k, 138.5% for AGIs $25k-50k, 369.4% for AGIs $50k-75k, 518.8% for AGIs $75k-100k, 1334.2% for AGIs $100k-200k, 6393.2% for AGIs over 200k)
Charity contributions: $6,214 (reported on 12.3% of returns)
Here:
$6,214
State:
$12,598
(% of AGI for various income ranges: 2.8% for AGIs below $25k, 14.0% for AGIs $25k-50k, 35.5% for AGIs $50k-75k, 70.3% for AGIs $75k-100k, 169.6% for AGIs $100k-200k, 1074.2% for AGIs over 200k)
Taxes paid: $9,632 (reported on 16.7% of returns)
95131:
$9,632
State:
$8,807
(% of AGI for various income ranges: 25.4% for AGIs below $25k, 40.6% for AGIs $25k-50k, 121.2% for AGIs $50k-75k, 175.2% for AGIs $75k-100k, 462.1% for AGIs $100k-200k, 1805.5% for AGIs over 200k)
Earned income credit: $1,612 (reported on 7.5% of returns)
Here:
$1,612
State:
$2,074
(% of AGI for various income ranges: 53.0% for AGIs below $25k, 43.3% for AGIs $25k-50k)
Percentage of individuals using paid preparers for their 2020 taxes: 90.6%
Here:
91%
State:
92%
(% for various income ranges: 86.7% for AGIs below $25k, 90.9% for AGIs $25k-50k, 89.9% for AGIs $50k-75k, 91.4% for AGIs $75k-100k, 91.4% for AGIs $100k-200k, 93.7% for AGIs over 200k)
Averages for the 2012 tax year for zip code 95131, filed in 2013:
Average Adjusted Gross Income (AGI) in 2012: $84,417 (Individual Income Tax Returns)
Here:
$84,417
State:
$72,726
Salary/wage: $83,516 (reported on 89.8% of returns)
Here:
$83,516
State:
$59,079
(% of AGI for various income ranges: 78.8% for AGIs below $25k, 87.7% for AGIs $25k-50k, 87.4% for AGIs $50k-75k, 88.8% for AGIs $75k-100k, 91.7% for AGIs $100k-200k, 88.0% for AGIs over 200k)
Taxable interest for individuals: $783 (reported on 44.0% of returns)
This zip code:
$783
California:
$2,146
(% of AGI for various income ranges: 0.9% for AGIs below $25k, 0.4% for AGIs $25k-50k, 0.3% for AGIs $50k-75k, 0.3% for AGIs $75k-100k, 0.4% for AGIs $100k-200k, 0.4% for AGIs over 200k)
Ordinary dividends: $2,840 (reported on 26.6% of returns)
Here:
$2,840
State:
$9,308
(% of AGI for various income ranges: 1.2% for AGIs below $25k, 0.6% for AGIs $25k-50k, 0.5% for AGIs $50k-75k, 0.7% for AGIs $75k-100k, 0.8% for AGIs $100k-200k, 1.2% for AGIs over 200k)
Net capital gain/loss in AGI: +$5,689 (reported on 27.2% of returns)
Here:
+$5,689
State:
+$30,460
(% of AGI for various income ranges: 0.3% for AGIs $75k-100k, 0.7% for AGIs $100k-200k, 4.9% for AGIs over 200k)
Profit/loss from business: +$13,855 (reported on 13.4% of returns)
Here:
+$13,855
State:
+$17,064
(% of AGI for various income ranges: 10.7% for AGIs below $25k, 3.7% for AGIs $25k-50k, 3.4% for AGIs $50k-75k, 2.5% for AGIs $75k-100k, 1.3% for AGIs $100k-200k, 1.3% for AGIs over 200k)
Taxable individual retirement arrangement distribution: $17,912 (reported on 4.9% of returns)
95131:
$17,912
California:
$19,557
(% of AGI for various income ranges: 1.9% for AGIs below $25k, 1.6% for AGIs $25k-50k, 1.7% for AGIs $50k-75k, 1.5% for AGIs $75k-100k, 1.0% for AGIs $100k-200k, 0.5% for AGIs over 200k)
Self-employment retirement plans: $16,520 (reported on 0.7% of returns)
95131:
$16,520
California:
$24,530
(% of AGI for various income ranges: 0.4% for AGIs $25k-50k, 0.2% for AGIs $100k-200k, 0.2% for AGIs over 200k)
Total itemized deductions: $28,366 (20% of AGI, reported on 42.7% of returns)
Here:
$28,366
State:
$34,004
Here:
19.6% of AGI
State:
22.7% of AGI
(% of AGI for various income ranges: 8.8% for AGIs below $25k, 9.5% for AGIs $25k-50k, 13.8% for AGIs $50k-75k, 14.7% for AGIs $75k-100k, 16.2% for AGIs $100k-200k, 14.4% for AGIs over 200k)
Charity contributions: $2,398 (reported on 31.1% of returns)
Here:
$2,398
State:
$4,659
(% of AGI for various income ranges: 0.3% for AGIs below $25k, 0.7% for AGIs $25k-50k, 1.0% for AGIs $50k-75k, 0.9% for AGIs $75k-100k, 1.1% for AGIs $100k-200k, 0.7% for AGIs over 200k)
Taxes paid: $14,559 (reported on 42.7% of returns)
95131:
$14,559
State:
$14,448
(% of AGI for various income ranges: 2.5% for AGIs below $25k, 2.9% for AGIs $25k-50k, 4.8% for AGIs $50k-75k, 6.4% for AGIs $75k-100k, 8.1% for AGIs $100k-200k, 9.4% for AGIs over 200k)
Earned income credit: $1,845 (reported on 12.2% of returns)
Here:
$1,845
State:
$2,286
(% of AGI for various income ranges: 5.0% for AGIs below $25k, 0.8% for AGIs $25k-50k)
Percentage of individuals using paid preparers for their 2012 taxes: 54.5%
Here:
54%
State:
64%
(% for various income ranges: 56.8% for AGIs below $25k, 59.6% for AGIs $25k-50k, 56.5% for AGIs $50k-75k, 52.1% for AGIs $75k-100k, 47.7% for AGIs $100k-200k, 51.6% for AGIs over 200k)
Averages for the 2004 tax year for zip code 95131, filed in 2005:
Average Adjusted Gross Income (AGI) in 2004: $67,002 (Individual Income Tax Returns)
Here:
$67,002
State:
$58,600
Salary/wage: $65,611 (reported on 91.0% of returns)
Here:
$65,611
State:
$49,455
(% of AGI for various income ranges: 141.5% for AGIs below $10k, 84.3% for AGIs $10k-25k, 91.0% for AGIs $25k-50k, 91.7% for AGIs $50k-75k, 92.9% for AGIs $75k-100k, 86.7% for AGIs over 100k)
Taxable interest for individuals: $1,014 (reported on 54.4% of returns)
This zip code:
$1,014
California:
$2,365
(% of AGI for various income ranges: 5.3% for AGIs below $10k, 1.4% for AGIs $10k-25k, 0.8% for AGIs $25k-50k, 0.5% for AGIs $50k-75k, 0.6% for AGIs $75k-100k, 0.9% for AGIs over 100k)
Taxable dividends: $1,407 (reported on 26.6% of returns)
Here:
$1,407
State:
$4,746
(% of AGI for various income ranges: 4.4% for AGIs below $10k, 0.7% for AGIs $10k-25k, 0.5% for AGIs $25k-50k, 0.3% for AGIs $50k-75k, 0.4% for AGIs $75k-100k, 0.6% for AGIs over 100k)
Net capital gain/loss: +$5,551 (reported on 29.4% of returns)
Here:
+$5,551
State:
+$23,418
(% of AGI for various income ranges: -6.8% for AGIs below $10k, -0.3% for AGIs $10k-25k, -0.2% for AGIs $25k-50k, 0.8% for AGIs $50k-75k, 0.2% for AGIs $75k-100k, 4.4% for AGIs over 100k)
Profit/loss from business: +$13,446 (reported on 13.4% of returns)
Here:
+$13,446
State:
+$16,826
(% of AGI for various income ranges: 9.9% for AGIs below $10k, 7.8% for AGIs $10k-25k, 3.1% for AGIs $25k-50k, 2.9% for AGIs $50k-75k, 2.0% for AGIs $75k-100k, 2.3% for AGIs over 100k)
IRA payment deduction: $3,188 (reported on 3.1% of returns)
95131:
$3,188
California:
$3,192
(% of AGI for various income ranges: 0.8% for AGIs below $10k, 0.3% for AGIs $10k-25k, 0.3% for AGIs $25k-50k, 0.1% for AGIs $50k-75k, 0.2% for AGIs $75k-100k, 0.1% for AGIs over 100k)
Self-employed pension: $10,634 (reported on 0.8% of returns)
Here:
$10,634
California:
$17,688
(% of AGI for various income ranges: 0.2% for AGIs $10k-25k, 0.1% for AGIs $50k-75k, 0.1% for AGIs $75k-100k, 0.2% for AGIs over 100k)
Total itemized deductions: $24,418 (23% of AGI, reported on 47.9% of returns)
Here:
$24,418
State:
$28,113
Here:
23.1% of AGI
State:
25.3% of AGI
(% of AGI for various income ranges: 29.8% for AGIs below $10k, 12.3% for AGIs $10k-25k, 15.6% for AGIs $25k-50k, 20.4% for AGIs $50k-75k, 19.7% for AGIs $75k-100k, 16.7% for AGIs over 100k)
Charity contributions deductions: $2,364 (2% of AGI, reported on 39.9% of returns)
Here:
$2,364
State:
$3,923
Here:
2.2% of AGI
State:
3.3% of AGI
(% of AGI for various income ranges: 0.9% for AGIs below $10k, 0.7% for AGIs $10k-25k, 1.1% for AGIs $25k-50k, 1.5% for AGIs $50k-75k, 1.6% for AGIs $75k-100k, 1.5% for AGIs over 100k)
Total tax: $10,878 (reported on 81.8% of returns)
95131:
$10,878
State:
$10,761
(% of AGI for various income ranges: 4.9% for AGIs below $10k, 4.5% for AGIs $10k-25k, 6.9% for AGIs $25k-50k, 9.5% for AGIs $50k-75k, 11.1% for AGIs $75k-100k, 17.1% for AGIs over 100k)
Earned income credit: $1,542 (reported on 9.6% of returns)
Here:
$1,542
State:
$1,763
Percentage of individuals using paid preparers for their 2004 taxes: 54.5%
Here:
54%
State:
66%
(% for various income ranges: 50.5% for AGIs below $10k, 59.5% for AGIs $10k-25k, 62.4% for AGIs $25k-50k, 56.8% for AGIs $50k-75k, 49.1% for AGIs $75k-100k, 46.2% for AGIs over 100k)
Likely homosexual households (counted as self-reported same-sex unmarried-partner households)
Lesbian couples: 0.2% of all households
Gay men: 0.3% of all households
Household received Food Stamps/SNAP in the past 12 months: 557 Household did not receive Food Stamps/SNAP in the past 12 months: 9,217
Women who had a birth in the past 12 months: 461 (438 now married, 20 unmarried) Women who did not have a birth in the past 12 months: 7,073 (3,695 now married, 3,340 unmarried)
Housing units in zip code 95131 with a mortgage: 4,070 (408 second mortgage, 10 home equity loan, 366 both second mortgage and home equity loan) Houses without a mortgage: 23
Median monthly owner costs for units with a mortgage: $3,524 Median monthly owner costs for units without a mortgage: $1,076
Residents with income below the poverty level in 2022:
This zip code:
7.2%
Whole state:
12.2%
Residents with income below 50% of the poverty level in 2022:
This zip code:
3.1%
Whole state:
6.2%
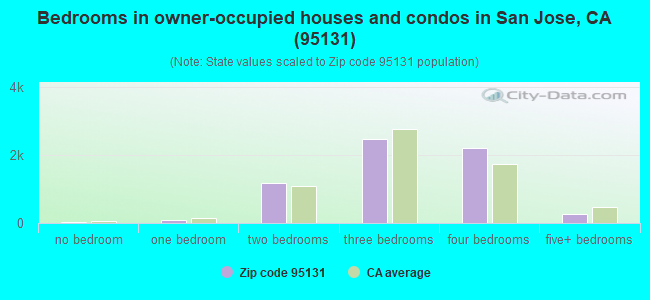
Median number of rooms in houses and condos:
Here:
5.6
State:
6.0
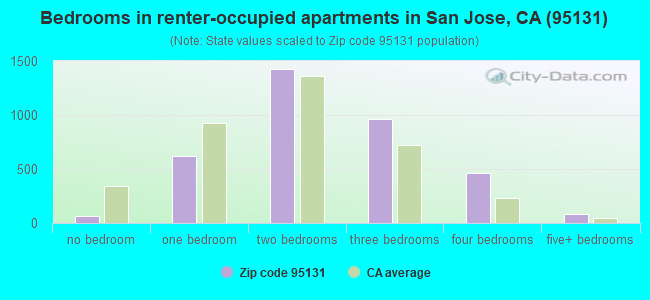
Median number of rooms in apartments:
Here:
4.3
State:
3.9
Notable locations in this zip code not listed on our city pages
4,645 married couples with children.
604 single-parent households (130 men, 474 women).
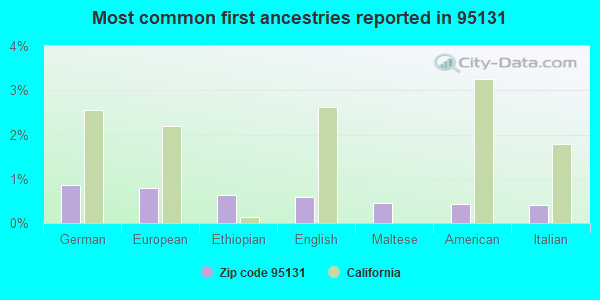
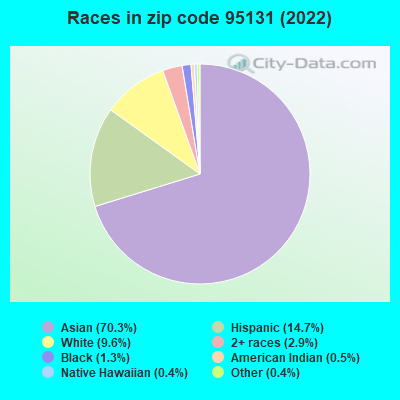
32.7% of residents of 95131 zip code speak English at home.
8.7% of residents speak Spanish at home (64% very well, 18% well, 17% not well, 1% not at all).
7.4% of residents speak other Indo-European language at home (84% very well, 13% well, 1% not well, 3% not at all).
50.6% of residents speak Asian or Pacific Island language at home (50% very well, 29% well, 16% not well, 4% not at all).
0.6% of residents speak other language at home (83% very well, 9% well, 8% not well).
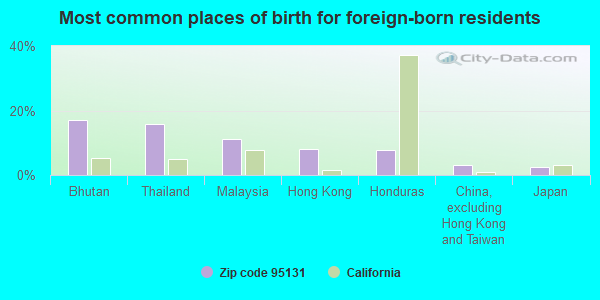
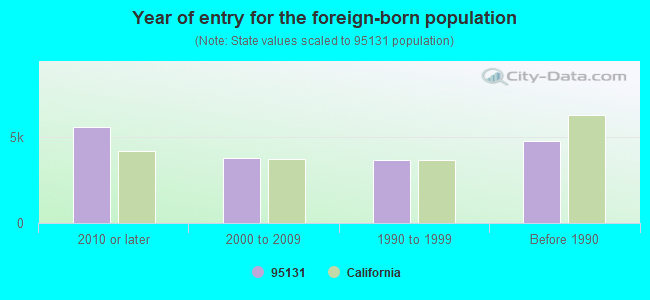
Foreign born population: 17,003 (54.7%) (57.7% of them are naturalized citizens)
Major facilities with environmental interests located in this zip code:
APPLIED ANODIZE INC (622 CHARCOT AVE UNIT E in SAN JOSE, CA)
STATE MASTER (California - Hazardous Waste Tracking) - HAZARDOU WASTE PROGRAM (Integrated Compliance Information System) - ICIS-09-2003-0043, FORMAL ENFORCEMENT ACTION CRITERIA AND HAZARDOUS AIR POLLUTANT INVENTORY (Inventory of air pollution sources) HAZARDOUS WASTE BIENNIAL REPORTER (Resource Conservation and Recovery Act (tracking hazardous waste)) Large Quantity Generators, more that 1000 kg of hazardous waste/month (Resource Conservation and Recovery Act (tracking hazardous waste)) Business SIC classification: ELECTROPLATING, PLATING, POLISHING, ANODIZING, AND COLORING Business NAICS classification: PLATE WORK MANUFACTURING. Organizations: JOSE L. MUGUERZA (CONTACT/OWNER)
AGILENT TECHNOLOGIES INCORPORATED (350 WEST TRIMBLE ROAD in SAN JOSE, CA)
STATE MASTER (California - Hazardous Waste Tracking) - HAZARDOU WASTE PROGRAM CRITERIA AND HAZARDOUS AIR POLLUTANT INVENTORY (Inventory of air pollution sources) National Pollutant Discharge Elimination System NON-MAJOR (Tracking pollutant discharge elimination systems) - permit HAZARDOUS WASTE BIENNIAL REPORTER (Resource Conservation and Recovery Act (tracking hazardous waste)) Large Quantity Generators, more that 1000 kg of hazardous waste/month (Resource Conservation and Recovery Act (tracking hazardous waste)) - notification TRI REPORTER (Tracking of toxic chemicals releasing facilities) Business SIC classification: SEMICONDUCTORS AND RELATED DEVICES; INSTRUMENTS FOR MEASURING AND TESTING OF ELECTRICITY AND ELECTRICAL SIGNALS Business NAICS classification: SEMICONDUCTOR AND RELATED DEVICE MANUFACTURING. Organizations: AVAGO TECHNOLOGIES U S INC (CONTACT/OPERATOR)
Alternative names: HEWLETT-PACKARD CO, HEWLETT PACKARD COMPANY SAN JOSE SITE, LUMILEDS LIGHTNING U S LLC
FLEXTRONICS (2243 LUNDY AVE. in SAN JOSE, CA)
STATE MASTER (California - Hazardous Waste Tracking) - HAZARDOU WASTE PROGRAM HAZARDOUS WASTE BIENNIAL REPORTER (Resource Conservation and Recovery Act (tracking hazardous waste)) Large Quantity Generators, more that 1000 kg of hazardous waste/month (Resource Conservation and Recovery Act (tracking hazardous waste)) Large Quantity Generators, more that 1000 kg of hazardous waste/month (Resource Conservation and Recovery Act (tracking hazardous waste)) - notification TRI REPORTER (Tracking of toxic chemicals releasing facilities) Business SIC classification: PRINTED CIRCUIT BOARDS Business NAICS classification: PRINTED CIRCUIT ASSEMBLY (ELECTRONIC ASSEMBLY) MANUFACTURING.; PRINTED CIRCUIT ASSEMBLY (ELECTRONIC ASSEMBLY) MANUFACTURING. Alternative names: FLEXTRONICS INTERNATIONAL, FLEXTRONIX INTERNATIONAL
MICREL INCORPORATED (1849 FORTUNE DRIVE in SAN JOSE, CA)
STATE MASTER (California - Hazardous Waste Tracking) - HAZARDOU WASTE PROGRAM CRITERIA AND HAZARDOUS AIR POLLUTANT INVENTORY (Inventory of air pollution sources) HAZARDOUS WASTE BIENNIAL REPORTER (Resource Conservation and Recovery Act (tracking hazardous waste)) Large Quantity Generators, more that 1000 kg of hazardous waste/month (Resource Conservation and Recovery Act (tracking hazardous waste)) TRI REPORTER (Tracking of toxic chemicals releasing facilities) Business SIC classification: SEMICONDUCTORS AND RELATED DEVICES; ELECTRIC SERVICES Business NAICS classification: SEMICONDUCTOR AND RELATED DEVICE MANUFACTURING. Organizations: MICREL SEMICONDUCTOR (CONTACT/OPERATOR)
Alternative names: MICREL INC., MICREL SEMICONDUCTOR, SEEQ TECH. INC.
LUMILEDS LIGHTING US L.L.C. (370 W. TRIMBLE RD. in SAN JOSE, CA)
STATE MASTER (California - Hazardous Waste Tracking) - HAZARDOU WASTE PROGRAM CRITERIA AND HAZARDOUS AIR POLLUTANT INVENTORY (Inventory of air pollution sources) HAZARDOUS WASTE BIENNIAL REPORTER (Resource Conservation and Recovery Act (tracking hazardous waste)) Large Quantity Generators, more that 1000 kg of hazardous waste/month (Resource Conservation and Recovery Act (tracking hazardous waste)) - notification TRI REPORTER (Tracking of toxic chemicals releasing facilities) Business SIC classification: SEMICONDUCTORS AND RELATED DEVICES Business NAICS classification: SEMICONDUCTOR AND RELATED DEVICE MANUFACTURING. Organizations: PHILIPS LUMILEDS LIGHTING COMPANY LLC (CONTACT/OPERATOR)
, PHILIPS LIGHTING (CONTACT/OWNER)
Alternative names: LUMILEDS LIGHTNING U S LLC, MITCHELL COLE M/S 91BJ
FLEXTRONICS (1710 FORTUNE DR. in SAN JOSE, CA)
STATE MASTER (California - Hazardous Waste Tracking) - HAZARDOU WASTE PROGRAM CRITERIA AND HAZARDOUS AIR POLLUTANT INVENTORY (Inventory of air pollution sources) HAZARDOUS WASTE BIENNIAL REPORTER (Resource Conservation and Recovery Act (tracking hazardous waste)) Large Quantity Generators, more that 1000 kg of hazardous waste/month (Resource Conservation and Recovery Act (tracking hazardous waste)) - notification TRI REPORTER (Tracking of toxic chemicals releasing facilities) Business SIC classification: PRINTED CIRCUIT BOARDS; ELECTRONIC COMPONENTS Business NAICS classification: PRINTED CIRCUIT ASSEMBLY (ELECTRONIC ASSEMBLY) MANUFACTURING. Organizations: UNITED CAPITAL CORP (CONTACT/OWNER)
Alternative names: FLEXTRONICS INTERNATIONAL
KOMAG INCORPORATED BUILDING 10 (1710 AUTOMATION PKY. in SAN JOSE, CA)
STATE MASTER (California - Hazardous Waste Tracking) - HAZARDOU WASTE PROGRAM COMPLIANCE ACTIVITY (Tracking inspections of insecticide, fungicide, and rodenticide, and toxic substances) CRITERIA AND HAZARDOUS AIR POLLUTANT INVENTORY (Inventory of air pollution sources) HAZARDOUS WASTE BIENNIAL REPORTER (Resource Conservation and Recovery Act (tracking hazardous waste)) Large Quantity Generators, more that 1000 kg of hazardous waste/month (Resource Conservation and Recovery Act (tracking hazardous waste)) TRI REPORTER (Tracking of toxic chemicals releasing facilities) Business SIC and NAICS classification: MAGNETIC AND OPTICAL RECORDING MEDIA Alternative names: KOMAG INC., BLDG 6
KION TECHNOLOGY, INC (2190 OLD OAKLAND RD in SAN JOSE, CA)
STATE MASTER (California - Hazardous Waste Tracking) - HAZARDOU WASTE PROGRAM HAZARDOUS WASTE BIENNIAL REPORTER (Resource Conservation and Recovery Act (tracking hazardous waste)) Large Quantity Generators, more that 1000 kg of hazardous waste/month (Resource Conservation and Recovery Act (tracking hazardous waste)) Business NAICS classification: ELECTROPLATING, PLATING, POLISHING, ANODIZING, AND COLORING. Organizations: MOTOHISA HAYASHI (CONTACT/OPERATOR)
MMC TEHCNOLOGY INCORPORATED (2001 FORTUNE DRIVE in SAN JOSE, CA)
STATE MASTER (California - Hazardous Waste Tracking) - HAZARDOU WASTE PROGRAM CRITERIA AND HAZARDOUS AIR POLLUTANT INVENTORY (Inventory of air pollution sources) HAZARDOUS WASTE BIENNIAL REPORTER (Resource Conservation and Recovery Act (tracking hazardous waste)) Large Quantity Generators, more that 1000 kg of hazardous waste/month (Resource Conservation and Recovery Act (tracking hazardous waste)) - notification TRI REPORTER (Tracking of toxic chemicals releasing facilities) Business SIC and NAICS classification: MAGNETIC AND OPTICAL RECORDING MEDIA Alternative names: M M C TECHNOLOGY INC, MAXMEDIA A DIV OF HYUNDAI ELECT, MMC TECH. INC.
KOMAG INCORPORATED BUILDING 6 (1735 LUNDY AVE. in SAN JOSE, CA)
STATE MASTER (California - Hazardous Waste Tracking) - HAZARDOU WASTE PROGRAM CRITERIA AND HAZARDOUS AIR POLLUTANT INVENTORY (Inventory of air pollution sources) HAZARDOUS WASTE BIENNIAL REPORTER (Resource Conservation and Recovery Act (tracking hazardous waste)) Small Quantity Generators, between 100 kg and 1000 kg of hazardous waste/month (Resource Conservation and Recovery Act (tracking hazardous waste)) - notification TRI REPORTER (Tracking of toxic chemicals releasing facilities) Business SIC classification: MAGNETIC AND OPTICAL RECORDING MEDIA Organizations: METROMEDIA FIBER NETWORK (CONTACT/OWNER)
Alternative names: ABOVENET COMMUNICATIONS, KOMAG INC.
ACCUMEN TECHNOLOGY (2225 RINGWOOD AVE in SAN JOSE, CA)
STATE MASTER (California - Hazardous Waste Tracking) - HAZARDOU WASTE PROGRAM Large Quantity Generators, more that 1000 kg of hazardous waste/month (Resource Conservation and Recovery Act (tracking hazardous waste)) - notification
HILL BROTHERS CHEMICAL COMPANY (410 CHARCOT AVE. in SAN JOSE, CA)
STATE MASTER (California - Hazardous Waste Tracking) - HAZARDOU WASTE PROGRAM CRITERIA AND HAZARDOUS AIR POLLUTANT INVENTORY (Inventory of air pollution sources) Small Quantity Generators, between 100 kg and 1000 kg of hazardous waste/month (Resource Conservation and Recovery Act (tracking hazardous waste)) TRI REPORTER (Tracking of toxic chemicals releasing facilities) Business SIC classification: INDUSTRIAL INORGANIC CHEMICALS
MICROLINEAR CORPORATION (2092 CONCOURSE DRIVE in SAN JOSE, CA)
STATE MASTER (California - Hazardous Waste Tracking) - HAZARDOU WASTE PROGRAM Large Quantity Generators, more that 1000 kg of hazardous waste/month (Resource Conservation and Recovery Act (tracking hazardous waste)) Business NAICS classification: SEMICONDUCTOR AND RELATED DEVICE MANUFACTURING. Alternative names: MICRO LINEAR
Housing units lacking complete plumbing facilities: 0.4% Housing units lacking complete kitchen facilities: 0.7%
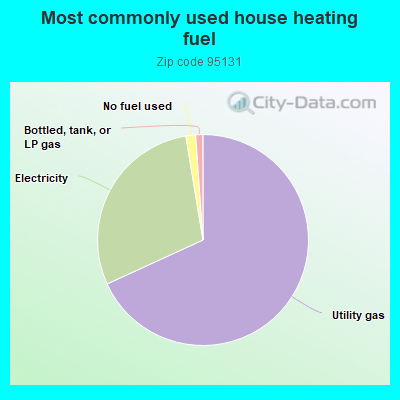
68.1%Utility gas
29.2%Electricity
1.5%No fuel used
1.1%Bottled, tank, or LP gas
Population in 1990: 18,425. Population change in the 1990s: +7,959 (+43.2%).
Place of birth for U.S.-born residents:
This state: 11,641
Northeast: 321
Midwest: 489
South: 899
West: 388
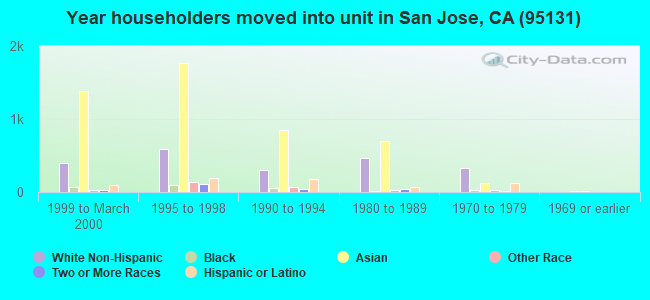
51% of the 95131 zip code residents lived in the same house 5 years ago. Out of people who lived in different houses, 69% lived in this county. Out of people who lived in different counties, 50% lived in California.
89% of the 95131 zip code residents lived in the same house 1 year ago. Out of people who lived in different houses, 55% moved from this county. Out of people who lived in different houses, 16% moved from different county within same state. Out of people who lived in different houses, 8% moved from different state. Out of people who lived in different houses, 23% moved from abroad.
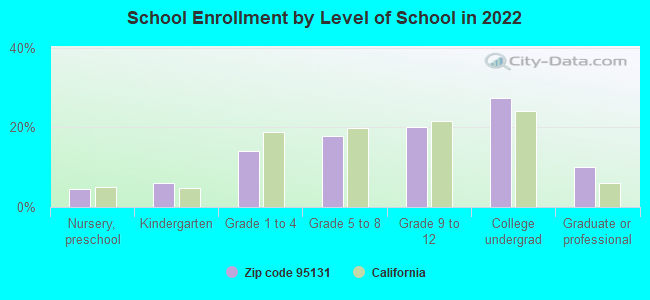
Private vs. public school enrollment:
Students in private schools in grades 1 to 8 (elementary and middle school): 505
Here:
20.6%
California:
10.5%
Students in private schools in grades 9 to 12 (high school): 230
Here:
15.0%
California:
8.5%
Students in private undergraduate colleges: 157
Here:
7.6%
California:
15.9%
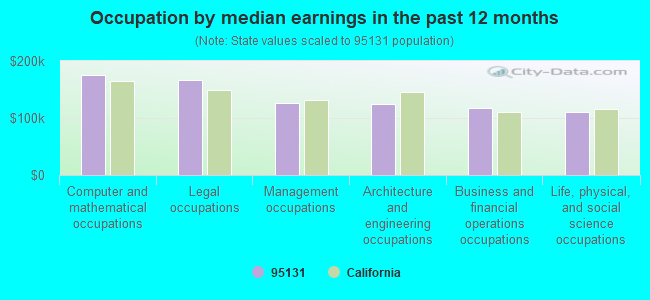
Occupation by median earnings in the past 12 months ($)
175,061Computer and mathematical occupations
166,541Legal occupations
125,519Management occupations
124,320Architecture and engineering occupations
116,846Business and financial operations occupations
109,842Life, physical, and social science occupations
Companies with biggest federal contracts located in this zip code (SAN JOSE, CA):
SOUTH BAY MAINT CO INC (2211-A FORTUNE DRIVE; small business) : $28,854,330 in 45 contractsfrom 1999 to 2004
Contracts for Custodial Janitorial Services, Landscaping/Groundskeeping Services, Facilities Operations Support Services, Administrative and Service Buildings, and moreby NASA, Air Force, Public Buildings Service, Navy, and others Signed by year:2000: $3,071,000; 2001: $8,829,740; 2002: $6,403,669; 2003: $7,025,009; 2004: $231,912; 2005: $0; 2006: $0.
Biggest contracts:
$2,793,000 with NASA for Custodial Janitorial Services. Signed on 1999-12-15. Completion date: 2003-06-15.
$2,246,349 with Air Force for Custodial Janitorial Services. Signed on 2002-11-05. Completion date: 2003-09-30.
$2,148,030 with Air Force for Landscaping/Groundskeeping Services. Signed on 2001-09-24. Completion date: 2001-09-24.
$2,049,269 with Air Force for Custodial Janitorial Services. Signed on 2001-10-01. Completion date: 2001-10-01.
ZERIMAR CORPORATION (2081 BERING DRIVE, SUITE J; small business) : $11,553,127 in 56 contractsfrom 1999 to 2002
Contracts for Maintenance, Repair or Alteration of Real Property -- Other Non-Building Facilities, Construction of Structures and Facilities -- Other Conservation and Development Facilities, Construction of Structures and Facilities -- Other Non-Building Facilities, Maintenance, Repair or Alteration of Real Property -- Office Buildings, and moreby U.S. Army Corps of Engineers - civil program financing only, Air Force, Public Buildings Service Signed by year:2000: $7,873,334; 2001: $510,292; 2002: -$69,000; 2003: $0; 2004: $0; 2005: $0; 2006: $0.
Biggest contracts:
$2,300,000 with U.S. Army Corps of Engineers - civil program financing only for Maintenance, Repair or Alteration of Real Property -- Other Non-Building Facilities. Signed on 2000-02-24. Completion date: 2000-08-26.
$1,892,930, same as above.Signed on 2000-12-18. Completion date: 2000-11-08.
$1,440,000, same as above.Signed on 2000-09-13. Completion date: 2000-09-03.
$1,328,880 with U.S. Army Corps of Engineers - civil program financing only for Construction of Structures and Facilities -- Other Conservation and Development Facilities. Signed on 1999-12-29. Completion date: 2000-01-31.
AKON, INC (2135 RINGWOOD AVE; small business) : $2,064,896 in 18 contractsfrom 2000 to 2005
Contracts for Amplifiers, Stimulated Coherent Radiation Devices, Components and Accessories, Other ADP and Telecommunications Services (includes data storage on tapes, compact disks, etc.), Miscellaneous Communication Equipment, and moreby Air Force, Defense Logistics Agency, Navy, Federal Technology Service, and others Signed by year:2000: $539,376; 2001: $317,527; 2002: $284,268; 2003: $124,350; 2004: $304,636; 2005: $494,739; 2006: $0.
Biggest contracts:
$415,875 with Air Force for Amplifiers. Signed on 2005-01-28. Completion date: 2005-10-28.
$317,527 with Defense Logistics Agency for Amplifiers. Signed on 2001-07-24. Completion date: 2002-05-09.
$188,013 with Navy for Stimulated Coherent Radiation Devices, Components and Accessories. Signed on 2002-01-15. Completion date: 2002-06-30.
$158,000 with Federal Technology Service for Other ADP and Telecommunications Services (includes data storage on tapes, compact disks, etc.). Signed on 2000-08-15. Completion date: 2000-09-15.
AUDAVI CORP (1520 MONTAGUE EXPRESSWAY; small business) : $1,696,539 in 10 contractsfrom 2004 to 2006
Contracts for Electrical and Electronic assemblies, Boards, Cards, and Associated Hardware, ADP Supplies, ADP Input/Output and Storage Devices, Equipment and Materials Testing -- Miscellaneous, and moreby Navy, Army Signed by year:2000: $0; 2001: $0; 2002: $0; 2003: $0; 2004: $20,599; 2005: $851,600; 2006: $824,340.
Biggest contracts:
$900,000 with Navy for Electrical and Electronic assemblies, Boards, Cards, and Associated Hardware. Signed on 2006-04-06. Completion date: 2006-08-30.
$476,000 with Navy for ADP Supplies. Taking place in TX. Signed on 2005-08-02. Completion date: 2005-09-30.
$353,600 with Navy for ADP Supplies. Signed on 2005-10-31. Completion date: 2005-12-30.
$86,500 with Navy for Electrical and Electronic assemblies, Boards, Cards, and Associated Hardware. Signed on 2006-06-21. Completion date: 2006-08-10.
RAINBOW COMMUNICATIONS, INC (2362 QUME DR STE F; small business) : $1,500,975 in 7 contractsfrom 2001 to 2005
Contracts for Other Defense -- Applied Research and Exploratory Development (R&D), Physical Sciences -- Management and Support (R&D), Weapons -- Applied Research and Exploratory Development (R&D), Defense Electronics and Communication Equipment -- Basic Research (R&D) by Army, Air Force, Navy Signed by year:2000: $0; 2001: $97,803; 2002: $0; 2003: $374,991; 2004: $654,935; 2005: $373,246; 2006: $0.
Biggest contracts:
$374,991 with Army for Other Defense -- Applied Research and Exploratory Development (R&D). Signed on 2003-01-24. Completion date: 2005-05-06.
$374,962, same as above.Signed on 2004-02-23. Completion date: 2005-05-06.
$373,246 with Air Force for Physical Sciences -- Management and Support (R&D). Signed on 2005-10-13. Completion date: 2006-10-14.
$99,996 with Air Force for Weapons -- Applied Research and Exploratory Development (R&D). Signed on 2004-04-26. Completion date: 2005-04-15.
BARKER TOOL & SUPPLY (2123 BERING DRIVE UNIT L; small business) : $917,997 in 93 contractsfrom 2002 to 2006
Contracts for Miscellaneous Ship and Marine Equipment, Hand Tools, Nonedged, Nonpowered, Airframe Structural Components, Structural Shapes, and moreby Minerals Management Service, Navy, Federal Supply Service, Public Buildings Service, and others Signed by year:2000: $0; 2001: $0; 2002: $22,626; 2003: $151,522; 2004: $518,557; 2005: $116,436; 2006: $108,856.
Biggest contracts:
$245,414 with Minerals Management Service for Miscellaneous Ship and Marine Equipment. Taking place in VA. Signed on 2004-04-01. Effective on 2004-03-24. Completion date: 2004-09-03.
$201,800 with Navy for Hand Tools, Nonedged, Nonpowered. Signed on 2004-09-30. Completion date: 2004-11-29.
$70,234 with Navy for Airframe Structural Components. Signed on 2003-08-06. Completion date: 2003-11-12.
$50,907 with Federal Supply Service for Hand Tools, Nonedged, Nonpowered. Signed on 2006-01-13. Completion date: 2006-03-13.
IONIC SYSTEMS INC (2161 O'TOOLE AVENUE UNIT H; small business) : $890,592 in 4 contractsfrom 2000 to 2006
$699,338 with Department of Defense for Other Defense -- Applied Research and Exploratory Development (R&D). Signed on 2002-05-09. Completion date: 2003-03-31.
$99,990 with Air Force for Defense Electronics and Communication Equipment -- Management and Support (R&D). Signed on 2006-05-05. Completion date: 2007-01-26.
$66,307 with Navy for Defense Ships -- Basic Research (R&D). Signed on 2000-06-09. Completion date: 2000-12-08.
$24,957 with Defense Advanced Research Projects Agency for Other Defense -- Basic Research (R&D). Signed on 2003-10-21. Completion date: 2004-10-21.
SPYRUS (2355 OAKLAND RD # 1; small business) : $548,109 in 7 contractsfrom 1999 to 2006
Contracts for Engineering and Technical Services, ADP Support Equipment, Other ADP and Telecommunications Services (includes data storage on tapes, compact disks, etc.), ADP Input/Output and Storage Devices, and moreby Navy, Federal Technology Service, Department of Defense, Drug Enforcement Administration, and others Signed by year:2000: $0; 2001: $0; 2002: $0; 2003: $28,200; 2004: $2,186; 2005: $16,164; 2006: $3,050.
Biggest contracts:
$498,509 with Navy for Engineering and Technical Services. Signed on 1999-11-20. Completion date: 2000-11-19.
$28,200 with Federal Technology Service for ADP Support Equipment. Signed on 2003-04-15. Completion date: 2003-05-15.
$9,500 with Department of Defense for Other ADP and Telecommunications Services (includes data storage on tapes, compact disks, etc.). Taking place in DC. Signed on 2005-09-09. Completion date: 2005-10-09.
$6,664 with Department of Defense for ADP Support Equipment. Taking place in VA. Signed on 2005-02-23. Completion date: 2005-02-25.
BEA SYSTEMS, INC (2315 N 1ST ST) : $536,600 in 13 contractsfrom 2000 to 2006
Contracts for Miscellaneous Items, Program Management/Support Services, Other Education and Training Services, ADP Software, and moreby Navy, Federal Bureau of Investigation, Department of Defense, Federal Technology Service, and others Signed by year:2000: $68,000; 2001: $0; 2002: $46,400; 2003: $67,000; 2004: $0; 2005: $223,100; 2006: $132,100.
Biggest contracts:
$99,550 with Navy for Miscellaneous Items. Signed on 2005-08-15. Completion date: 2005-11-30.
$99,550, same as above.Signed on 2005-05-12. Completion date: 2005-08-31.
$92,500 with Navy for Program Management/Support Services. Signed on 2006-06-14. Completion date: 2006-09-30.
$68,000 with Federal Bureau of Investigation for Other Education and Training Services. Taking place in MA. Signed on 2000-02-15. Completion date: 2000-04-15.
VERAZ NETWORKS, INC (926 ROCK AVE; small business) : $425,456 in 2 contractsfrom 2003 to 2004
$360,243 with Navy for Miscellaneous Communication Equipment. Taking place in MD. Signed on 2003-12-18. Completion date: 2004-01-09.
$65,213, same as above.Signed on 2004-10-04. Completion date: 2004-01-09.
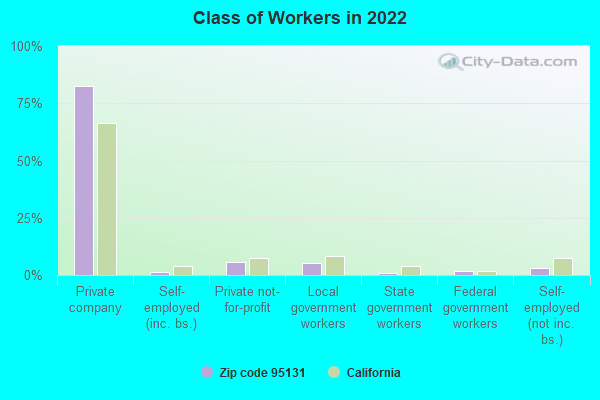
Top industries in this zip code by the number of employees in 2005:
Wholesale Trade: Other Electronic Parts and Equipment Merchant Wholesalers (250-499: 1, 100-249: 5, 50-99: 5, 20-49: 11, 10-19: 13, 5-9: 12, 1-4: 28)
Administrative and Support and Waste Management and Remediation Services: Temporary Help Services (over 1000: 1, 250-499: 1, 50-99: 2, 20-49: 1, 5-9: 2, 1-4: 3)
Finance and Insurance: Financial Transactions Processing, Reserve, and Clearinghouse Activities (over 1000: 1)
Professional, Scientific, and Technical Services: Research and Development in the Physical, Engineering, and Life Sciences (100-249: 2, 50-99: 5, 20-49: 1, 10-19: 3, 5-9: 1, 1-4: 9)
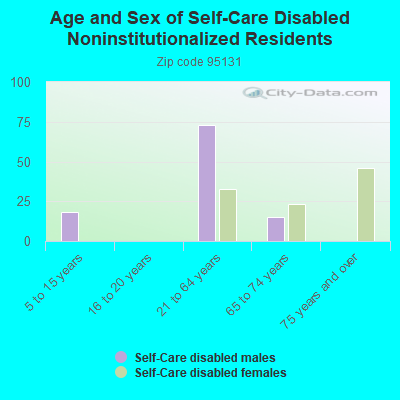
People in group quarters in 2010:
62 people in group homes intended for adults
14 people in residential treatment centers for adults
7 people in workers' group living quarters and job corps centers
3 people in other noninstitutional facilities
People in group quarters in 2000:
18 people in nursing homes
18 people in other noninstitutional group quarters
Fatal accident statistics in 2012:
Fatal accident count: 2
Vehicles involved in fatal accidents: 2
Fatal accidents caused by drunken drivers: 0
Fatalities: 2
Persons involved in fatal accidents: 7
Pedestrians involved in fatal accidents: 2
Home Mortgage Disclosure Act Aggregated Statistics For Year 2009 (Based on 6 full and 6 partial tracts)
A) FHA, FSA/RHS & VA Home Purchase Loans
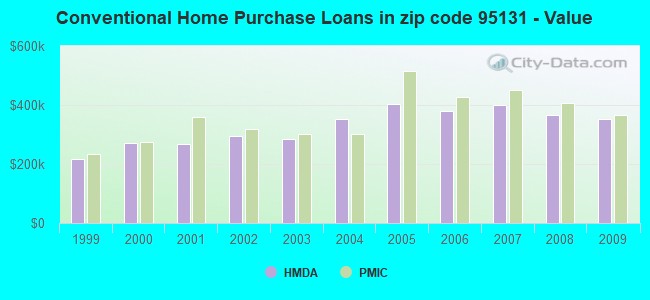
B) Conventional Home Purchase Loans
C) Refinancings
D) Home Improvement Loans
E) Loans on Dwellings For 5+ Families
F) Non-occupant Loans on < 5 Family Dwellings (A B C & D)
G) Loans On Manufactured Home Dwelling (A B C & D)
Number
Average Value
Number
Average Value
Number
Average Value
Number
Average Value
Number
Average Value
Number
Average Value
Number
Average Value
LOANS ORIGINATED
84
$445,338
463
$351,988
2,218
$336,974
55
$279,346
1
$22,664,540
121
$262,891
8
$75,624
APPLICATIONS APPROVED, NOT ACCEPTED
8
$418,786
79
$335,054
454
$363,857
4
$382,562
0
$0
12
$272,028
2
$61,830
APPLICATIONS DENIED
22
$384,769
95
$257,818
530
$373,087
22
$214,327
0
$0
28
$241,526
27
$74,158
APPLICATIONS WITHDRAWN
15
$389,583
65
$345,793
292
$343,671
14
$162,089
0
$0
33
$258,137
1
$71,450
FILES CLOSED FOR INCOMPLETENESS
4
$433,948
16
$360,633
102
$379,037
2
$398,480
0
$0
5
$351,484
1
$161,450
Aggregated Statistics For Year 2008 (Based on 6 full and 6 partial tracts)
A) FHA, FSA/RHS & VA Home Purchase Loans
B) Conventional Home Purchase Loans
C) Refinancings
D) Home Improvement Loans
E) Loans on Dwellings For 5+ Families
F) Non-occupant Loans on < 5 Family Dwellings (A B C & D)
G) Loans On Manufactured Home Dwelling (A B C & D)
Number
Average Value
Number
Average Value
Number
Average Value
Number
Average Value
Number
Average Value
Number
Average Value
Number
Average Value
LOANS ORIGINATED
20
$503,508
664
$364,771
1,067
$370,768
54
$193,440
0
$0
78
$307,631
14
$78,351
APPLICATIONS APPROVED, NOT ACCEPTED
4
$348,558
200
$380,745
287
$401,696
16
$168,731
0
$0
14
$277,991
22
$88,400
APPLICATIONS DENIED
8
$412,686
172
$382,181
522
$422,799
46
$157,061
0
$0
50
$359,872
27
$70,739
APPLICATIONS WITHDRAWN
3
$603,463
147
$370,635
227
$367,440
20
$270,873
2
$585,120
20
$298,455
2
$62,175
FILES CLOSED FOR INCOMPLETENESS
6
$340,722
38
$363,651
91
$422,345
12
$192,426
0
$0
0
$0
1
$20,610
Aggregated Statistics For Year 2007 (Based on 6 full and 6 partial tracts)
B) Conventional Home Purchase Loans
C) Refinancings
D) Home Improvement Loans
F) Non-occupant Loans on < 5 Family Dwellings (A B C & D)
G) Loans On Manufactured Home Dwelling (A B C & D)
Number
Average Value
Number
Average Value
Number
Average Value
Number
Average Value
Number
Average Value
LOANS ORIGINATED
1,006
$401,370
1,503
$408,111
117
$275,259
131
$352,114
24
$81,350
APPLICATIONS APPROVED, NOT ACCEPTED
324
$414,688
393
$416,900
33
$223,323
31
$340,311
11
$99,473
APPLICATIONS DENIED
400
$343,648
618
$412,000
67
$289,240
60
$333,444
56
$86,733
APPLICATIONS WITHDRAWN
115
$378,386
286
$417,274
18
$273,693
26
$314,573
2
$40,535
FILES CLOSED FOR INCOMPLETENESS
33
$399,017
89
$424,646
10
$180,933
1
$328,660
1
$49,460
Aggregated Statistics For Year 2006 (Based on 6 full and 6 partial tracts)
B) Conventional Home Purchase Loans
C) Refinancings
D) Home Improvement Loans
E) Loans on Dwellings For 5+ Families
F) Non-occupant Loans on < 5 Family Dwellings (A B C & D)
G) Loans On Manufactured Home Dwelling (A B C & D)
Number
Average Value
Number
Average Value
Number
Average Value
Number
Average Value
Number
Average Value
Number
Average Value
LOANS ORIGINATED
1,182
$378,738
1,547
$388,574
198
$321,619
0
$0
126
$343,185
22
$73,620
APPLICATIONS APPROVED, NOT ACCEPTED
314
$378,292
321
$408,145
24
$233,648
0
$0
27
$354,599
16
$83,062
APPLICATIONS DENIED
385
$374,962
497
$414,845
91
$234,541
2
$40,145,500
59
$367,233
39
$70,170
APPLICATIONS WITHDRAWN
197
$401,586
315
$412,637
19
$353,499
0
$0
29
$392,533
1
$95,490
FILES CLOSED FOR INCOMPLETENESS
47
$421,149
90
$377,010
9
$167,183
0
$0
14
$435,264
0
$0
Aggregated Statistics For Year 2005 (Based on 6 full and 6 partial tracts)
B) Conventional Home Purchase Loans
C) Refinancings
D) Home Improvement Loans
F) Non-occupant Loans on < 5 Family Dwellings (A B C & D)
G) Loans On Manufactured Home Dwelling (A B C & D)
Number
Average Value
Number
Average Value
Number
Average Value
Number
Average Value
Number
Average Value
LOANS ORIGINATED
1,523
$401,978
1,900
$375,145
158
$289,962
211
$346,096
23
$74,226
APPLICATIONS APPROVED, NOT ACCEPTED
327
$362,538
367
$353,636
25
$285,116
35
$307,209
29
$84,398
APPLICATIONS DENIED
448
$368,805
703
$370,555
82
$259,389
76
$374,129
67
$94,346
APPLICATIONS WITHDRAWN
228
$406,327
421
$360,086
27
$349,417
25
$253,602
9
$85,720
FILES CLOSED FOR INCOMPLETENESS
63
$360,213
145
$358,819
13
$168,562
7
$401,536
1
$33,660
Aggregated Statistics For Year 2004 (Based on 6 full and 6 partial tracts)
B) Conventional Home Purchase Loans
C) Refinancings
D) Home Improvement Loans
F) Non-occupant Loans on < 5 Family Dwellings (A B C & D)
G) Loans On Manufactured Home Dwelling (A B C & D)
Number
Average Value
Number
Average Value
Number
Average Value
Number
Average Value
Number
Average Value
LOANS ORIGINATED
1,541
$353,295
2,882
$301,891
96
$250,792
245
$265,774
21
$83,793
APPLICATIONS APPROVED, NOT ACCEPTED
290
$345,740
687
$303,071
14
$249,069
57
$260,367
27
$90,437
APPLICATIONS DENIED
371
$342,937
797
$330,348
42
$154,909
61
$284,506
30
$88,299
APPLICATIONS WITHDRAWN
217
$352,242
533
$303,103
27
$259,936
27
$248,974
6
$70,015
FILES CLOSED FOR INCOMPLETENESS
65
$336,626
162
$318,015
9
$265,516
10
$294,044
2
$109,575
Aggregated Statistics For Year 2003 (Based on 6 full and 6 partial tracts)
A) FHA, FSA/RHS & VA Home Purchase Loans
B) Conventional Home Purchase Loans
C) Refinancings
D) Home Improvement Loans
F) Non-occupant Loans on < 5 Family Dwellings (A B C & D)
Number
Average Value
Number
Average Value
Number
Average Value
Number
Average Value
Number
Average Value
LOANS ORIGINATED
4
$59,525
1,275
$285,698
6,519
$262,735
44
$100,506
443
$212,136
APPLICATIONS APPROVED, NOT ACCEPTED
0
$0
279
$272,643
1,356
$273,076
22
$67,827
94
$206,624
APPLICATIONS DENIED
0
$0
263
$244,252
1,011
$276,804
32
$35,294
88
$243,926
APPLICATIONS WITHDRAWN
0
$0
102
$298,210
947
$264,189
16
$120,894
74
$250,873
FILES CLOSED FOR INCOMPLETENESS
0
$0
53
$317,190
282
$277,100
0
$0
25
$258,410
Aggregated Statistics For Year 2002 (Based on 2 full and 2 partial tracts)
B) Conventional Home Purchase Loans
C) Refinancings
D) Home Improvement Loans
E) Loans on Dwellings For 5+ Families
F) Non-occupant Loans on < 5 Family Dwellings (A B C & D)
Number
Average Value
Number
Average Value
Number
Average Value
Number
Average Value
Number
Average Value
LOANS ORIGINATED
723
$294,634
3,635
$277,187
23
$79,201
2
$401,455
151
$229,196
APPLICATIONS APPROVED, NOT ACCEPTED
157
$282,780
674
$294,678
9
$22,880
0
$0
25
$246,749
APPLICATIONS DENIED
136
$227,598
369
$295,247
19
$111,170
0
$0
32
$235,002
APPLICATIONS WITHDRAWN
89
$302,012
380
$272,370
17
$51,485
0
$0
18
$276,568
FILES CLOSED FOR INCOMPLETENESS
45
$260,460
151
$299,579
0
$0
0
$0
8
$224,579
Aggregated Statistics For Year 2001 (Based on 2 full and 2 partial tracts)
A) FHA, FSA/RHS & VA Home Purchase Loans
B) Conventional Home Purchase Loans
C) Refinancings
D) Home Improvement Loans
E) Loans on Dwellings For 5+ Families
F) Non-occupant Loans on < 5 Family Dwellings (A B C & D)
Number
Average Value
Number
Average Value
Number
Average Value
Number
Average Value
Number
Average Value
Number
Average Value
LOANS ORIGINATED
2
$150,190
498
$268,901
2,207
$281,722
76
$73,870
0
$0
91
$202,937
APPLICATIONS APPROVED, NOT ACCEPTED
0
$0
146
$226,397
370
$280,435
11
$55,130
0
$0
10
$254,381
APPLICATIONS DENIED
0
$0
100
$235,429
354
$280,085
27
$47,709
0
$0
27
$207,457
APPLICATIONS WITHDRAWN
0
$0
81
$247,925
312
$261,689
11
$90,888
2
$259,765
16
$317,336
FILES CLOSED FOR INCOMPLETENESS
0
$0
29
$336,114
123
$275,600
4
$40,532
0
$0
8
$229,071
Aggregated Statistics For Year 2000 (Based on 2 full and 2 partial tracts)
A) FHA, FSA/RHS & VA Home Purchase Loans
B) Conventional Home Purchase Loans
C) Refinancings
D) Home Improvement Loans
E) Loans on Dwellings For 5+ Families
F) Non-occupant Loans on < 5 Family Dwellings (A B C & D)
Number
Average Value
Number
Average Value
Number
Average Value
Number
Average Value
Number
Average Value
Number
Average Value
LOANS ORIGINATED
2
$169,085
771
$272,498
423
$223,119
66
$58,686
4
$3,331,605
55
$200,539
APPLICATIONS APPROVED, NOT ACCEPTED
0
$0
153
$240,396
101
$207,662
29
$55,713
0
$0
2
$9,960
APPLICATIONS DENIED
0
$0
173
$241,103
165
$222,695
35
$53,193
0
$0
14
$187,804
APPLICATIONS WITHDRAWN
2
$236,150
119
$261,138
138
$191,800
17
$50,542
0
$0
8
$251,831
FILES CLOSED FOR INCOMPLETENESS
0
$0
42
$297,841
67
$196,097
6
$43,625
0
$0
2
$224,145
Aggregated Statistics For Year 1999 (Based on 1 full and 4 partial tracts)
A) FHA, FSA/RHS & VA Home Purchase Loans
B) Conventional Home Purchase Loans
C) Refinancings
D) Home Improvement Loans
E) Loans on Dwellings For 5+ Families
F) Non-occupant Loans on < 5 Family Dwellings (A B C & D)


 Nearest zip codes: 95133, 95110, 95112, 95113, 95053, 95116.