Lochridge (Luby) neighborhood in San Jose, California (CA), 95133 detailed profile
Settings
X

Business Search - 14 Million verified businesses
Area: 0.094 square miles
Population: 1,390
Population density:
| Lochridge (Luby): | 14,833 people per square mile |
| San Jose: | 5,554 people per square mile |

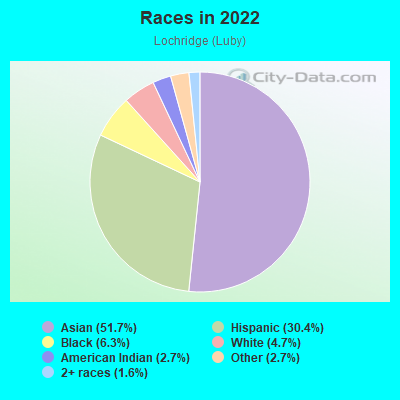
- 75251.7%Asian
- 44230.4%Hispanic or Latino
- 916.3%Black
- 684.7%White
- 392.7%American Indian
- 392.7%Some other race
- 231.6%Two or more races
Median household income in 2022:
| Lochridge (Luby): | $75,807 |
| San Jose: | $133,835 |
Distribution of median household income
![Distribution of median household income]()
- 36Less than $10,000
- 50$10,000 to $19,999
- 44$20,000 to $29,999
- 41$30,000 to $39,999
- 46$40,000 to $49,999
- 19$50,000 to $59,999
- 53$60,000 to $74,999
- 32$75,000 to $99,999
- 5$100,000 to $124,999
- 18$125,000 to $149,999
- 33$150,000 to $199,999
- 128$200,000 or more

Distribution of owner-occupied house/condo value
![Distribution of owner-occupied house/condo value]()
- 8$500,000 to $749,999
- 47$750,000 to $999,999
- 93$1,000,000 or more

Distribution of rent paid by renters
![Distribution of rent paid by renters]()
- 15Less than $100
- 36$100 to $199
- 54$200 to $299
- 33$300 to $399
- 19$400 to $499
- 34$500 to $599
- 17$600 to $699
- 64$700 to $799
- 4$800 to $899
- 8$900 to $999
- 8$1,000 to $1,249
- 36$1,250 to $1,499
- 43$1,500 to $1,999
- 176$2,000 or more

Median rent in 2022:
| Lochridge (Luby): | $1,425 |
| San Jose: | $2,001 |
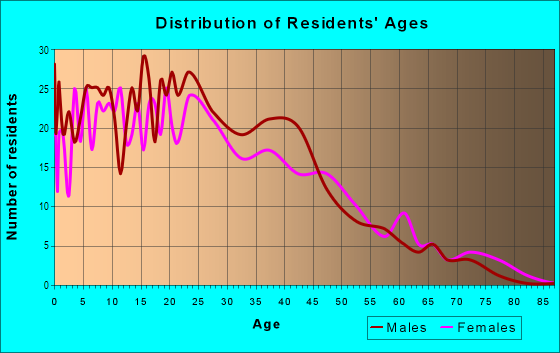
| Males: | 615 |
| Females: | 774 |
Males:
| This neighborhood: | 36.8 years |
| Whole city: | 37.6 years |
| This neighborhood: | 41.5 years |
| Whole city: | 39.1 years |
Average household size:
| Lochridge (Luby): | 3.2 people |
| San Jose: | 2.9 people |
Percentage of family households:
| Lochridge (Luby): | 45.8% |
| San Jose: | 49.9% |
| Here: | 38.7% |
| San Jose: | 53.0% |
Percentage of married-couple families with children (among all households):
| Lochridge (Luby): | 16.4% |
| San Jose: | 25.8% |
Percentage of single-mother households (among all households):
| Lochridge (Luby): | 11.6% |
| San Jose: | 5.2% |
Percentage of never married males 15 years old and over:
Percentage of never married females 15 years old and over:
| Lochridge (Luby): | 22.4% |
| San Jose: | 20.9% |
Percentage of never married females 15 years old and over:
| Lochridge (Luby): | 23.8% |
| city: | 16.7% |
Percentage of people that speak English not well or not at all:
| Lochridge (Luby): | 20.3% |
| San Jose: | 11.4% |
Percentage of people born in this state:
Percentage of people born in another U.S. state:
Percentage of native residents but born outside the U.S.:
Percentage of foreign born residents:
| Here: | 36.0% |
| San Jose: | 46.1% |
Percentage of people born in another U.S. state:
| Lochridge (Luby): | 4.4% |
| San Jose: | 10.4% |
Percentage of native residents but born outside the U.S.:
| Here: | 0.5% |
| city: | 1.7% |
Percentage of foreign born residents:
| Here: | 59.1% |
| San Jose: | 41.8% |
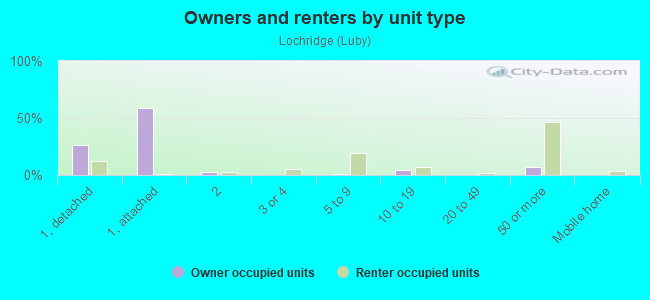
Owner-occupied
Renter-occupied

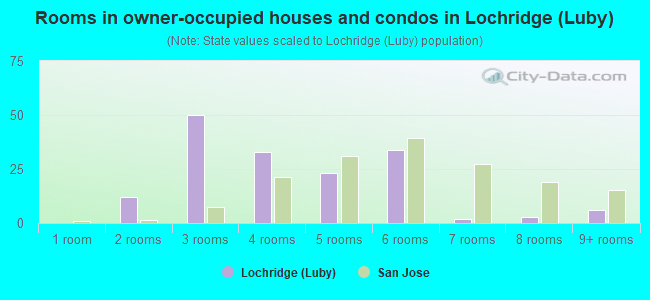
- Rooms in owner-occupied houses and condos in Lochridge <
> - 01 room
- 122 rooms
- 503 rooms
- 334 rooms
- 235 rooms
- 346 rooms
- 27 rooms
- 38 rooms
- 69+ rooms
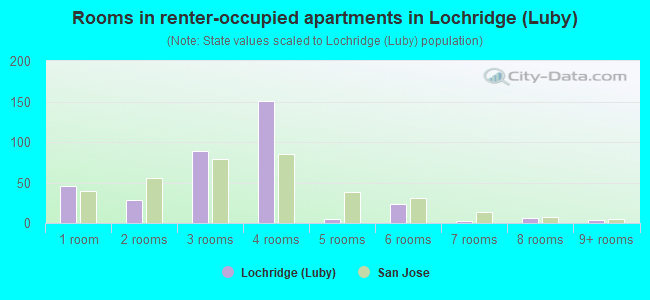
- Rooms in renter-occupied apartments in Lochridge <
> - 461 room
- 292 rooms
- 893 rooms
- 1504 rooms
- 55 rooms
- 236 rooms
- 27 rooms
- 68 rooms
- 49+ rooms
Owner-occupied
Renter-occupied
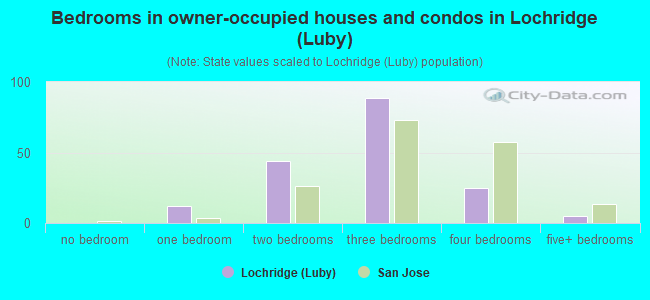
- Bedrooms in owner-occupied houses and condos in Lochridge <
> - 0no bedroom
- 121 bedroom
- 442 bedrooms
- 893 bedrooms
- 254 bedrooms
- 55+ bedrooms
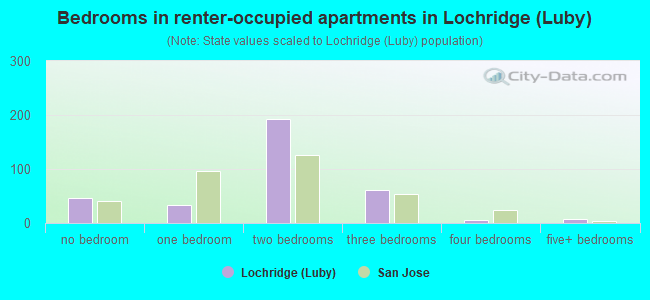
- Bedrooms in renter-occupied apartments in Lochridge <
> - 46no bedroom
- 331 bedroom
- 1922 bedrooms
- 613 bedrooms
- 64 bedrooms
- 75+ bedrooms
Average number of cars or other vehicles available in houses/condos:
Average number of cars or other vehicles available in apartments:
| This neighborhood: | 2.3 |
| San Jose: | 2.3 |
Average number of cars or other vehicles available in apartments:
| Here: | 1.3 |
| city: | 1.6 |
Percentage of units with a mortgage:
| Lochridge (Luby): | 94.5% |
| San Jose: | 66.9% |
Average estimated value of detached houses in 2022 (18.5% of all units):
| Lochridge (Luby): | $876,135 |
| San Jose: | $1,532,815 |
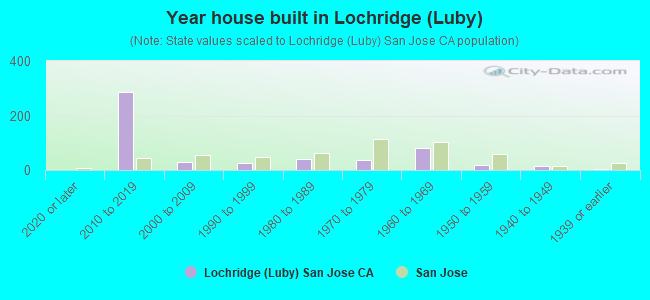
- Year house built in Lochridge <
> - 02020 or later
- 2852010 to 2019
- 292000 to 2009
- 271990 to 1999
- 391980 to 1989
- 351970 to 1979
- 821960 to 1969
- 201950 to 1959
- 131940 to 1949
- 31939 or earlier
City-data.com crime index for city in 2020 (higher means more crime):
| City: | 268.4 |
| U.S. average: | 219.5 |
Travel time to work (commute)
![Travel time to work (commute)]()
- 1Less than 5 minutes
- 45 to 9 minutes
- 4310 to 14 minutes
- 5915 to 19 minutes
- 7320 to 24 minutes
- 2825 to 29 minutes
- 5430 to 34 minutes
- 1235 to 39 minutes
- 4640 to 44 minutes
- 4145 to 59 minutes
- 2360 to 89 minutes
- 1890 or more minutes

Means of transportation to work
![Means of transportation to work]()
- 68.6%428Drove a car alone
- 8.7%54Carpooled
- 3.4%21Bus
- 2.1%13Subway or elevated rail
- 1.0%6Long-distance train or commuter rail
- 0.5%3Taxi
- 0.6%4Walked
- 0.5%3Other means
- 16.4%102Worked at home

Time leaving home to go to work
![Time leaving home to go to work]()
- 1212:00 a.m. to 4:59 a.m.
- 275:00 a.m. to 5:29 a.m.
- 75:30 a.m. to 5:59 a.m.
- 46:00 a.m. to 6:29 a.m.
- 146:30 a.m. to 6:59 a.m.
- 487:00 a.m. to 7:29 a.m.
- 307:30 a.m. to 7:59 a.m.
- 508:00 a.m. to 8:29 a.m.
- 448:30 a.m. to 8:59 a.m.
- 909:00 a.m. to 9:59 a.m.
- 2610:00 a.m. to 10:59 a.m.
- 411:00 a.m. to 11:59 a.m.
- 912:00 p.m. to 3:59 p.m.
- 264:00 p.m. to 11:59 p.m.

Occupations of males:
- Percentage of males in management occupations (except farmers):
Here: 6.8% city: 13.0%
- Percentage of males in computer and mathematical occupations:
Here: 21.0% city: 13.6%
- Percentage of males in architecture and engineering occupations:
Here: 10.6% city: 10.2%
- Percentage of males in life, physical, and social science occupations:
Here: 7.9% city: 1.1%
- Percentage of males in community and social services occupations:
Here: 2.7% city: 0.8%
- Percentage of males in service occupations:
Here: 15.7% city: 12.7%
- Percentage of males in sales and office occupations:
Here: 7.6% city: 12.8%
- Percentage of males in construction, extraction, and maintenance occupations:
Here: 13.8% city: 7.8%
- Percentage of males in production occupations:
Here: 4.9% city: 5.5%
- Percentage of males in transportation occupations:
Here: 3.5% city: 3.6%
Occupations of females:
- Percentage of females in management occupations (except farmers):
Here: 8.8% city: 11.0%
- Percentage of females in business and financial operations occupations:
Here: 11.1% city: 8.6%
- Percentage of females in computer and mathematical occupations:
Here: 6.5% city: 5.4%
- Percentage of females in architecture and engineering occupations:
Here: 5.5% city: 2.8%
- Percentage of females in education, training, and library occupations:
Here: 1.5% city: 8.1%
- Percentage of females in healthcare practitioners and technical occupations:
Here: 7.7% city: 6.8%
- Percentage of females in service occupations:
Here: 34.7% city: 21.7%
- Percentage of females in sales and office occupations:
Here: 20.2% city: 22.0%
- Percentage of females in production occupations:
Here: 2.8% city: 4.0%
- Percentage of females in material moving occupations:
Here: 1.2% city: 1.5%
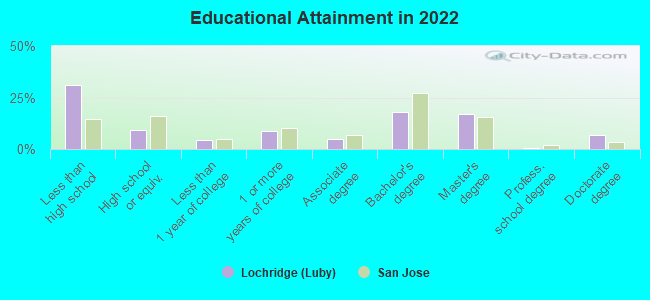
Education in this neighborhood (subdivision or community):
- Percentage of people 3 years and older in K-12 schools:
Lochridge (Luby): 21.0% San Jose: 16.1%
- Percentage of people 3 years and older in undergraduate colleges:
Lochridge (Luby): 6.5% San Jose: 6.5%
- Percentage of people 3 years and older in grad. or professional schools:
Lochridge (Luby): 2.7% San Jose: 2.0%
- Percentage of students K-12 enrolled in private schools:
Lochridge (Luby): 9.5% San Jose: 14.9%
Percentage of population below poverty level:
| Lochridge (Luby): | 26.8% |
| San Jose: | 9.0% |
Median year owner moved in (as recorded in 2022):
Median year renter moved in (as recorded in 2022):
| Lochridge (Luby): | 2009 |
| San Jose: | 2008 |
Median year renter moved in (as recorded in 2022):
| Lochridge (Luby): | 2012 |
| San Jose: | 2020 |
Percentage of married-couple families with both working:
| Lochridge (Luby): | 26.1% |
| San Jose: | 72.5% |
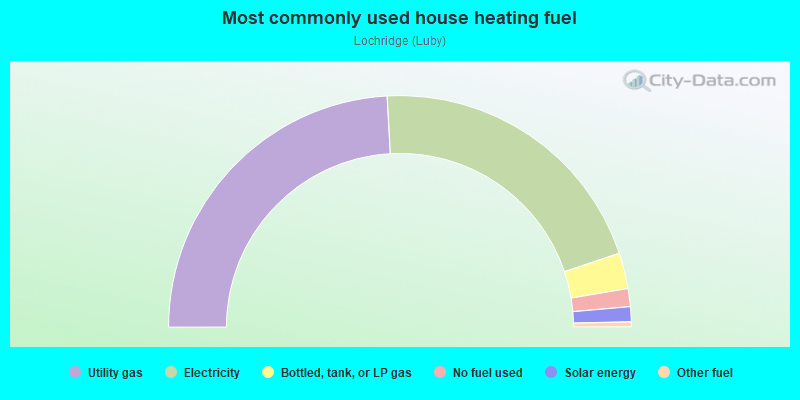
- 48.2%Utility gas
- 41.4%Electricity
- 5.0%Bottled, tank, or LP gas
- 2.5%No fuel used
- 2.1%Solar energy
- 0.7%Other fuel
Roads and streets:
Luby Dr
Length: 0.34 miles
Directions: E-W, N-S, SE-NW, SW-NE
Address range: 1800 to 1999
Directions: E-W, N-S, SE-NW, SW-NE
Address range: 1800 to 1999
Las Plumas Ave
Length: 0.28 miles
Directions: E-W, SW-NE
Address range: 1886 to 2199
Directions: E-W, SW-NE
Address range: 1886 to 2199
Lochridge Dr
Length: 0.26 miles
Directions: E-W, SE-NW
Address range: 300 to 478
Directions: E-W, SE-NW
Address range: 300 to 478
Avalani Ave
Length: 0.23 miles
Directions: N-S, SE-NW, SW-NE
Address range: 401 to 598
Directions: N-S, SE-NW, SW-NE
Address range: 401 to 598
Educational Park Dr
Length: 0.14 miles
Directions: N-S, SE-NW
Address range: 400 to 503
Directions: N-S, SE-NW
Address range: 400 to 503
Ripley Dr
Length: 0.13 miles
Directions: SE-NW, SW-NE
Address range: 500 to 599
Directions: SE-NW, SW-NE
Address range: 500 to 599
Marigold Ct
Length: 0.08 miles
Direction: SW-NE
Address range: 1700 to 1799
Direction: SW-NE
Address range: 1700 to 1799
Galewood Ct
Length: 0.08 miles
Direction: SW-NE
Address range: 1700 to 1799
Direction: SW-NE
Address range: 1700 to 1799
Schulte Dr
Length: 0.07 miles
Directions: N-S, SW-NE
Address range: 1750 to 1794
Directions: N-S, SW-NE
Address range: 1750 to 1794
Scottsville Ct
Length: 0.07 miles
Direction: SE-NW
Address range: 510 to 599
Direction: SE-NW
Address range: 510 to 599
Trents Ferry Ct
Length: 0.07 miles
Direction: SE-NW
Address range: 501 to 599
Direction: SE-NW
Address range: 501 to 599
Castlebrook Ct
Length: 0.06 miles
Directions: E-W, SE-NW, SW-NE
Address range: 1700 to 1799
Directions: E-W, SE-NW, SW-NE
Address range: 1700 to 1799
Other features:
Silver Crk
Length: 0.40 miles
Directions: N-S, SW-NE
Directions: N-S, SW-NE