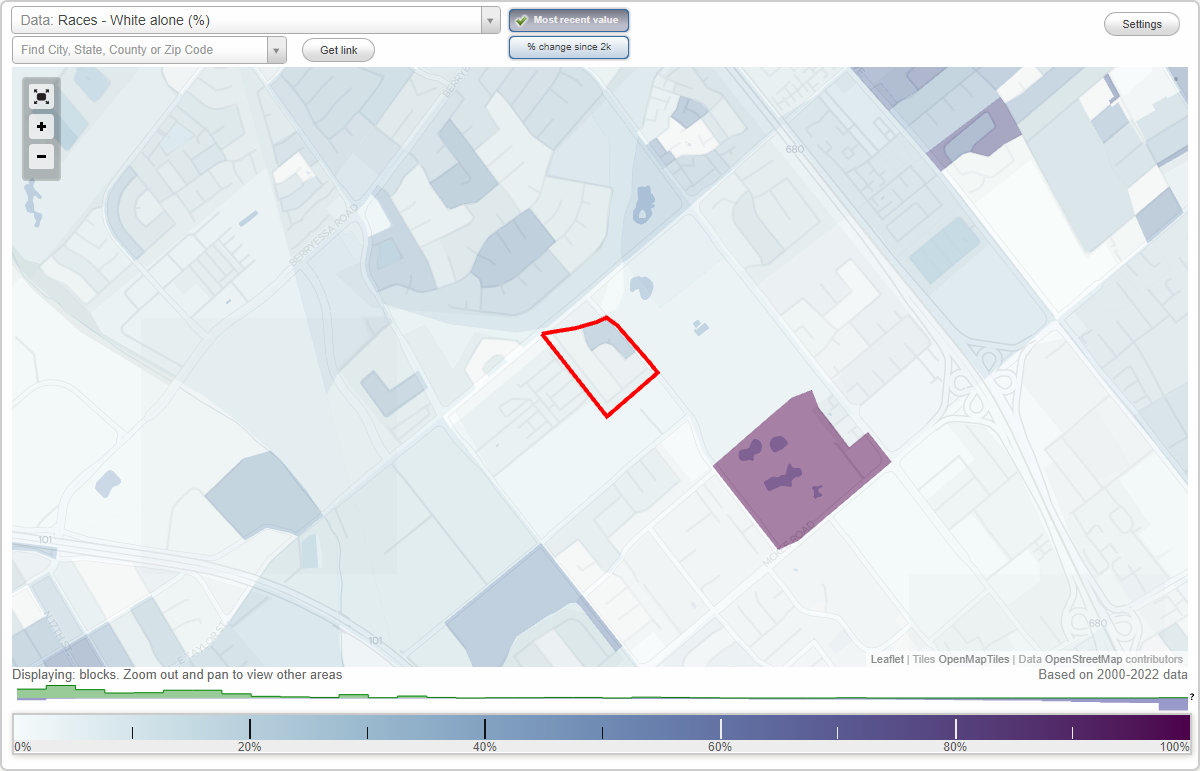
Pine Hollow neighborhood in San Jose, California (CA), 95133 detailed profile
Settings
X

Business Search - 14 Million verified businesses
Area: 0.032 square miles
Population: 532
Population density:
| Pine Hollow: | 16,756 people per square mile |
| San Jose: | 5,554 people per square mile |

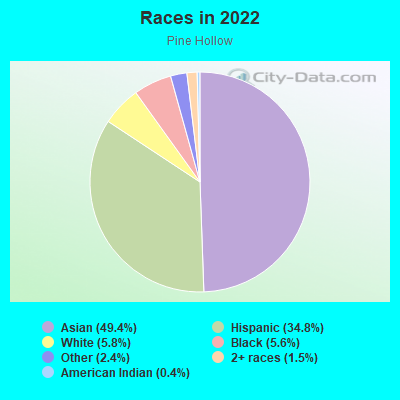
- 26349.4%Asian
- 18534.8%Hispanic or Latino
- 315.8%White
- 305.6%Black
- 132.4%Some other race
- 81.5%Two or more races
- 20.4%American Indian
Median household income in 2022:
| Pine Hollow: | $95,417 |
| San Jose: | $133,835 |
Distribution of median household income
![Distribution of median household income]()
- 11Less than $10,000
- 15$10,000 to $19,999
- 14$20,000 to $29,999
- 13$30,000 to $39,999
- 6$40,000 to $49,999
- 7$50,000 to $59,999
- 24$60,000 to $74,999
- 11$75,000 to $99,999
- 2$100,000 to $124,999
- 5$125,000 to $149,999
- 15$150,000 to $199,999
- 61$200,000 or more

Distribution of owner-occupied house/condo value
![Distribution of owner-occupied house/condo value]()
- 3$500,000 to $749,999
- 17$750,000 to $999,999
- 42$1,000,000 or more

Distribution of rent paid by renters
![Distribution of rent paid by renters]()
- 4Less than $100
- 2$100 to $199
- 4$200 to $299
- 13$300 to $399
- 7$400 to $499
- 5$500 to $599
- 6$600 to $699
- 8$700 to $799
- 2$800 to $899
- 3$900 to $999
- 3$1,000 to $1,249
- 15$1,250 to $1,499
- 15$1,500 to $1,999
- 64$2,000 or more

Median rent in 2022:
| Pine Hollow: | $2,085 |
| San Jose: | $2,001 |
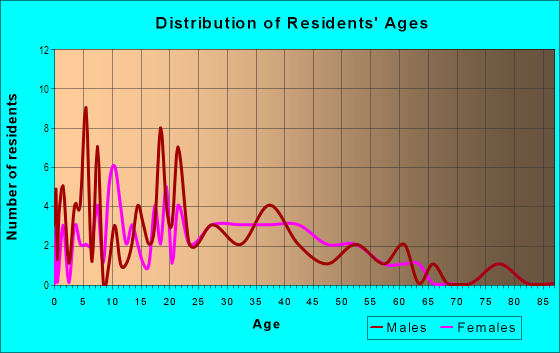
| Males: | 240 |
| Females: | 291 |
Males:
| This neighborhood: | 32.9 years |
| Whole city: | 37.6 years |
| This neighborhood: | 38.3 years |
| Whole city: | 39.1 years |
Average household size:
| Pine Hollow: | 3.3 people |
| San Jose: | 2.9 people |
Percentage of family households:
| Pine Hollow: | 43.8% |
| San Jose: | 49.9% |
| Here: | 34.1% |
| San Jose: | 53.0% |
Percentage of married-couple families with children (among all households):
| Pine Hollow: | 15.5% |
| San Jose: | 25.8% |
Percentage of single-mother households (among all households):
| Pine Hollow: | 11.8% |
| San Jose: | 5.2% |
Percentage of never married males 15 years old and over:
Percentage of never married females 15 years old and over:
| Pine Hollow: | 24.2% |
| San Jose: | 20.9% |
Percentage of never married females 15 years old and over:
| Pine Hollow: | 26.2% |
| city: | 16.7% |
Percentage of people that speak English not well or not at all:
| Pine Hollow: | 14.6% |
| San Jose: | 11.4% |
Percentage of people born in this state:
Percentage of people born in another U.S. state:
Percentage of native residents but born outside the U.S.:
Percentage of foreign born residents:
| Here: | 36.1% |
| San Jose: | 46.1% |
Percentage of people born in another U.S. state:
| Pine Hollow: | 4.4% |
| San Jose: | 10.4% |
Percentage of native residents but born outside the U.S.:
| Here: | 0.5% |
| city: | 1.7% |
Percentage of foreign born residents:
| Here: | 59.0% |
| San Jose: | 41.8% |
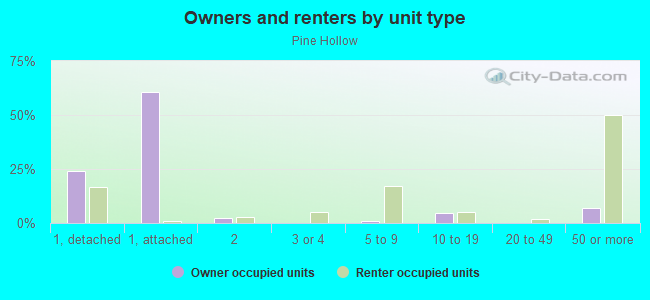
Owner-occupied
Renter-occupied

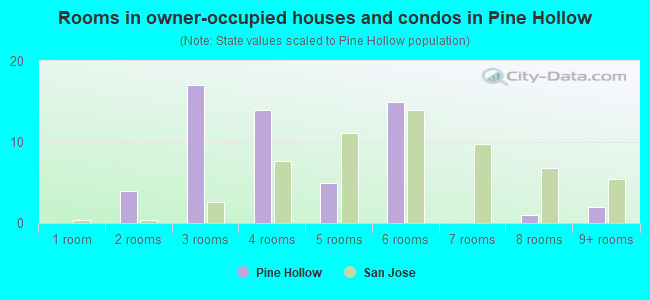
- Rooms in owner-occupied houses and condos in Pine Hollow
- 01 room
- 42 rooms
- 173 rooms
- 144 rooms
- 55 rooms
- 156 rooms
- 07 rooms
- 18 rooms
- 29+ rooms
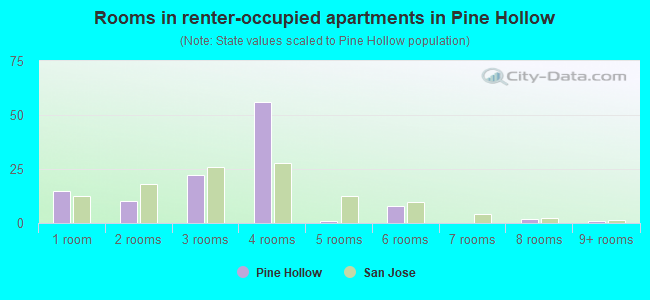
- Rooms in renter-occupied apartments in Pine Hollow
- 151 room
- 102 rooms
- 223 rooms
- 564 rooms
- 15 rooms
- 86 rooms
- 07 rooms
- 28 rooms
- 19+ rooms
Owner-occupied
Renter-occupied
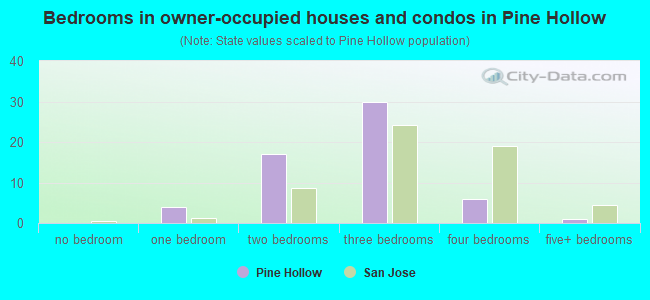
- Bedrooms in owner-occupied houses and condos in Pine Hollow
- 0no bedroom
- 41 bedroom
- 172 bedrooms
- 303 bedrooms
- 64 bedrooms
- 15+ bedrooms
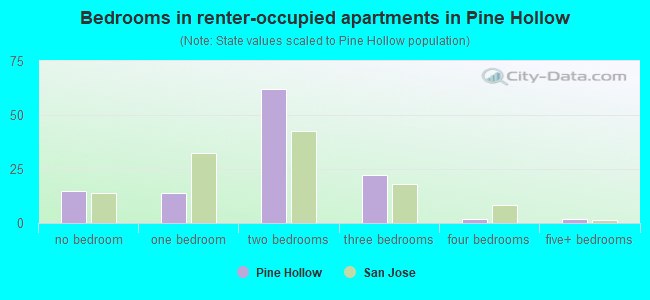
- Bedrooms in renter-occupied apartments in Pine Hollow
- 15no bedroom
- 141 bedroom
- 622 bedrooms
- 223 bedrooms
- 24 bedrooms
- 25+ bedrooms
Average number of cars or other vehicles available in houses/condos:
Average number of cars or other vehicles available in apartments:
| This neighborhood: | 2.1 |
| San Jose: | 2.3 |
Average number of cars or other vehicles available in apartments:
| Here: | 1.4 |
| city: | 1.6 |
Percentage of units with a mortgage:
| Pine Hollow: | 95.3% |
| San Jose: | 66.9% |
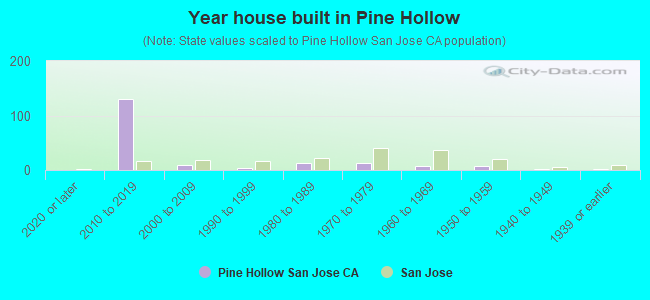
- Year house built in Pine Hollow
- 02020 or later
- 1312010 to 2019
- 102000 to 2009
- 31990 to 1999
- 131980 to 1989
- 121970 to 1979
- 81960 to 1969
- 81950 to 1959
- 11940 to 1949
- 11939 or earlier
City-data.com crime index for city in 2020 (higher means more crime):
| City: | 268.4 |
| U.S. average: | 219.5 |
Travel time to work (commute)
![Travel time to work (commute)]()
- 15 to 9 minutes
- 1110 to 14 minutes
- 1515 to 19 minutes
- 1920 to 24 minutes
- 725 to 29 minutes
- 1430 to 34 minutes
- 335 to 39 minutes
- 1240 to 44 minutes
- 1945 to 59 minutes
- 660 to 89 minutes
- 490 or more minutes

Means of transportation to work
![Means of transportation to work]()
- 68.9%182Drove a car alone
- 9.1%24Carpooled
- 3.4%9Bus
- 1.5%4Subway or elevated rail
- 0.8%2Long-distance train or commuter rail
- 0.4%1Taxi
- 0.4%1Walked
- 0.4%1Other means
- 14.8%39Worked at home

Time leaving home to go to work
![Time leaving home to go to work]()
- 312:00 a.m. to 4:59 a.m.
- 75:00 a.m. to 5:29 a.m.
- 25:30 a.m. to 5:59 a.m.
- 16:00 a.m. to 6:29 a.m.
- 36:30 a.m. to 6:59 a.m.
- 127:00 a.m. to 7:29 a.m.
- 87:30 a.m. to 7:59 a.m.
- 138:00 a.m. to 8:29 a.m.
- 118:30 a.m. to 8:59 a.m.
- 239:00 a.m. to 9:59 a.m.
- 710:00 a.m. to 10:59 a.m.
- 111:00 a.m. to 11:59 a.m.
- 212:00 p.m. to 3:59 p.m.
- 74:00 p.m. to 11:59 p.m.

Occupations of males:
- Percentage of males in management occupations (except farmers):
Here: 3.6% city: 13.0%
- Percentage of males in computer and mathematical occupations:
Here: 23.6% city: 13.6%
- Percentage of males in architecture and engineering occupations:
Here: 11.9% city: 10.2%
- Percentage of males in life, physical, and social science occupations:
Here: 8.9% city: 1.1%
- Percentage of males in community and social services occupations:
Here: 3.1% city: 0.8%
- Percentage of males in service occupations:
Here: 13.2% city: 12.7%
- Percentage of males in sales and office occupations:
Here: 7.0% city: 12.8%
- Percentage of males in construction, extraction, and maintenance occupations:
Here: 15.5% city: 7.8%
- Percentage of males in production occupations:
Here: 3.9% city: 5.5%
- Percentage of males in transportation occupations:
Here: 3.1% city: 3.6%
Occupations of females:
- Percentage of females in management occupations (except farmers):
Here: 9.5% city: 11.0%
- Percentage of females in business and financial operations occupations:
Here: 12.9% city: 8.6%
- Percentage of females in computer and mathematical occupations:
Here: 7.6% city: 5.4%
- Percentage of females in architecture and engineering occupations:
Here: 6.4% city: 2.8%
- Percentage of females in education, training, and library occupations:
Here: 1.7% city: 8.1%
- Percentage of females in healthcare practitioners and technical occupations:
Here: 6.0% city: 6.8%
- Percentage of females in service occupations:
Here: 30.1% city: 21.7%
- Percentage of females in sales and office occupations:
Here: 22.5% city: 22.0%
- Percentage of females in production occupations:
Here: 3.3% city: 4.0%
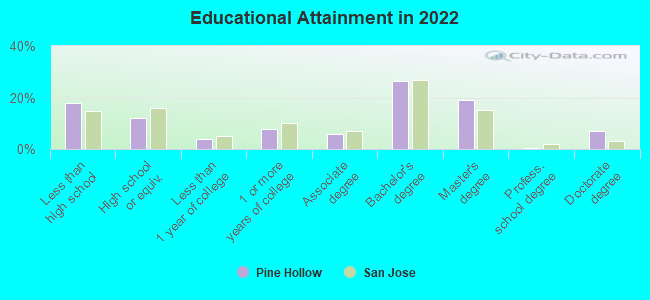
Education in this neighborhood (subdivision or community):
- Percentage of people 3 years and older in K-12 schools:
Pine Hollow: 18.8% San Jose: 16.1%
- Percentage of people 3 years and older in undergraduate colleges:
Pine Hollow: 5.6% San Jose: 6.5%
- Percentage of people 3 years and older in grad. or professional schools:
Pine Hollow: 2.1% San Jose: 2.0%
- Percentage of students K-12 enrolled in private schools:
Pine Hollow: 8.2% San Jose: 14.9%
Percentage of population below poverty level:
| Pine Hollow: | 26.8% |
| San Jose: | 9.0% |
Median year owner moved in (as recorded in 2022):
Median year renter moved in (as recorded in 2022):
| Pine Hollow: | 2012 |
| San Jose: | 2008 |
Median year renter moved in (as recorded in 2022):
| Pine Hollow: | 2014 |
| San Jose: | 2020 |
Percentage of married-couple families with both working:
| Pine Hollow: | 22.9% |
| San Jose: | 72.5% |
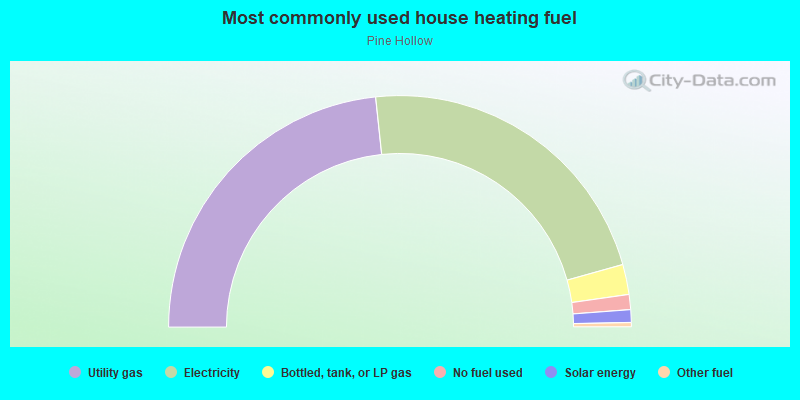
- 46.7%Utility gas
- 44.7%Electricity
- 4.2%Bottled, tank, or LP gas
- 2.1%No fuel used
- 1.8%Solar energy
- 0.6%Other fuel
Roads and streets:
Norseman Dr
Length: 0.18 miles
Directions: E-W, N-S, SE-NW, SW-NE
Address range: 1831 to 1899
Directions: E-W, N-S, SE-NW, SW-NE
Address range: 1831 to 1899
Undajon Dr
Length: 0.13 miles
Direction: SE-NW
Address range: 601 to 678
Direction: SE-NW
Address range: 601 to 678
Pine Hollow Cir
Length: 0.10 miles
Directions: E-W, SW-NE
Address range: 1700 to 1763
Directions: E-W, SW-NE
Address range: 1700 to 1763
Educational Park Dr
Length: 0.06 miles
Direction: SE-NW
Address range: 652 to 699
Direction: SE-NW
Address range: 652 to 699