Ann Darling neighborhood in San Jose, California (CA), 95133 detailed profile
Settings
X

Business Search - 14 Million verified businesses
Area: 0.095 square miles
Population: 458
Population density:
| Ann Darling: | 4,805 people per square mile |
| San Jose: | 5,554 people per square mile |

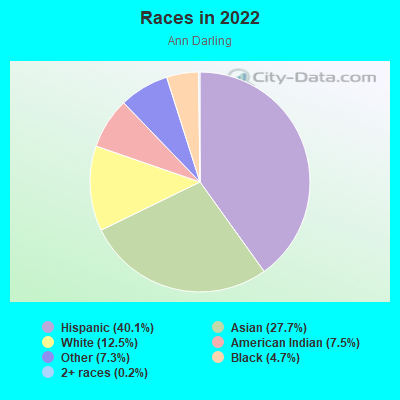
- 21440.1%Hispanic or Latino
- 14827.7%Asian
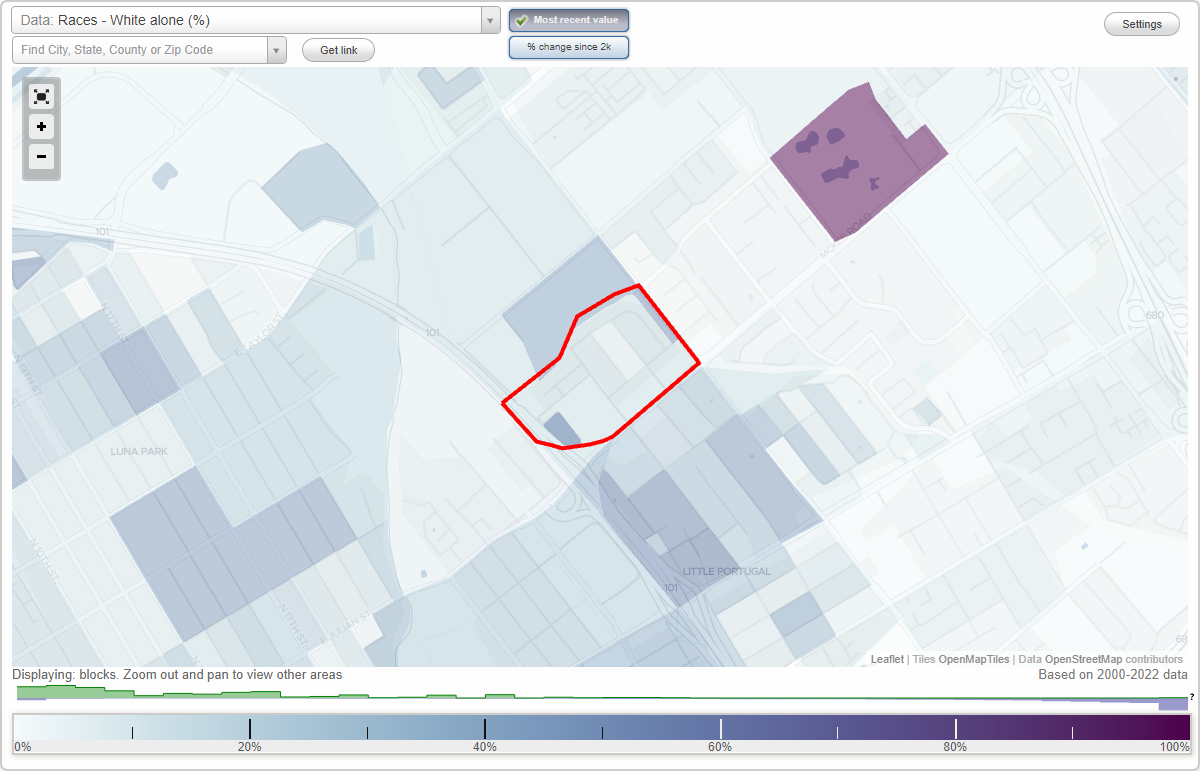
- 6712.5%White
- 407.5%American Indian
- 397.3%Some other race
- 254.7%Black
- 10.2%Two or more races
Median household income in 2022:
| Ann Darling: | $71,955 |
| San Jose: | $133,835 |
Distribution of median household income
![Distribution of median household income]()
- 48Less than $10,000
- 10$10,000 to $19,999
- 24$20,000 to $29,999
- 25$30,000 to $39,999
- 18$40,000 to $49,999
- 11$50,000 to $59,999
- 6$60,000 to $74,999
- 9$75,000 to $99,999
- 4$100,000 to $124,999
- 4$125,000 to $149,999
- 4$150,000 to $199,999
- 40$200,000 or more

Distribution of owner-occupied house/condo value
![Distribution of owner-occupied house/condo value]()
- 6Less than $50,000
- 1$50,000 to $99,999
- 2$400,000 to $499,999
- 9$500,000 to $749,999
- 28$750,000 to $999,999
- 19$1,000,000 or more

Distribution of rent paid by renters
![Distribution of rent paid by renters]()
- 12Less than $100
- 36$100 to $199
- 56$200 to $299
- 22$300 to $399
- 20$400 to $499
- 35$500 to $599
- 15$600 to $699
- 65$700 to $799
- 4$800 to $899
- 3$900 to $999
- 4$1,000 to $1,249
- 22$1,250 to $1,499
- 6$1,500 to $1,999
- 151$2,000 or more

Median rent in 2022:
| Ann Darling: | $1,375 |
| San Jose: | $2,001 |
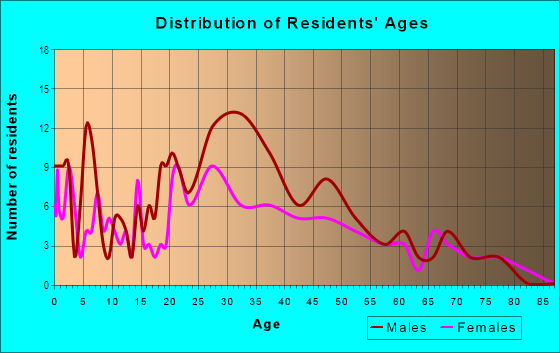
| Males: | 245 |
| Females: | 212 |
Males:
| This neighborhood: | 37.3 years |
| Whole city: | 37.6 years |
| This neighborhood: | 39.1 years |
| Whole city: | 39.1 years |
Average household size:
| Ann Darling: | 3.3 people |
| San Jose: | 2.9 people |
Percentage of family households:
| Ann Darling: | 55.0% |
| San Jose: | 49.9% |
| Here: | 61.5% |
| San Jose: | 53.0% |
Percentage of married-couple families with children (among all households):
| Ann Darling: | 17.5% |
| San Jose: | 25.8% |
Percentage of single-mother households (among all households):
| Ann Darling: | 2.0% |
| San Jose: | 5.2% |
Percentage of never married males 15 years old and over:
Percentage of never married females 15 years old and over:
| Ann Darling: | 23.9% |
| San Jose: | 20.9% |
Percentage of never married females 15 years old and over:
| Ann Darling: | 15.3% |
| city: | 16.7% |
Percentage of people that speak English not well or not at all:
| Ann Darling: | 16.0% |
| San Jose: | 11.4% |
Percentage of people born in this state:
Percentage of people born in another U.S. state:
Percentage of native residents but born outside the U.S.:
Percentage of foreign born residents:
| Here: | 49.7% |
| San Jose: | 46.1% |
Percentage of people born in another U.S. state:
| Ann Darling: | 3.6% |
| San Jose: | 10.4% |
Percentage of native residents but born outside the U.S.:
| Here: | 5.8% |
| city: | 1.7% |
Percentage of foreign born residents:
| Here: | 41.0% |
| San Jose: | 41.8% |
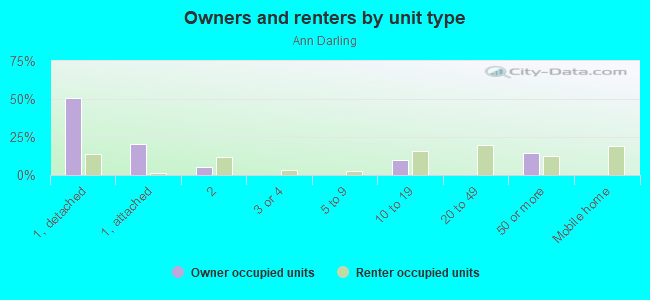
Owner-occupied
Renter-occupied

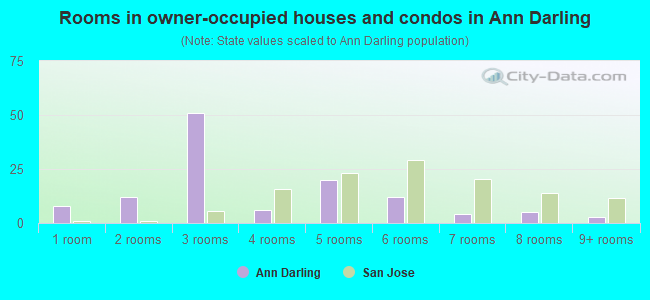
- Rooms in owner-occupied houses and condos in Ann Darling
- 81 room
- 122 rooms
- 513 rooms
- 64 rooms
- 205 rooms
- 126 rooms
- 47 rooms
- 58 rooms
- 39+ rooms
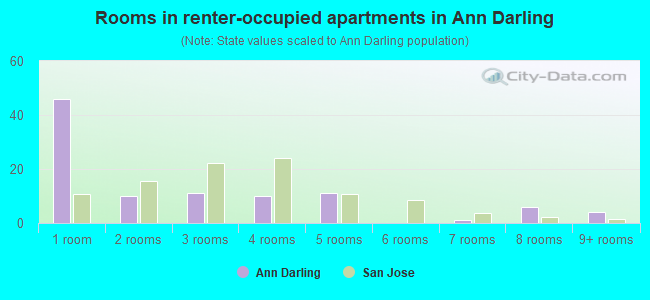
- Rooms in renter-occupied apartments in Ann Darling
- 461 room
- 102 rooms
- 113 rooms
- 104 rooms
- 115 rooms
- 06 rooms
- 17 rooms
- 68 rooms
- 49+ rooms
Owner-occupied
Renter-occupied
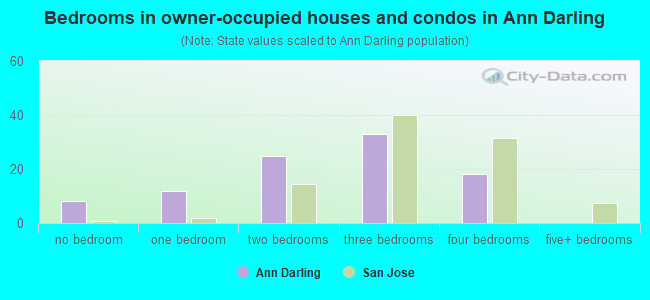
- Bedrooms in owner-occupied houses and condos in Ann Darling
- 8no bedroom
- 121 bedroom
- 252 bedrooms
- 333 bedrooms
- 184 bedrooms
- 05+ bedrooms
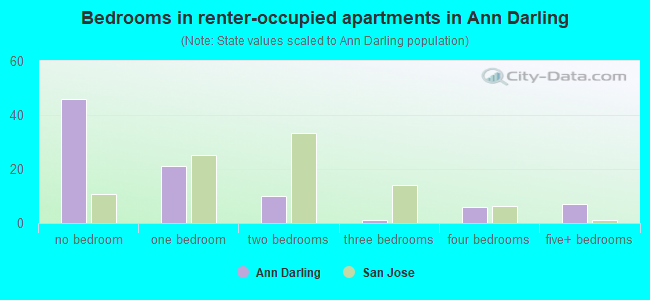
- Bedrooms in renter-occupied apartments in Ann Darling
- 46no bedroom
- 211 bedroom
- 102 bedrooms
- 13 bedrooms
- 64 bedrooms
- 75+ bedrooms
Average number of cars or other vehicles available in houses/condos:
Average number of cars or other vehicles available in apartments:
| This neighborhood: | 3.1 |
| San Jose: | 2.3 |
Average number of cars or other vehicles available in apartments:
| Here: | 1.6 |
| city: | 1.6 |
Percentage of units with a mortgage:
| Ann Darling: | 71.5% |
| San Jose: | 66.9% |
Housing prices:
- Average estimated value of detached houses in 2022 (44.3% of all units):
Ann Darling: $1,111,920 San Jose: $1,532,815
- Average estimated value of townhouses or other attached units in 2022 (18.6% of all units):
This neighborhood: $498,088 city: $1,024,857
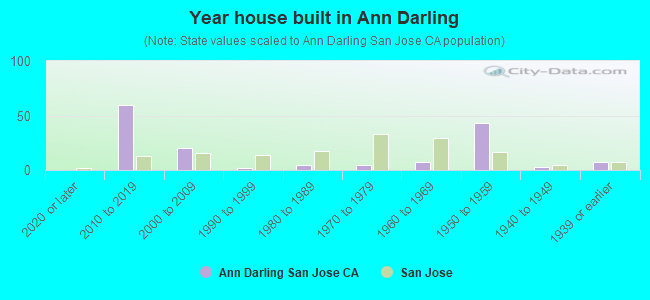
- Year house built in Ann Darling
- 02020 or later
- 602010 to 2019
- 202000 to 2009
- 21990 to 1999
- 51980 to 1989
- 51970 to 1979
- 71960 to 1969
- 431950 to 1959
- 31940 to 1949
- 71939 or earlier
City-data.com crime index for city in 2020 (higher means more crime):
| City: | 268.4 |
| U.S. average: | 219.5 |
Travel time to work (commute)
![Travel time to work (commute)]()
- 45 to 9 minutes
- 2010 to 14 minutes
- 2415 to 19 minutes
- 2520 to 24 minutes
- 1525 to 29 minutes
- 1630 to 34 minutes
- 435 to 39 minutes
- 540 to 44 minutes
- 1745 to 59 minutes
- 1560 to 89 minutes
- 490 or more minutes

Means of transportation to work
![Means of transportation to work]()
- 61.1%138Drove a car alone
- 14.6%33Carpooled
- 6.2%14Bus
- 5.8%13Subway or elevated rail
- 2.7%6Long-distance train or commuter rail
- 1.3%3Taxi
- 1.8%4Motorcycle
- 0.9%2Walked
- 0.4%1Other means
- 13.7%31Worked at home

Time leaving home to go to work
![Time leaving home to go to work]()
- 1712:00 a.m. to 4:59 a.m.
- 75:00 a.m. to 5:29 a.m.
- 45:30 a.m. to 5:59 a.m.
- 186:00 a.m. to 6:29 a.m.
- 116:30 a.m. to 6:59 a.m.
- 257:00 a.m. to 7:29 a.m.
- 117:30 a.m. to 7:59 a.m.
- 138:00 a.m. to 8:29 a.m.
- 28:30 a.m. to 8:59 a.m.
- 119:00 a.m. to 9:59 a.m.
- 910:00 a.m. to 10:59 a.m.
- 511:00 a.m. to 11:59 a.m.
- 512:00 p.m. to 3:59 p.m.
- 124:00 p.m. to 11:59 p.m.

Occupations of males:
- Percentage of males in management occupations (except farmers):
Here: 5.3% city: 13.0%
- Percentage of males in business and financial operations occupations:
Here: 3.1% city: 4.6%
- Percentage of males in computer and mathematical occupations:
Here: 6.2% city: 13.6%
- Percentage of males in architecture and engineering occupations:
Here: 6.5% city: 10.2%
- Percentage of males in community and social services occupations:
Here: 1.7% city: 0.8%
- Percentage of males in arts, design, entertainment, sports, and media occupations:
Here: 2.9% city: 1.8%
- Percentage of males in healthcare practitioners and technical occupations:
Here: 2.5% city: 2.0%
- Percentage of males in service occupations:
Here: 15.3% city: 12.7%
- Percentage of males in sales and office occupations:
Here: 2.7% city: 12.8%
- Percentage of males in farming, fishing, and forestry occupations:
Here: 1.7% city: 0.4%
- Percentage of males in construction, extraction, and maintenance occupations:
Here: 19.4% city: 7.8%
- Percentage of males in production occupations:
Here: 3.7% city: 5.5%
- Percentage of males in transportation occupations:
Here: 26.7% city: 3.6%
- Percentage of males in material moving occupations:
Here: 4.6% city: 3.1%
Occupations of females:
- Percentage of females in management occupations (except farmers):
Here: 8.1% city: 11.0%
- Percentage of females in business and financial operations occupations:
Here: 9.2% city: 8.6%
- Percentage of females in computer and mathematical occupations:
Here: 5.7% city: 5.4%
- Percentage of females in community and social services occupations:
Here: 2.6% city: 1.8%
- Percentage of females in education, training, and library occupations:
Here: 6.8% city: 8.1%
- Percentage of females in healthcare practitioners and technical occupations:
Here: 6.4% city: 6.8%
- Percentage of females in service occupations:
Here: 18.3% city: 21.7%
- Percentage of females in sales and office occupations:
Here: 24.4% city: 22.0%
- Percentage of females in production occupations:
Here: 17.8% city: 4.0%
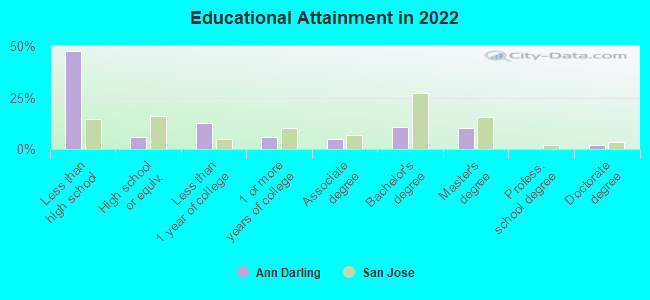
Education in this neighborhood (subdivision or community):
- Percentage of people 3 years and older in K-12 schools:
Ann Darling: 10.0% San Jose: 16.1%
- Percentage of people 3 years and older in undergraduate colleges:
Ann Darling: 9.4% San Jose: 6.5%
- Percentage of people 3 years and older in grad. or professional schools:
Ann Darling: 6.9% San Jose: 2.0%
- Percentage of students K-12 enrolled in private schools:
Ann Darling: 35.6% San Jose: 14.9%
Percentage of population below poverty level:
| Ann Darling: | 13.3% |
| San Jose: | 9.0% |
Median year owner moved in (as recorded in 2022):
Median year renter moved in (as recorded in 2022):
| Ann Darling: | 2011 |
| San Jose: | 2008 |
Median year renter moved in (as recorded in 2022):
| Ann Darling: | 2012 |
| San Jose: | 2020 |
Percentage of married-couple families with both working:
| Ann Darling: | 89.2% |
| San Jose: | 72.5% |
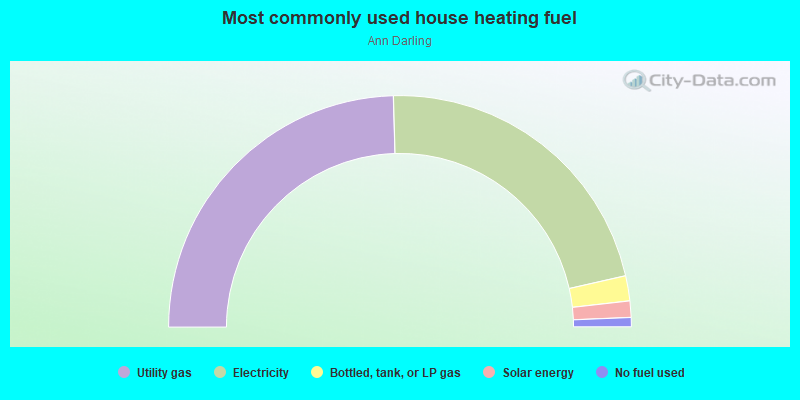
- 49.1%Utility gas
- 43.8%Electricity
- 3.5%Bottled, tank, or LP gas
- 2.3%Solar energy
- 1.3%No fuel used
Roads and streets:
Melody Ln
Length: 0.34 miles
Directions: E-W, N-S, SE-NW, SW-NE
Address range: 1600 to 1699
Directions: E-W, N-S, SE-NW, SW-NE
Address range: 1600 to 1699
Berrywood Dr
Length: 0.25 miles
Direction: SW-NE
Address range: 1600 to 1699
Direction: SW-NE
Address range: 1600 to 1699
Marburg Way
Length: 0.19 miles
Directions: N-S, SE-NW, SW-NE
Address range: 1500 to 1599
Directions: N-S, SE-NW, SW-NE
Address range: 1500 to 1599
Royce Dr
Length: 0.16 miles
Direction: SE-NW
Address range: 300 to 499
Direction: SE-NW
Address range: 300 to 499
N 33rd St
Length: 0.16 miles
Directions: N-S, SE-NW
Address range: 349 to 499
Directions: N-S, SE-NW
Address range: 349 to 499
N King Rd
Length: 0.16 miles
Direction: SE-NW
Address range: 372 to 449
Direction: SE-NW
Address range: 372 to 449
Ann Darling Dr
Length: 0.15 miles
Direction: SE-NW
Address range: 350 to 499
Direction: SE-NW
Address range: 350 to 499
Other features:
Silver Crk
Length: 0.29 miles
Directions: N-S, SE-NW, SW-NE
Directions: N-S, SE-NW, SW-NE