Pavonia neighborhood in Mansfield, Ohio (OH), 44903 detailed profile
Settings
X

Business Search - 14 Million verified businesses
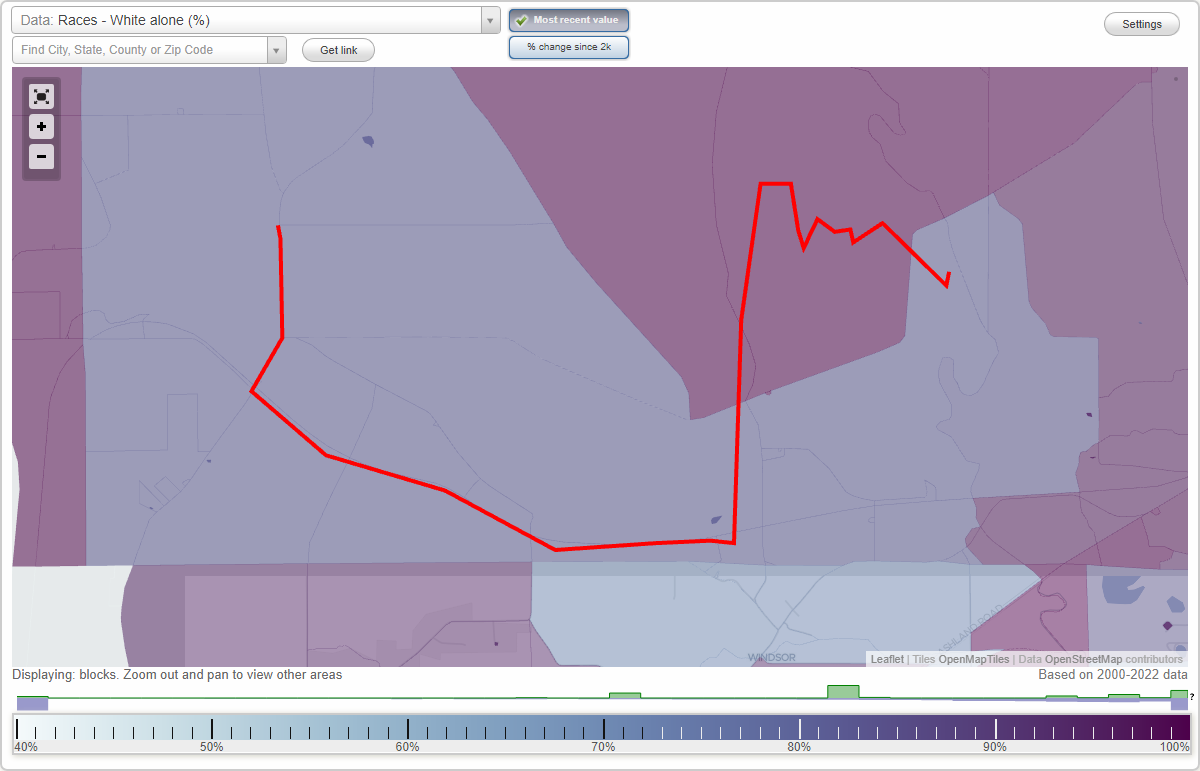
Area: 3.792 square miles
Population: 329
Population density:
| Pavonia: | 87 people per square mile |
| Mansfield: | 1,593 people per square mile |

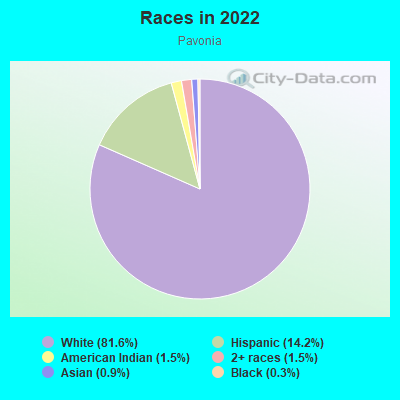
- 27081.6%White
- 4714.2%Hispanic or Latino
- 51.5%American Indian
- 51.5%Two or more races
- 30.9%Asian
- 10.3%Black
Median household income in 2022:
| Pavonia: | $89,912 |
| Mansfield: | $40,996 |
Distribution of median household income
![Distribution of median household income]()
- 6Less than $10,000
- 6$10,000 to $19,999
- 11$20,000 to $29,999
- 4$30,000 to $39,999
- 6$40,000 to $49,999
- 9$50,000 to $59,999
- 4$60,000 to $74,999
- 33$75,000 to $99,999
- 18$100,000 to $124,999
- 13$125,000 to $149,999
- 19$150,000 to $199,999
- 3$200,000 or more

Distribution of owner-occupied house/condo value
![Distribution of owner-occupied house/condo value]()
- 11Less than $50,000
- 16$50,000 to $99,999
- 8$100,000 to $149,999
- 27$150,000 to $199,999
- 19$200,000 to $249,999
- 10$250,000 to $299,999
- 28$300,000 to $399,999
- 2$400,000 to $499,999
- 10$500,000 to $749,999
- 2$750,000 to $999,999
- 4$1,000,000 or more

Distribution of rent paid by renters
![Distribution of rent paid by renters]()
- 1Less than $100
- 4$200 to $299
- 5$300 to $399
- 6$400 to $499
- 3$500 to $599
- 23$600 to $699
- 4$700 to $799
- 2$800 to $899
- 15$1,000 to $1,249
- 1$1,250 to $1,499

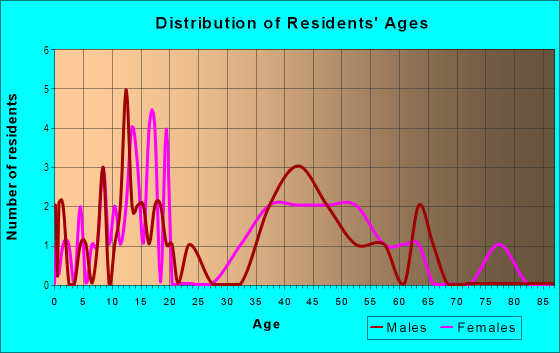
| Males: | 182 |
| Females: | 146 |
Males:
| This neighborhood: | 43.6 years |
| Whole city: | 37.4 years |
| This neighborhood: | 40.4 years |
| Whole city: | 42.1 years |
Average household size:
| Pavonia: | 16.3 people |
| Mansfield: | 2.2 people |
Percentage of family households:
| Pavonia: | 50.7% |
| Mansfield: | 34.5% |
| Here: | 72.0% |
| Mansfield: | 27.9% |
Percentage of married-couple families with children (among all households):
| Pavonia: | 31.1% |
| Mansfield: | 17.4% |
Percentage of single-mother households (among all households):
| Pavonia: | 1.6% |
| Mansfield: | 19.2% |
Percentage of never married males 15 years old and over:
Percentage of never married females 15 years old and over:
| Pavonia: | 16.7% |
| Mansfield: | 26.3% |
Percentage of never married females 15 years old and over:
| Pavonia: | 12.1% |
| city: | 15.9% |
Percentage of people that speak English not well or not at all:
| Pavonia: | 0.0% |
| Mansfield: | 0.6% |
Percentage of people born in this state:
Percentage of people born in another U.S. state:
Percentage of native residents but born outside the U.S.:
Percentage of foreign born residents:
| Here: | 88.0% |
| Mansfield: | 77.5% |
Percentage of people born in another U.S. state:
| Pavonia: | 11.6% |
| Mansfield: | 20.1% |
Percentage of native residents but born outside the U.S.:
| Here: | 6.5% |
| city: | 0.6% |
Percentage of foreign born residents:
| Here: | 0.4% |
| Mansfield: | 1.8% |
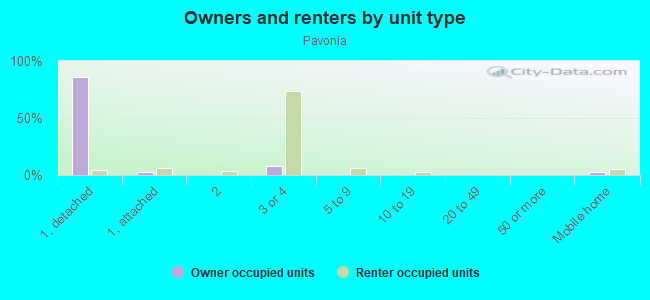
Owner-occupied
Renter-occupied

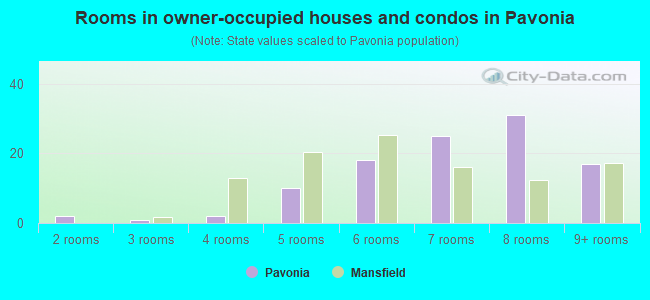
- Rooms in owner-occupied houses and condos in Pavonia
- 01 room
- 22 rooms
- 13 rooms
- 24 rooms
- 105 rooms
- 186 rooms
- 257 rooms
- 318 rooms
- 179+ rooms
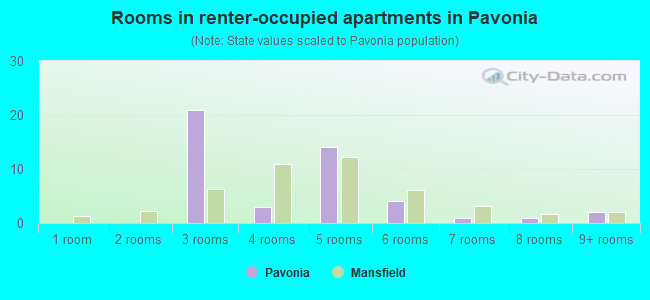
- Rooms in renter-occupied apartments in Pavonia
- 01 room
- 02 rooms
- 213 rooms
- 34 rooms
- 145 rooms
- 46 rooms
- 17 rooms
- 18 rooms
- 29+ rooms
Owner-occupied
Renter-occupied
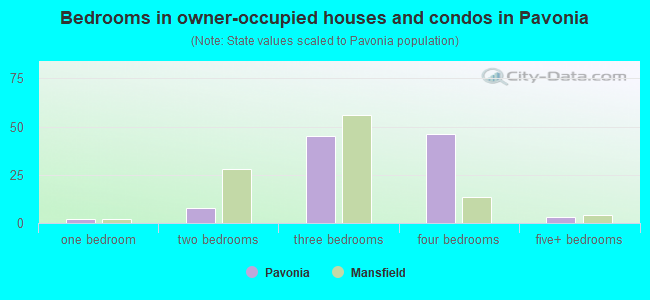
- Bedrooms in owner-occupied houses and condos in Pavonia
- 0no bedroom
- 21 bedroom
- 82 bedrooms
- 453 bedrooms
- 464 bedrooms
- 35+ bedrooms
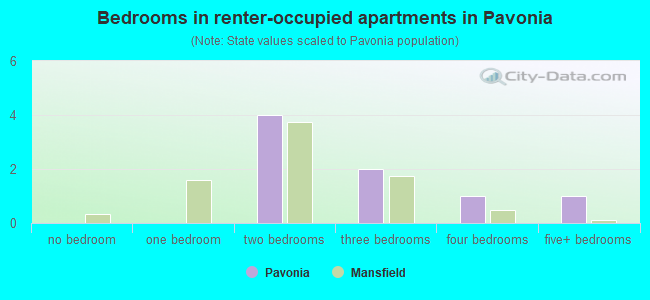
- Bedrooms in renter-occupied apartments in Pavonia
- 0no bedroom
- 01 bedroom
- 42 bedrooms
- 23 bedrooms
- 14 bedrooms
- 15+ bedrooms
Average number of cars or other vehicles available in houses/condos:
Average number of cars or other vehicles available in apartments:
| This neighborhood: | 4.5 |
| Mansfield: | 1.8 |
Average number of cars or other vehicles available in apartments:
| Here: | 11.9 |
| city: | 1.2 |
Percentage of units with a mortgage:
| Pavonia: | 55.7% |
| Mansfield: | 53.5% |
Average estimated value of detached houses in 2022 (98.1% of all units):
| Pavonia: | $280,268 |
| Mansfield: | $134,529 |
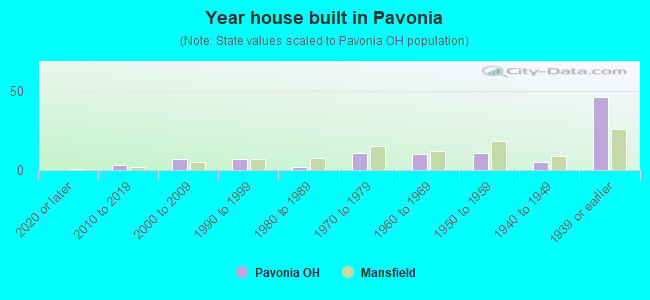
- Year house built in Pavonia
- 02020 or later
- 32010 to 2019
- 72000 to 2009
- 71990 to 1999
- 21980 to 1989
- 111970 to 1979
- 101960 to 1969
- 111950 to 1959
- 51940 to 1949
- 461939 or earlier
City-data.com crime index for city in 2020 (higher means more crime):
| City: | 173.2 |
| U.S. average: | 219.5 |
Travel time to work (commute)
![Travel time to work (commute)]()
- 6Less than 5 minutes
- 115 to 9 minutes
- 810 to 14 minutes
- 2015 to 19 minutes
- 1720 to 24 minutes
- 1025 to 29 minutes
- 730 to 34 minutes
- 1735 to 39 minutes
- 240 to 44 minutes
- 145 to 59 minutes
- 760 to 89 minutes
- 1190 or more minutes

Means of transportation to work
![Means of transportation to work]()
- 81.2%117Drove a car alone
- 2.8%4Carpooled
- 0.7%1Bus
- 1.4%2Bicycle
- 2.1%3Walked
- 9.7%14Other means
- 28.4%41Worked at home

Time leaving home to go to work
![Time leaving home to go to work]()
- 612:00 a.m. to 4:59 a.m.
- 65:00 a.m. to 5:29 a.m.
- 95:30 a.m. to 5:59 a.m.
- 136:00 a.m. to 6:29 a.m.
- 66:30 a.m. to 6:59 a.m.
- 197:00 a.m. to 7:29 a.m.
- 57:30 a.m. to 7:59 a.m.
- 88:00 a.m. to 8:29 a.m.
- 48:30 a.m. to 8:59 a.m.
- 109:00 a.m. to 9:59 a.m.
- 411:00 a.m. to 11:59 a.m.
- 412:00 p.m. to 3:59 p.m.
- 54:00 p.m. to 11:59 p.m.

Occupations of males:
- Percentage of males in management occupations (except farmers):
Here: 28.5% city: 7.7%
- Percentage of males in business and financial operations occupations:
Here: 1.9% city: 3.0%
- Percentage of males in computer and mathematical occupations:
Here: 7.8% city: 2.3%
- Percentage of males in education, training, and library occupations:
Here: 2.1% city: 1.8%
- Percentage of males in healthcare practitioners and technical occupations:
Here: 3.5% city: 3.6%
- Percentage of males in service occupations:
Here: 25.1% city: 18.3%
- Percentage of males in sales and office occupations:
Here: 8.3% city: 13.6%
- Percentage of males in construction, extraction, and maintenance occupations:
Here: 8.6% city: 4.2%
- Percentage of males in production occupations:
Here: 3.2% city: 14.0%
- Percentage of males in transportation occupations:
Here: 3.2% city: 8.0%
- Percentage of males in material moving occupations:
Here: 1.5% city: 10.4%
Occupations of females:
- Percentage of females in management occupations (except farmers):
Here: 9.6% city: 6.7%
- Percentage of females in business and financial operations occupations:
Here: 8.7% city: 3.1%
- Percentage of females in computer and mathematical occupations:
Here: 1.1% city: 0.3%
- Percentage of females in community and social services occupations:
Here: 2.4% city: 3.5%
- Percentage of females in legal occupations:
Here: 1.1% city: 0.5%
- Percentage of females in education, training, and library occupations:
Here: 13.9% city: 8.8%
- Percentage of females in healthcare practitioners and technical occupations:
Here: 20.7% city: 7.1%
- Percentage of females in service occupations:
Here: 22.0% city: 25.9%
- Percentage of females in sales and office occupations:
Here: 17.8% city: 27.3%
- Percentage of females in farming, fishing, and forestry occupations:
Here: 2.4% city: 0.1%
- Percentage of females in production occupations:
Here: 2.5% city: 9.2%
- Percentage of females in transportation occupations:
Here: 1.6% city: 1.3%
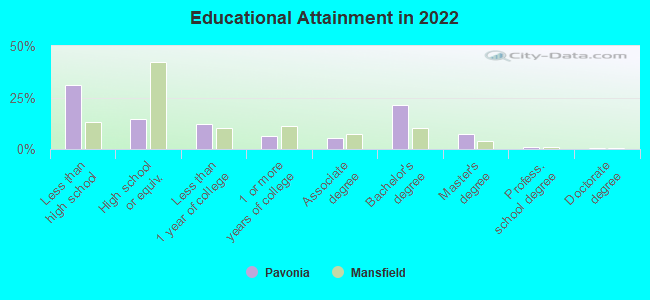
Education in this neighborhood (subdivision or community):
- Percentage of people 3 years and older in K-12 schools:
Pavonia: 26.7% Mansfield: 14.3%
- Percentage of people 3 years and older in undergraduate colleges:
Pavonia: 1.8% Mansfield: 6.0%
- Percentage of people 3 years and older in grad. or professional schools:
Pavonia: 8.2% Mansfield: 0.8%
- Percentage of students K-12 enrolled in private schools:
Pavonia: 13.6% Mansfield: 14.1%
Percentage of population below poverty level:
| Pavonia: | 6.0% |
| Mansfield: | 25.0% |
Median year owner moved in (as recorded in 2022):
| Pavonia: | 2004 |
| Mansfield: | 2006 |
Percentage of married-couple families with both working:
| Pavonia: | 97.3% |
| Mansfield: | 69.3% |
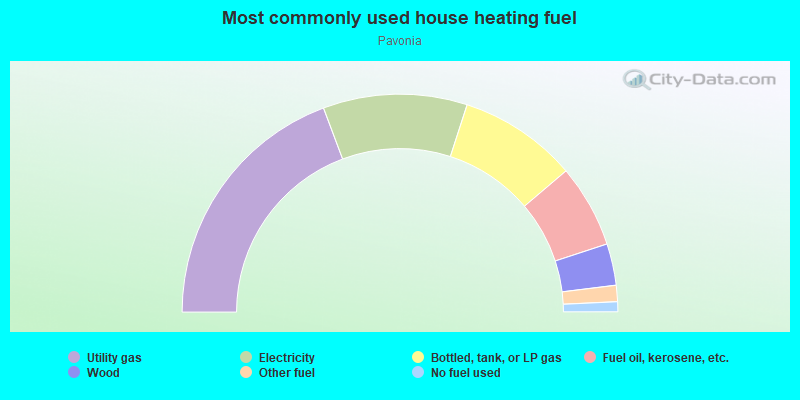
- 38.6%Utility gas
- 21.4%Electricity
- 17.6%Bottled, tank, or LP gas
- 12.3%Fuel oil, kerosene, etc.
- 6.2%Wood
- 2.4%Other fuel
- 1.5%No fuel used
Highways in this neighborhood:
Olivesburg Rd (Mansfield-Olivesburg Rd, State Rte 545)
Length: 0.04 miles
Direction: SW-NE
Direction: SW-NE
Roads and streets:
Amoy-Pavonia Rd (Co Hwy 90, Pavonia West Rd)
Length: 3.63 miles
Directions: E-W, SE-NW
Address range: 1027 to 2350
Directions: E-W, SE-NW
Address range: 1027 to 2350
Twp Hwy 262 (Osbun Rd)
Length: 1.73 miles
Directions: E-W, N-S, SE-NW, SW-NE
Address range: 1000 to 1641
Directions: E-W, N-S, SE-NW, SW-NE
Address range: 1000 to 1641
Co Hwy 260 (Pavonia North Rd)
Length: 0.80 miles
Directions: N-S, SE-NW, SW-NE
Address range: 2577 to 3000
Directions: N-S, SE-NW, SW-NE
Address range: 2577 to 3000
Cotter Rd (Twp Hwy 265)
Length: 0.77 miles
Directions: E-W, N-S, SE-NW
Address range: 2101 to 2406
Directions: E-W, N-S, SE-NW
Address range: 2101 to 2406
Pavonia Rd (Co Hwy 260)
Length: 0.59 miles
Directions: N-S, SE-NW
Address range: 2300 to 2599
Directions: N-S, SE-NW
Address range: 2300 to 2599
N Stewart Rd (Twp Hwy 267)
Length: 0.37 miles
Directions: N-S, SW-NE
Address range: 2451 to 2618
Directions: N-S, SW-NE
Address range: 2451 to 2618
Oak St
Length: 0.17 miles
Directions: E-W, N-S, SW-NE
Address range: 2400 to 2499
Directions: E-W, N-S, SW-NE
Address range: 2400 to 2499
Railroad features:
Ashland Rlwy
Length: 3.98 miles
Directions: E-W, SE-NW
Directions: E-W, SE-NW