Estimated zip code population in 2022: 25,819 Zip code population in 2010: 25,602 Zip code population in 2000: 31,209
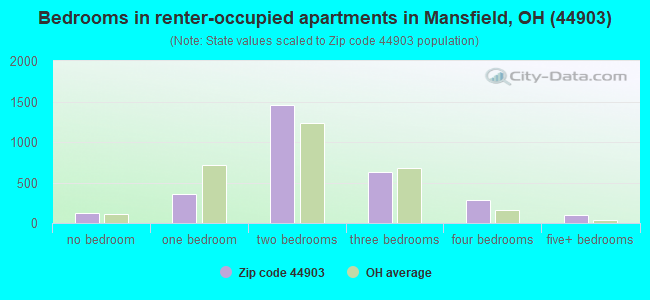
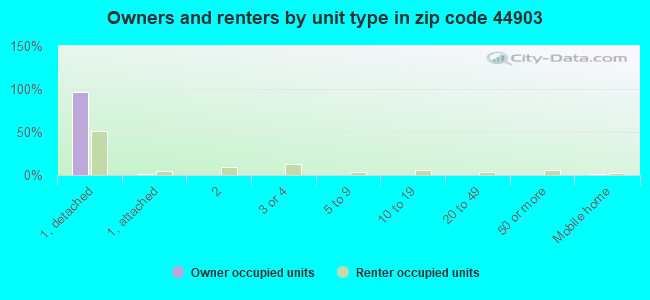
Houses and condos: 11,286 Renter-occupied apartments: 2,963
% of renters here:
29%
State:
33%
March 2022 cost of living index in zip code 44903: 90.6 (less than average, U.S. average is 100)
Land area: 114.2 sq. mi. Water area: 3.5 sq. mi.
Population density: 226 people per square mile
(very low).
OSM Map
General Map
Google Map
MSN Map
OSM Map
General Map
Google Map
MSN Map
OSM Map
General Map
Google Map
MSN Map
OSM Map
General Map
Google Map
MSN Map
Please wait while loading the map...
Real estate property taxes paid for housing units in 2022:
This zip code:
1.2% ($2,170)
Ohio:
1.3% ($2,639)
Median real estate property taxes paid for housing units with mortgages in 2022: $2,192 (1.1%) Median real estate property taxes paid for housing units with no mortgage in 2022: $2,148 (1.4%)
Averages for the 2020 tax year for zip code 44903, filed in 2021:
Average Adjusted Gross Income (AGI) in 2020: $56,099 (Individual Income Tax Returns)
Here:
$56,099
State:
$67,288
Salary/wage: $45,501 (reported on 81.3% of returns)
Here:
$45,501
State:
$55,628
(% of AGI for various income ranges: 1056.6% for AGIs below $25k, 3311.1% for AGIs $25k-50k, 5921.5% for AGIs $50k-75k, 8828.1% for AGIs $75k-100k, 15515.1% for AGIs $100k-200k, 74937.8% for AGIs over 200k)
Taxable interest for individuals: $1,273 (reported on 23.2% of returns)
This zip code:
$1,273
Ohio:
$1,518
(% of AGI for various income ranges: 8.5% for AGIs below $25k, 14.6% for AGIs $25k-50k, 32.2% for AGIs $50k-75k, 65.7% for AGIs $75k-100k, 93.3% for AGIs $100k-200k, 1476.7% for AGIs over 200k)
Ordinary dividends: $9,964 (reported on 14.7% of returns)
Here:
$9,964
State:
$7,167
(% of AGI for various income ranges: 14.2% for AGIs below $25k, 24.8% for AGIs $25k-50k, 80.6% for AGIs $50k-75k, 109.9% for AGIs $75k-100k, 261.9% for AGIs $100k-200k, 14658.9% for AGIs over 200k)
Net capital gain/loss in AGI: +$19,858 (reported on 12.9% of returns)
Here:
+$19,858
State:
+$18,919
(% of AGI for various income ranges: 7.2% for AGIs below $25k, 21.8% for AGIs $25k-50k, 70.9% for AGIs $50k-75k, 192.1% for AGIs $75k-100k, 626.4% for AGIs $100k-200k, 26680.0% for AGIs over 200k)
Profit/loss from business: +$12,181 (reported on 12.4% of returns)
Here:
+$12,181
State:
+$13,744
(% of AGI for various income ranges: 77.6% for AGIs below $25k, 88.3% for AGIs $25k-50k, 178.2% for AGIs $50k-75k, 246.4% for AGIs $75k-100k, 386.9% for AGIs $100k-200k, 7138.9% for AGIs over 200k)
Taxable individual retirement arrangement distribution: $16,553 (reported on 9.3% of returns)
44903:
$16,553
Ohio:
$18,876
(% of AGI for various income ranges: 55.8% for AGIs below $25k, 103.1% for AGIs $25k-50k, 229.2% for AGIs $50k-75k, 378.8% for AGIs $75k-100k, 775.8% for AGIs $100k-200k, 2661.1% for AGIs over 200k)
Self-employed (Keogh) retirement plans: $22,533 (reported on 0.2% of returns)
44903:
$22,533
Ohio:
$24,898
(% of AGI for various income ranges: 86.7% for AGIs $100k-200k)
Total itemized deductions: $33,002 (reported on 3.4% of returns)
Here:
$33,002
State:
$33,869
(% of AGI for various income ranges: 19.1% for AGIs below $25k, 26.4% for AGIs $25k-50k, 126.6% for AGIs $50k-75k, 205.6% for AGIs $75k-100k, 487.9% for AGIs $100k-200k, 6355.6% for AGIs over 200k)
Charity contributions: $18,447 (reported on 2.6% of returns)
Here:
$18,447
State:
$14,577
(% of AGI for various income ranges: 6.8% for AGIs $25k-50k, 23.7% for AGIs $50k-75k, 46.5% for AGIs $75k-100k, 166.2% for AGIs $100k-200k, 4166.7% for AGIs over 200k)
Taxes paid: $6,660 (reported on 3.4% of returns)
44903:
$6,660
State:
$7,681
(% of AGI for various income ranges: 2.6% for AGIs below $25k, 4.4% for AGIs $25k-50k, 22.9% for AGIs $50k-75k, 47.9% for AGIs $75k-100k, 135.1% for AGIs $100k-200k, 1027.8% for AGIs over 200k)
Earned income credit: $2,429 (reported on 18.4% of returns)
Here:
$2,429
State:
$2,304
(% of AGI for various income ranges: 105.5% for AGIs below $25k, 66.2% for AGIs $25k-50k, 1.3% for AGIs $50k-75k)
Percentage of individuals using paid preparers for their 2020 taxes: 94.8%
Here:
95%
State:
94%
(% for various income ranges: 94.2% for AGIs below $25k, 95.5% for AGIs $25k-50k, 95.6% for AGIs $50k-75k, 93.8% for AGIs $75k-100k, 94.5% for AGIs $100k-200k, 96.9% for AGIs over 200k)
Averages for the 2012 tax year for zip code 44903, filed in 2013:
Average Adjusted Gross Income (AGI) in 2012: $47,340 (Individual Income Tax Returns)
Here:
$47,340
State:
$54,926
Salary/wage: $38,709 (reported on 84.4% of returns)
Here:
$38,709
State:
$45,869
(% of AGI for various income ranges: 72.8% for AGIs below $25k, 73.1% for AGIs $25k-50k, 76.0% for AGIs $50k-75k, 77.1% for AGIs $75k-100k, 73.3% for AGIs $100k-200k, 44.8% for AGIs over 200k)
Taxable interest for individuals: $1,192 (reported on 28.8% of returns)
This zip code:
$1,192
Ohio:
$1,297
(% of AGI for various income ranges: 0.9% for AGIs below $25k, 0.6% for AGIs $25k-50k, 0.5% for AGIs $50k-75k, 0.6% for AGIs $75k-100k, 0.6% for AGIs $100k-200k, 1.2% for AGIs over 200k)
Ordinary dividends: $3,781 (reported on 16.3% of returns)
Here:
$3,781
State:
$5,821
(% of AGI for various income ranges: 1.0% for AGIs below $25k, 0.8% for AGIs $25k-50k, 0.7% for AGIs $50k-75k, 0.7% for AGIs $75k-100k, 1.4% for AGIs $100k-200k, 3.0% for AGIs over 200k)
Net capital gain/loss in AGI: +$8,138 (reported on 12.0% of returns)
Here:
+$8,138
State:
+$11,232
(% of AGI for various income ranges: 0.3% for AGIs $25k-50k, 0.3% for AGIs $50k-75k, 0.8% for AGIs $75k-100k, 1.5% for AGIs $100k-200k, 8.6% for AGIs over 200k)
Profit/loss from business: +$10,808 (reported on 12.5% of returns)
Here:
+$10,808
State:
+$12,773
(% of AGI for various income ranges: 6.1% for AGIs below $25k, 2.2% for AGIs $25k-50k, 2.3% for AGIs $50k-75k, 1.2% for AGIs $75k-100k, 3.2% for AGIs $100k-200k, 3.1% for AGIs over 200k)
Taxable individual retirement arrangement distribution: $12,522 (reported on 10.5% of returns)
44903:
$12,522
Ohio:
$14,511
(% of AGI for various income ranges: 3.5% for AGIs below $25k, 2.7% for AGIs $25k-50k, 2.9% for AGIs $50k-75k, 2.5% for AGIs $75k-100k, 2.8% for AGIs $100k-200k, 2.5% for AGIs over 200k)
Self-employment retirement plans: $16,733 (reported on 0.3% of returns)
44903:
$16,733
Ohio:
$20,257
(% of AGI for various income ranges: 0.5% for AGIs $100k-200k)
Total itemized deductions: $19,622 (19% of AGI, reported on 24.5% of returns)
Here:
$19,622
State:
$21,278
Here:
19.4% of AGI
State:
18.8% of AGI
(% of AGI for various income ranges: 6.2% for AGIs below $25k, 7.6% for AGIs $25k-50k, 9.9% for AGIs $50k-75k, 10.5% for AGIs $75k-100k, 12.8% for AGIs $100k-200k, 12.7% for AGIs over 200k)
Charity contributions: $4,797 (reported on 18.3% of returns)
Here:
$4,797
State:
$3,943
(% of AGI for various income ranges: 0.6% for AGIs below $25k, 1.1% for AGIs $25k-50k, 1.7% for AGIs $50k-75k, 1.7% for AGIs $75k-100k, 2.4% for AGIs $100k-200k, 3.2% for AGIs over 200k)
Taxes paid: $7,680 (reported on 24.5% of returns)
44903:
$7,680
State:
$9,568
(% of AGI for various income ranges: 1.1% for AGIs below $25k, 2.0% for AGIs $25k-50k, 3.1% for AGIs $50k-75k, 3.9% for AGIs $75k-100k, 5.7% for AGIs $100k-200k, 7.0% for AGIs over 200k)
Earned income credit: $2,368 (reported on 21.2% of returns)
Here:
$2,368
State:
$2,285
(% of AGI for various income ranges: 7.8% for AGIs below $25k, 1.0% for AGIs $25k-50k)
Percentage of individuals using paid preparers for their 2012 taxes: 52.3%
Here:
52%
State:
51%
(% for various income ranges: 46.3% for AGIs below $25k, 54.3% for AGIs $25k-50k, 56.3% for AGIs $50k-75k, 56.7% for AGIs $75k-100k, 61.0% for AGIs $100k-200k, 90.0% for AGIs over 200k)
Averages for the 2004 tax year for zip code 44903, filed in 2005:
Average Adjusted Gross Income (AGI) in 2004: $39,433 (Individual Income Tax Returns)
Here:
$39,433
State:
$44,480
Salary/wage: $36,181 (reported on 88.2% of returns)
Here:
$36,181
State:
$39,198
(% of AGI for various income ranges: 144.4% for AGIs below $10k, 76.5% for AGIs $10k-25k, 81.5% for AGIs $25k-50k, 85.3% for AGIs $50k-75k, 86.7% for AGIs $75k-100k, 71.9% for AGIs over 100k)
Taxable interest for individuals: $1,063 (reported on 43.5% of returns)
This zip code:
$1,063
Ohio:
$1,532
(% of AGI for various income ranges: 6.2% for AGIs below $10k, 1.7% for AGIs $10k-25k, 1.0% for AGIs $25k-50k, 0.9% for AGIs $50k-75k, 0.8% for AGIs $75k-100k, 1.2% for AGIs over 100k)
Taxable dividends: $1,787 (reported on 20.0% of returns)
Here:
$1,787
State:
$3,496
(% of AGI for various income ranges: 3.3% for AGIs below $10k, 0.8% for AGIs $10k-25k, 0.7% for AGIs $25k-50k, 0.7% for AGIs $50k-75k, 0.8% for AGIs $75k-100k, 1.2% for AGIs over 100k)
Net capital gain/loss: +$3,714 (reported on 15.0% of returns)
Here:
+$3,714
State:
+$8,582
(% of AGI for various income ranges: -1.0% for AGIs below $10k, 0.1% for AGIs $10k-25k, 0.5% for AGIs $25k-50k, 0.8% for AGIs $50k-75k, 1.2% for AGIs $75k-100k, 3.5% for AGIs over 100k)
Profit/loss from business: +$8,812 (reported on 12.4% of returns)
Here:
+$8,812
State:
+$10,813
(% of AGI for various income ranges: 6.4% for AGIs below $10k, 3.1% for AGIs $10k-25k, 2.4% for AGIs $25k-50k, 2.1% for AGIs $50k-75k, 2.3% for AGIs $75k-100k, 3.5% for AGIs over 100k)
IRA payment deduction: $3,073 (reported on 2.0% of returns)
44903:
$3,073
Ohio:
$2,794
(% of AGI for various income ranges: 0.2% for AGIs $10k-25k, 0.2% for AGIs $25k-50k, 0.2% for AGIs $50k-75k, 0.1% for AGIs $75k-100k, 0.1% for AGIs over 100k)
Self-employed pension: $11,073 (reported on 0.3% of returns)
Here:
$11,073
Ohio:
$13,981
Total itemized deductions: $15,633 (21% of AGI, reported on 30.6% of returns)
Here:
$15,633
State:
$17,503
Here:
20.6% of AGI
State:
20.8% of AGI
(% of AGI for various income ranges: 7.1% for AGIs below $10k, 6.3% for AGIs $10k-25k, 10.1% for AGIs $25k-50k, 13.1% for AGIs $50k-75k, 14.3% for AGIs $75k-100k, 14.6% for AGIs over 100k)
Charity contributions deductions: $3,062 (4% of AGI, reported on 24.9% of returns)
Here:
$3,062
State:
$3,087
Here:
3.8% of AGI
State:
3.4% of AGI
(% of AGI for various income ranges: 0.5% for AGIs below $10k, 0.8% for AGIs $10k-25k, 1.5% for AGIs $25k-50k, 2.0% for AGIs $50k-75k, 2.4% for AGIs $75k-100k, 2.5% for AGIs over 100k)
Total tax: $5,661 (reported on 73.1% of returns)
44903:
$5,661
State:
$6,781
(% of AGI for various income ranges: 3.1% for AGIs below $10k, 3.8% for AGIs $10k-25k, 6.9% for AGIs $25k-50k, 9.0% for AGIs $50k-75k, 10.6% for AGIs $75k-100k, 17.9% for AGIs over 100k)
Earned income credit: $1,743 (reported on 16.7% of returns)
Here:
$1,743
State:
$1,696
Percentage of individuals using paid preparers for their 2004 taxes: 56.9%
Here:
57%
State:
55%
(% for various income ranges: 46.6% for AGIs below $10k, 58.7% for AGIs $10k-25k, 60.2% for AGIs $25k-50k, 57.7% for AGIs $50k-75k, 57.1% for AGIs $75k-100k, 69.0% for AGIs over 100k)
Likely homosexual households (counted as self-reported same-sex unmarried-partner households)
Lesbian couples: 0.0% of all households
Gay men: 0.0% of all households
Household received Food Stamps/SNAP in the past 12 months: 1,971 Household did not receive Food Stamps/SNAP in the past 12 months: 8,366
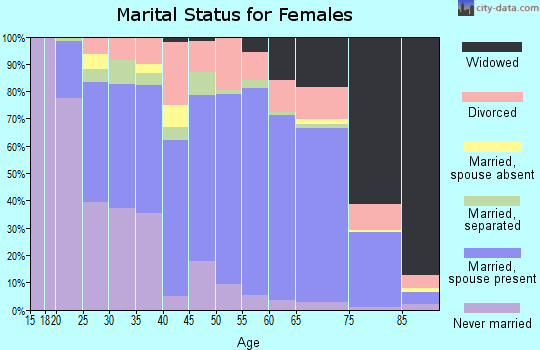
Women who had a birth in the past 12 months: 348 (156 now married, 187 unmarried) Women who did not have a birth in the past 12 months: 5,104 (2,303 now married, 2,800 unmarried)
Housing units in zip code 44903 with a mortgage: 3,979 (332 second mortgage, 266 both second mortgage and home equity loan) Houses without a mortgage: 406
Median monthly owner costs for units with a mortgage: $1,272 Median monthly owner costs for units without a mortgage: $495
Residents with income below the poverty level in 2022:
This zip code:
17.6%
Whole state:
13.4%
Residents with income below 50% of the poverty level in 2022:
This zip code:
9.1%
Whole state:
7.0%
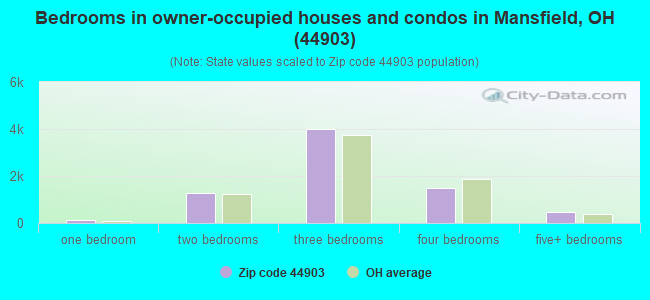
Median number of rooms in houses and condos:
Here:
6.7
State:
6.7
Median number of rooms in apartments:
Here:
5.0
State:
4.4
Notable locations in this zip code not listed on our city pages
3,621 married couples with children.
1,977 single-parent households (177 men, 1,800 women).
97.0% of residents of 44903 zip code speak English at home.
0.9% of residents speak Spanish at home (74% very well, 6% well, 4% not well, 15% not at all).
1.0% of residents speak other Indo-European language at home (67% very well, 23% well, 10% not well).
0.4% of residents speak Asian or Pacific Island language at home (52% very well, 45% well, 3% not well).
0.5% of residents speak other language at home (100% well).
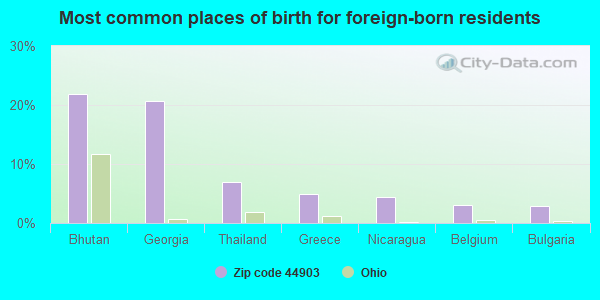
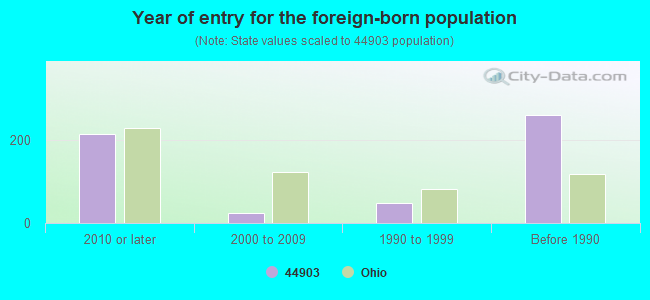
Foreign born population: 392 (1.5%) (63.1% of them are naturalized citizens)
Facilities with environmental interests located in this zip code:
179 AIRLIFT WING OHIO AIR NATL GUARD * (1947 HARRINGTON MEMORIAL RD in MANSFIELD, OH) . Federal Facility. U.S. AIR FORCE
STATE MASTER (Ohio general info) - RCRA-OHD980903405, HAZARDOUS WASTE PROGRAM STATE MASTER (Ohio general info) - PCS-OH0125466, National Pollutant Discharge Elimination System Permit, AIR MAJOR, EPCRA National Pollutant Discharge Elimination System NON-MAJOR (Tracking pollutant discharge elimination systems) - permit (Resource Conservation and Recovery Act (tracking hazardous waste)) HAZARDOUS WASTE BIENNIAL REPORTER (Resource Conservation and Recovery Act (tracking hazardous waste)) Small Quantity Generators, between 100 kg and 1000 kg of hazardous waste/month (Resource Conservation and Recovery Act (tracking hazardous waste)) - notification Business SIC classification: AIRPORTS, FLYING FIELDS, AND AIRPORT TERMINAL SERVICES; NATIONAL SECURITY Organizations: 179TH AIRLIFT WING (CONTACT/OPERATOR)
, OHIO AIR NATIONAL GUARD (CONTACT/OWNER)
, NATIONAL GUARD BUREAU (CONTACT/OWNER)
, US GOVERNMENT (CONTACT/OWNER)
, 179TH AIRLIFT WING (CONTACT/OWNER)
Alternative names: CGOHIO AIR NATIONAL GUARD, OHIO AIR NATIONAL GUARD, OHIO AIR NATIONAL GUARD 179 AIRLIFT GROUP *, OHIO AIR NATIONAL GUARD 179TH AIRLIFT WING, OHIO AIR NATIONAL GUARD-JET FU, USAF MANSFIELD ANG BASE
AMERISCREW INC (653 LIDA ST in MANSFIELD, OH)
STATE MASTER (Ohio general info) - RCRA-OHD057255960, HAZARDOUS WASTE PROGRAM HAZARDOUS WASTE BIENNIAL REPORTER (Resource Conservation and Recovery Act (tracking hazardous waste)) Small Quantity Generators, between 100 kg and 1000 kg of hazardous waste/month (Resource Conservation and Recovery Act (tracking hazardous waste)) - notification Business SIC classification: SCREW MACHINE PRODUCTS Business NAICS classification: METAL STAMPING.; PRECISION TURNED PRODUCT MANUFACTURING. Organizations: MARTHA KEITH (CONTACT/OWNER)
Alternative names: AMERICAN ELECTRICAL PRODUCTS CO, AMERASCREW, INC.
BECKLEY CARDY (100 PARAGON PKWY in MANSFIELD, OH)
STATE MASTER (Ohio general info) - EPCRA, RCRA-OHR000015115, HAZARDOUS WASTE PROGRAM Conditionally Exempt Small Quantity Generators, less than 100 kg/month of hazardous waste (Resource Conservation and Recovery Act (tracking hazardous waste)) - notification Organizations: BECKLEY-CARDY INC (CONTACT/OWNER)
ANOTECH CORP (140 MANSFIELD INDUSTRIAL PKY. in MANSFIELD, OH)
STATE MASTER (Ohio general info) - AIR MAJOR TSD (Resource Conservation and Recovery Act (tracking hazardous waste)) TRI REPORTER (Tracking of toxic chemicals releasing facilities) Business SIC classification: AUTOMOTIVE STAMPINGS
ALTERNATIVE HIGH SCHOOL (445 BOWMAN ST in MANSFIELD, OH)
(National Center for Education Statistics) - STATE ID-135566 Organizations: MANSFIELD CITY SD (SCHOOL DISTRICT)
ALLEN JERRY GARN (182 STURGES AVENUE in MANSFIELD, OH)
(Integrated Compliance Information System) - ICIS-05-2004-0019, FORMAL ENFORCEMENT ACTION
ALLTEL - ONTARIO (8 ST RT 314 SOUTH in MANSFIELD, OH)
(Integrated Compliance Information System) - ICIS-HQ-2000-6004, FORMAL ENFORCEMENT ACTION
ALLTEL - WOOSTER HEIGHTS (2431 PETERSON RD in MANSFIELD, OH)
(Integrated Compliance Information System) - ICIS-HQ-2000-6004, FORMAL ENFORCEMENT ACTION
ASHLAND RAILWAY INC (913 BOWMAN STREET in MANSFIELD, OH)
CENTRAL RADIATOR INC (200 W FOURTH ST in MANSFIELD, OH)
Conditionally Exempt Small Quantity Generators, less than 100 kg/month of hazardous waste (Resource Conservation and Recovery Act (tracking hazardous waste)) - notification Organizations: MILLER DAVID N AND KANZ STEVEN D (CONTACT/OWNER)
CHARLES MILL SITES LAKE (CRIDER RD AND US 30 in MANSFIELD, OH)
National Pollutant Discharge Elimination System NON-MAJOR (Tracking pollutant discharge elimination systems) - permit Business SIC classification: SEWERAGE SYSTEMS
Housing units lacking complete plumbing facilities: 1.3% Housing units lacking complete kitchen facilities: 1.7%
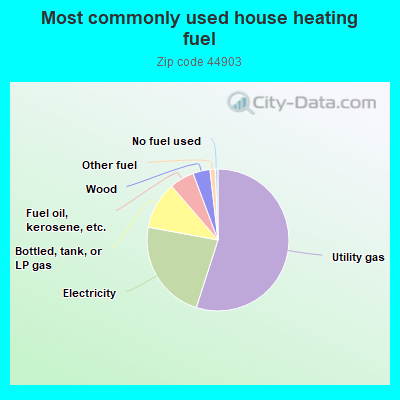
55.0%Utility gas
23.0%Electricity
10.8%Bottled, tank, or LP gas
5.6%Fuel oil, kerosene, etc.
3.9%Wood
1.2%Other fuel
0.6%No fuel used
Population in 1990: 26,575. Population change in the 1990s: +4,634 (+17.4%).
Place of birth for U.S.-born residents:
This state: 20,852
Northeast: 923
Midwest: 1,492
South: 1,407
West: 567
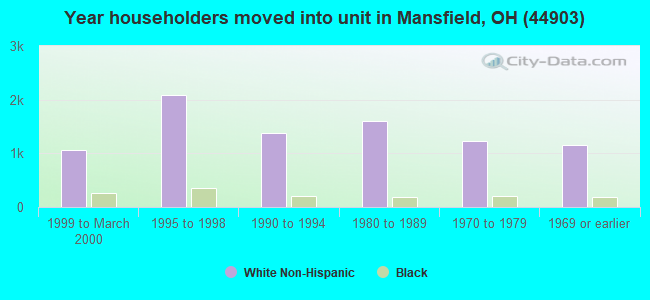
60% of the 44903 zip code residents lived in the same house 5 years ago. Out of people who lived in different houses, 58% lived in this county. Out of people who lived in different counties, 50% lived in Ohio.
91% of the 44903 zip code residents lived in the same house 1 year ago. Out of people who lived in different houses, 56% moved from this county. Out of people who lived in different houses, 29% moved from different county within same state. Out of people who lived in different houses, 9% moved from different state. Out of people who lived in different houses, 7% moved from abroad.
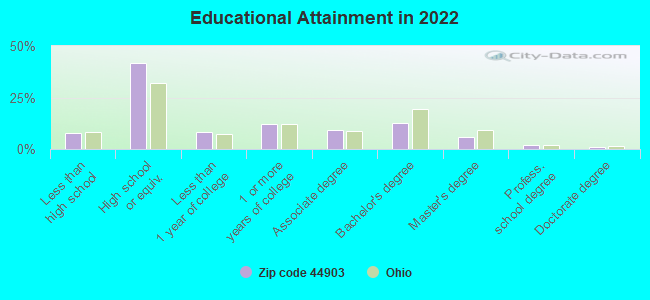
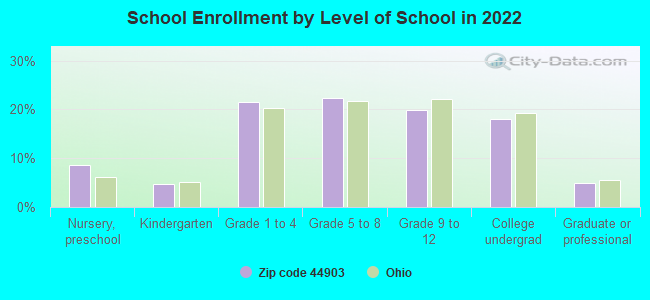
Private vs. public school enrollment:
Students in private schools in grades 1 to 8 (elementary and middle school): 238
Here:
9.4%
Ohio:
16.0%
Students in private schools in grades 9 to 12 (high school): 162
Here:
14.0%
Ohio:
13.1%
Students in private undergraduate colleges: 202
Here:
19.3%
Ohio:
22.3%
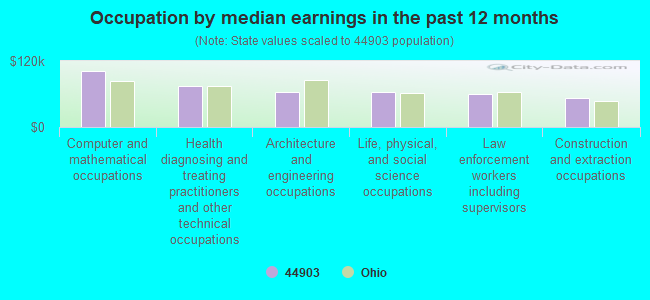
Occupation by median earnings in the past 12 months ($)
101,568Computer and mathematical occupations
74,802Health diagnosing and treating practitioners and other technical occupations
64,420Architecture and engineering occupations
64,136Life, physical, and social science occupations
59,838Law enforcement workers including supervisors
52,305Construction and extraction occupations
Companies with federal contracts located in this zip code (MANSFIELD, OH):
GORMAN-RUPP COMPANY (305 BOWMAN ST) : $2,045,807 in 48 contractsfrom 2000 to 2006
Contracts for Power and Hand Pumps, Engine Fuel System Components, Nonaircraft, Valves, Nonpowered, Safety and Rescue Equipment, and moreby Army, Defense Logistics Agency, U.S. Army Corps of Engineers - civil program financing only, Bureau of Land Management, and others Signed by year:2000: $250,324; 2001: $440,380; 2002: $121,566; 2003: $520,435; 2004: $362,564; 2005: $156,339; 2006: $194,199.
Biggest contracts:
$289,797 with Army for Power and Hand Pumps. Signed on 2003-10-04. Completion date: 2007-10-13.
$133,836 with Defense Logistics Agency for Power and Hand Pumps. Signed on 2001-05-22. Completion date: 2001-10-26.
$133,836, same as above.Signed on 2001-05-22. Completion date: 2001-10-26.
$117,000 with Army for Power and Hand Pumps. Signed on 2002-09-23. Completion date: 2003-02-15.
BAYMONT INNS, INC (120 STANDER AVENUE) : $1,184,600 in 7 contractsfrom 2004 to 2006
Contracts for Lodging - Hotel/Motel by Army Signed by year:2000: $0; 2001: $0; 2002: $0; 2003: $0; 2004: $893,040; 2005: $134,680; 2006: $156,880.
Biggest contracts:
$540,200 with Army for Lodging - Hotel/Motel. Signed on 2004-11-16. Completion date: 2004-09-30.
$317,800, same as above.Signed on 2004-02-18. Completion date: 2004-09-30.
$156,880, same as above.Signed on 2006-01-06. Completion date: 2004-09-30.
$134,680, same as above.Signed on 2005-10-17. Completion date: 2004-09-30.
BECKLEY CARDY GROUP (100 PARAGON PKWY) : $58,432 in 2 contractsin 2001
$58,432 with Army for Miscellaneous Household and Commercial Furnishings and Appliances. Signed on 2001-09-29. Completion date: 2001-10-31.
$0, same as above.Signed on 2001-09-29. Completion date: 2001-10-31.
COREL SEATING CORP (169 LONGVIEW AVE W; small business) : $36,922 in 4 contractsfrom 2004 to 2005
$24,954 with Army for Office Furniture. Signed on 2004-04-14. Completion date: 2004-06-16.
$5,520, same as above.Signed on 2004-09-30. Completion date: 2004-10-06.
$3,848 with Air Force for Household Furniture. Signed on 2005-05-24. Completion date: 2005-06-17.
$2,600 with Army for Office Furniture. Signed on 2004-09-21. Completion date: 2004-11-10.
MEDCENTRAL HEALTH SYSTEM (335 GLESSNER AVE) : $25,804 in 112 contractsfrom 2003 to 2006
Contracts for General Health Care Services, Other Medical Services, Miscellaneous Items by Department of Veterans Affairs, Army Signed by year:2000: $0; 2001: $0; 2002: $0; 2003: $12,718; 2004: $8,997; 2005: $0; 2006: $4,089.
Biggest contracts:
$9,033 with Department of Veterans Affairs for General Health Care Services. Signed on 2003-10-01. Completion date: 2003-12-31.
$3,685, same as above.Signed on 2003-07-15. Completion date: 2003-09-15.
$856 with Army for Other Medical Services. Signed on 2004-09-30. Completion date: 2004-03-17.
$635, same as above.Signed on 2004-09-30. Completion date: 2004-01-13.
SUPER 8 MOTEL (2425 INTERSTATE CIRCLE; small business)
$12,985 with Army for Lodging - Hotel/Motel. Signed on 2005-09-02. Completion date: 2005-09-06.
MANSFIELD TRUCK SALES & SERVIC (85 EAST LONGVIEW AVENUE)
$6,818 with Army for Maintenance, Repair and Rebuilding of Equipment -- Ground Effect Vehicles, Motor Vehicles, Trailers, and Cycles. Signed on 2005-01-12. Completion date: 2005-02-10.
Top industries in this zip code by the number of employees in 2005:
Health Care and Social Assistance: General Medical and Surgical Hospitals (over 1000 employees: 1 establishment)
2002 - 2018 National Fire Incident Reporting System (NFIRS) incidents
According to the data from the years 2002 - 2018 the average number of fire incidents per year is 120. The highest number of fires - 171 took place in 2014, and the least - 75 in 2004. The data has an increasing trend.
When looking into fire subcategories, the most incidents belonged to: Structure Fires (49.9%), and Outside Fires (34.2%).
Fire incident types reported to NFIRS in Zip Code 44903

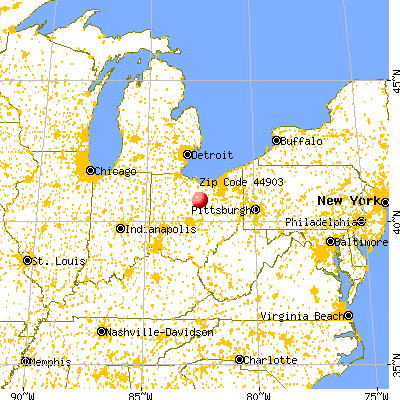


 Nearest zip codes: 44901, 44902, 44906, 44907, 44905, 44904.


 . Federal Facility. U.S. AIR FORCE
 According to the data from the years 2002 - 2018 the average number of fire incidents per year is 120. The highest number of fires - 171 took place in 2014, and the least - 75 in 2004. The data has an increasing trend.
 When looking into fire subcategories, the most incidents belonged to: Structure Fires (49.9%), and Outside Fires (34.2%).