Estimated zip code population in 2022: 16,863 Zip code population in 2010: 16,718 Zip code population in 2000: 17,846
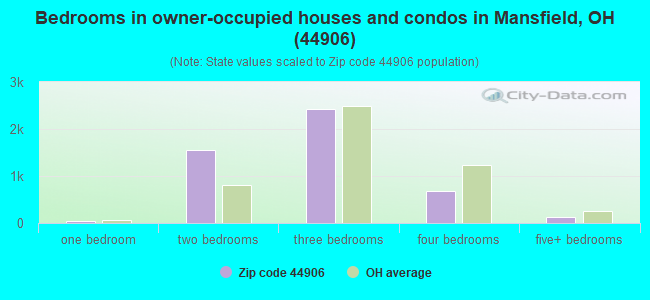
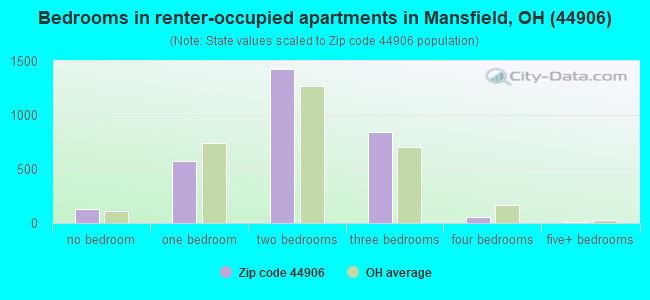
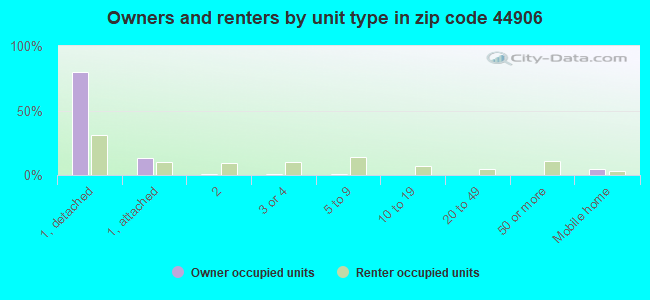
Houses and condos: 8,663 Renter-occupied apartments: 3,033
% of renters here:
39%
State:
33%
March 2022 cost of living index in zip code 44906: 90.3 (less than average, U.S. average is 100)
Land area: 20.8 sq. mi. Water area: 0.0 sq. mi.
Population density: 811 people per square mile
(low).
OSM Map
General Map
Google Map
MSN Map
OSM Map
General Map
Google Map
MSN Map
OSM Map
General Map
Google Map
MSN Map
OSM Map
General Map
Google Map
MSN Map
Please wait while loading the map...
Real estate property taxes paid for housing units in 2022:
This zip code:
1.3% ($1,721)
Ohio:
1.3% ($2,639)
Median real estate property taxes paid for housing units with mortgages in 2022: $1,696 (1.3%) Median real estate property taxes paid for housing units with no mortgage in 2022: $1,769 (1.3%)
Averages for the 2020 tax year for zip code 44906, filed in 2021:
Average Adjusted Gross Income (AGI) in 2020: $53,427 (Individual Income Tax Returns)
Here:
$53,427
State:
$67,288
Salary/wage: $42,244 (reported on 78.6% of returns)
Here:
$42,244
State:
$55,628
(% of AGI for various income ranges: 1041.2% for AGIs below $25k, 3286.0% for AGIs $25k-50k, 5844.0% for AGIs $50k-75k, 8999.2% for AGIs $75k-100k, 15049.2% for AGIs $100k-200k, 99930.0% for AGIs over 200k)
Taxable interest for individuals: $1,547 (reported on 21.4% of returns)
This zip code:
$1,547
Ohio:
$1,518
(% of AGI for various income ranges: 8.3% for AGIs below $25k, 15.7% for AGIs $25k-50k, 46.0% for AGIs $50k-75k, 77.9% for AGIs $75k-100k, 141.1% for AGIs $100k-200k, 2432.5% for AGIs over 200k)
Ordinary dividends: $10,405 (reported on 15.5% of returns)
Here:
$10,405
State:
$7,167
(% of AGI for various income ranges: 17.2% for AGIs below $25k, 29.4% for AGIs $25k-50k, 119.2% for AGIs $50k-75k, 123.3% for AGIs $75k-100k, 683.8% for AGIs $100k-200k, 20452.5% for AGIs over 200k)
Net capital gain/loss in AGI: +$20,531 (reported on 13.9% of returns)
Here:
+$20,531
State:
+$18,919
(% of AGI for various income ranges: 6.3% for AGIs below $25k, 19.6% for AGIs $25k-50k, 110.1% for AGIs $50k-75k, 255.1% for AGIs $75k-100k, 806.8% for AGIs $100k-200k, 44840.0% for AGIs over 200k)
Profit/loss from business: +$12,283 (reported on 10.9% of returns)
Here:
+$12,283
State:
+$13,744
(% of AGI for various income ranges: 73.8% for AGIs below $25k, 74.6% for AGIs $25k-50k, 115.9% for AGIs $50k-75k, 193.1% for AGIs $75k-100k, 482.4% for AGIs $100k-200k, 10387.5% for AGIs over 200k)
Taxable individual retirement arrangement distribution: $14,471 (reported on 10.5% of returns)
44906:
$14,471
Ohio:
$18,876
(% of AGI for various income ranges: 64.0% for AGIs below $25k, 117.5% for AGIs $25k-50k, 266.3% for AGIs $50k-75k, 390.8% for AGIs $75k-100k, 1118.6% for AGIs $100k-200k, 1552.5% for AGIs over 200k)
Total itemized deductions: $42,476 (reported on 3.1% of returns)
Here:
$42,476
State:
$33,869
(% of AGI for various income ranges: 59.2% for AGIs $25k-50k, 127.4% for AGIs $50k-75k, 208.5% for AGIs $75k-100k, 722.4% for AGIs $100k-200k, 12117.5% for AGIs over 200k)
Charity contributions: $21,984 (reported on 2.3% of returns)
Here:
$21,984
State:
$14,577
(% of AGI for various income ranges: 6.0% for AGIs below $25k, 31.0% for AGIs $50k-75k, 45.9% for AGIs $75k-100k, 310.3% for AGIs $100k-200k, 6105.0% for AGIs over 200k)
Taxes paid: $6,600 (reported on 2.9% of returns)
44906:
$6,600
State:
$7,681
(% of AGI for various income ranges: 4.6% for AGIs $25k-50k, 24.5% for AGIs $50k-75k, 51.3% for AGIs $75k-100k, 153.5% for AGIs $100k-200k, 1280.0% for AGIs over 200k)
Earned income credit: $2,284 (reported on 18.7% of returns)
Here:
$2,284
State:
$2,304
(% of AGI for various income ranges: 91.9% for AGIs below $25k, 65.4% for AGIs $25k-50k, 1.4% for AGIs $50k-75k)
Percentage of individuals using paid preparers for their 2020 taxes: 95.2%
Here:
95%
State:
94%
(% for various income ranges: 94.8% for AGIs below $25k, 95.2% for AGIs $25k-50k, 95.0% for AGIs $50k-75k, 94.8% for AGIs $75k-100k, 96.9% for AGIs $100k-200k, 100.0% for AGIs over 200k)
Averages for the 2012 tax year for zip code 44906, filed in 2013:
Average Adjusted Gross Income (AGI) in 2012: $44,091 (Individual Income Tax Returns)
Here:
$44,091
State:
$54,926
Salary/wage: $34,975 (reported on 81.7% of returns)
Here:
$34,975
State:
$45,869
(% of AGI for various income ranges: 70.6% for AGIs below $25k, 75.6% for AGIs $25k-50k, 72.3% for AGIs $50k-75k, 72.2% for AGIs $75k-100k, 63.2% for AGIs $100k-200k, 40.1% for AGIs over 200k)
Taxable interest for individuals: $1,854 (reported on 28.3% of returns)
This zip code:
$1,854
Ohio:
$1,297
(% of AGI for various income ranges: 1.0% for AGIs below $25k, 0.7% for AGIs $25k-50k, 0.8% for AGIs $50k-75k, 1.0% for AGIs $75k-100k, 1.0% for AGIs $100k-200k, 2.5% for AGIs over 200k)
Ordinary dividends: $8,354 (reported on 16.1% of returns)
Here:
$8,354
State:
$5,821
(% of AGI for various income ranges: 1.6% for AGIs below $25k, 1.0% for AGIs $25k-50k, 1.6% for AGIs $50k-75k, 1.6% for AGIs $75k-100k, 4.3% for AGIs $100k-200k, 7.4% for AGIs over 200k)
Net capital gain/loss in AGI: +$7,928 (reported on 12.2% of returns)
Here:
+$7,928
State:
+$11,232
(% of AGI for various income ranges: 0.1% for AGIs $25k-50k, 0.8% for AGIs $50k-75k, 0.5% for AGIs $75k-100k, 3.1% for AGIs $100k-200k, 7.5% for AGIs over 200k)
Profit/loss from business: +$12,208 (reported on 10.7% of returns)
Here:
+$12,208
State:
+$12,773
(% of AGI for various income ranges: 4.6% for AGIs below $25k, 1.7% for AGIs $25k-50k, 1.6% for AGIs $50k-75k, 2.2% for AGIs $75k-100k, 3.4% for AGIs $100k-200k, 4.5% for AGIs over 200k)
Taxable individual retirement arrangement distribution: $12,629 (reported on 11.7% of returns)
44906:
$12,629
Ohio:
$14,511
(% of AGI for various income ranges: 3.6% for AGIs below $25k, 2.5% for AGIs $25k-50k, 3.2% for AGIs $50k-75k, 3.5% for AGIs $75k-100k, 6.2% for AGIs $100k-200k, 2.3% for AGIs over 200k)
Self-employment retirement plans: $22,533 (reported on 0.4% of returns)
44906:
$22,533
Ohio:
$20,257
(% of AGI for various income ranges: 1.4% for AGIs $100k-200k)
Total itemized deductions: $20,931 (20% of AGI, reported on 20.3% of returns)
Here:
$20,931
State:
$21,278
Here:
19.9% of AGI
State:
18.8% of AGI
(% of AGI for various income ranges: 6.3% for AGIs below $25k, 6.6% for AGIs $25k-50k, 8.2% for AGIs $50k-75k, 9.9% for AGIs $75k-100k, 13.7% for AGIs $100k-200k, 13.4% for AGIs over 200k)
Charity contributions: $5,198 (reported on 15.6% of returns)
Here:
$5,198
State:
$3,943
(% of AGI for various income ranges: 0.7% for AGIs below $25k, 1.0% for AGIs $25k-50k, 1.3% for AGIs $50k-75k, 1.9% for AGIs $75k-100k, 2.4% for AGIs $100k-200k, 3.5% for AGIs over 200k)
Taxes paid: $8,192 (reported on 20.2% of returns)
44906:
$8,192
State:
$9,568
(% of AGI for various income ranges: 1.0% for AGIs below $25k, 1.6% for AGIs $25k-50k, 2.7% for AGIs $50k-75k, 3.8% for AGIs $75k-100k, 5.7% for AGIs $100k-200k, 7.3% for AGIs over 200k)
Earned income credit: $2,290 (reported on 21.3% of returns)
Here:
$2,290
State:
$2,285
(% of AGI for various income ranges: 6.6% for AGIs below $25k, 1.0% for AGIs $25k-50k)
Percentage of individuals using paid preparers for their 2012 taxes: 51.4%
Here:
51%
State:
51%
(% for various income ranges: 45.3% for AGIs below $25k, 52.4% for AGIs $25k-50k, 57.1% for AGIs $50k-75k, 58.8% for AGIs $75k-100k, 65.8% for AGIs $100k-200k, 92.9% for AGIs over 200k)
Averages for the 2004 tax year for zip code 44906, filed in 2005:
Average Adjusted Gross Income (AGI) in 2004: $39,107 (Individual Income Tax Returns)
Here:
$39,107
State:
$44,480
Salary/wage: $33,427 (reported on 84.2% of returns)
Here:
$33,427
State:
$39,198
(% of AGI for various income ranges: 102.8% for AGIs below $10k, 71.6% for AGIs $10k-25k, 81.3% for AGIs $25k-50k, 77.6% for AGIs $50k-75k, 82.3% for AGIs $75k-100k, 55.5% for AGIs over 100k)
Taxable interest for individuals: $1,699 (reported on 41.7% of returns)
This zip code:
$1,699
Ohio:
$1,532
(% of AGI for various income ranges: 5.3% for AGIs below $10k, 2.8% for AGIs $10k-25k, 1.3% for AGIs $25k-50k, 1.4% for AGIs $50k-75k, 1.2% for AGIs $75k-100k, 2.0% for AGIs over 100k)
Taxable dividends: $4,242 (reported on 22.1% of returns)
Here:
$4,242
State:
$3,496
(% of AGI for various income ranges: 3.5% for AGIs below $10k, 1.6% for AGIs $10k-25k, 0.9% for AGIs $25k-50k, 1.8% for AGIs $50k-75k, 1.5% for AGIs $75k-100k, 4.6% for AGIs over 100k)
Net capital gain/loss: +$7,672 (reported on 16.8% of returns)
Here:
+$7,672
State:
+$8,582
(% of AGI for various income ranges: -0.6% for AGIs below $10k, -0.2% for AGIs $10k-25k, 0.8% for AGIs $25k-50k, 1.2% for AGIs $50k-75k, 2.0% for AGIs $75k-100k, 8.7% for AGIs over 100k)
Profit/loss from business: +$12,285 (reported on 11.4% of returns)
Here:
+$12,285
State:
+$10,813
(% of AGI for various income ranges: 5.8% for AGIs below $10k, 3.0% for AGIs $10k-25k, 2.1% for AGIs $25k-50k, 2.5% for AGIs $50k-75k, 2.3% for AGIs $75k-100k, 5.9% for AGIs over 100k)
IRA payment deduction: $3,035 (reported on 1.7% of returns)
44906:
$3,035
Ohio:
$2,794
(% of AGI for various income ranges: 0.2% for AGIs $10k-25k, 0.1% for AGIs $25k-50k, 0.2% for AGIs $50k-75k, 0.2% for AGIs $75k-100k, 0.1% for AGIs over 100k)
Self-employed pension: $15,700 (reported on 0.5% of returns)
Here:
$15,700
Ohio:
$13,981
Total itemized deductions: $16,810 (20% of AGI, reported on 25.6% of returns)
Here:
$16,810
State:
$17,503
Here:
19.7% of AGI
State:
20.8% of AGI
(% of AGI for various income ranges: 12.1% for AGIs below $10k, 6.1% for AGIs $10k-25k, 9.3% for AGIs $25k-50k, 11.4% for AGIs $50k-75k, 13.6% for AGIs $75k-100k, 13.0% for AGIs over 100k)
Charity contributions deductions: $3,545 (4% of AGI, reported on 21.2% of returns)
Here:
$3,545
State:
$3,087
Here:
3.8% of AGI
State:
3.4% of AGI
(% of AGI for various income ranges: 0.7% for AGIs below $10k, 0.8% for AGIs $10k-25k, 1.5% for AGIs $25k-50k, 1.9% for AGIs $50k-75k, 2.2% for AGIs $75k-100k, 2.7% for AGIs over 100k)
Total tax: $6,224 (reported on 72.2% of returns)
44906:
$6,224
State:
$6,781
(% of AGI for various income ranges: 2.9% for AGIs below $10k, 3.7% for AGIs $10k-25k, 7.0% for AGIs $25k-50k, 9.4% for AGIs $50k-75k, 11.0% for AGIs $75k-100k, 20.2% for AGIs over 100k)
Earned income credit: $1,629 (reported on 17.3% of returns)
Here:
$1,629
State:
$1,696
Percentage of individuals using paid preparers for their 2004 taxes: 57.8%
Here:
58%
State:
55%
(% for various income ranges: 49.2% for AGIs below $10k, 57.9% for AGIs $10k-25k, 59.9% for AGIs $25k-50k, 59.7% for AGIs $50k-75k, 60.2% for AGIs $75k-100k, 76.2% for AGIs over 100k)
Likely homosexual households (counted as self-reported same-sex unmarried-partner households)
Lesbian couples: 0.1% of all households
Gay men: 0.0% of all households
Household received Food Stamps/SNAP in the past 12 months: 1,292 Household did not receive Food Stamps/SNAP in the past 12 months: 6,600
Women who had a birth in the past 12 months: 125 (40 now married, 82 unmarried) Women who did not have a birth in the past 12 months: 2,965 (1,406 now married, 1,558 unmarried)
Housing units in zip code 44906 with a mortgage: 2,616 (142 second mortgage, 107 both second mortgage and home equity loan) Houses without a mortgage: 134
Median monthly owner costs for units with a mortgage: $1,095 Median monthly owner costs for units without a mortgage: $450
Residents with income below the poverty level in 2022:
This zip code:
11.7%
Whole state:
13.4%
Residents with income below 50% of the poverty level in 2022:
This zip code:
5.8%
Whole state:
7.0%
Median number of rooms in houses and condos:
Here:
5.9
State:
6.7
Median number of rooms in apartments:
Here:
4.5
State:
4.4
Notable locations in this zip code not listed on our city pages
Notable locations in zip code 44906: Arlin Field Stadium (A), Springmill Drive-In (B), Springfield Township Fire Department (C), Madison Township Fire Department Station 2 (D), Mansfield Fire Department Station 2 (E). Display/hide their locations on the map
Shopping Centers: Richland Mall Shopping Center (1), West Park Shopping Center (2), Kingsgate Mall Shopping Center (3). Display/hide their locations on the map
Churches in zip code 44906 include: Christian Union Church (A), Church of God (B), Linden Road United Presbyterian Church (C), Apostolic Full Gospel Church (D), Empire Church (E), Free Will Baptist Church (F), Gospel Center Church (G), Missionary Baptist Church (H). Display/hide their locations on the map
In group quarters: 343 (-1 institutionalized population)
Size of family households: 2,335 2-persons, 742 3-persons, 626 4-persons, 242 5-persons, 79 6-persons, 28 7-or-more-persons
Size of nonfamily households: 3,031 1-person, 791 2-persons, 36 3-persons
1,639 married couples with children.
914 single-parent households (203 men, 711 women).
95.1% of residents of 44906 zip code speak English at home.
1.2% of residents speak Spanish at home (73% very well, 17% well, 10% not well).
3.2% of residents speak other Indo-European language at home (82% very well, 15% well, 3% not well).
0.5% of residents speak Asian or Pacific Island language at home (89% very well, 11% well).
0.4% of residents speak other language at home (60% very well, 40% well).
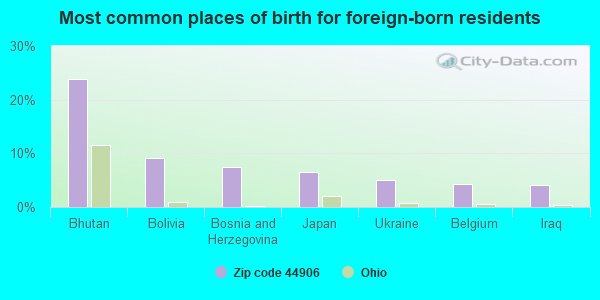
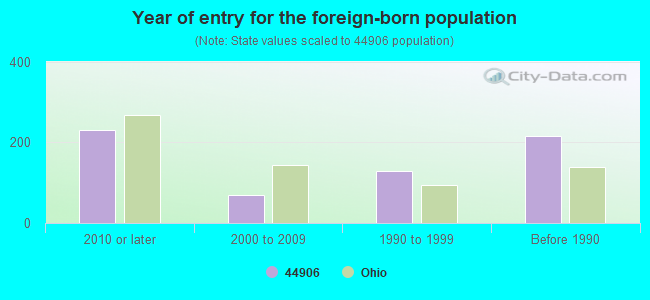
Foreign born population: 620 (3.7%) (55.9% of them are naturalized citizens)
Facilities with environmental interests located in this zip code:
BP AMOCO OIL CORP BULK PLANT ONTARIO (3851 W FOURTH ST in MANSFIELD, OH)
STATE MASTER (Ohio general info) - PCS-OH0122688, National Pollutant Discharge Elimination System Permit, RCRA-OHD000817189, HAZARDOUS WASTE PROGRAM, AIR MAJOR, -70-5171-958-1, EPCRA National Pollutant Discharge Elimination System NON-MAJOR (Tracking pollutant discharge elimination systems) - permit Conditionally Exempt Small Quantity Generators, less than 100 kg/month of hazardous waste (Resource Conservation and Recovery Act (tracking hazardous waste)) - notification Business SIC classification: PETROLEUM AND PETROLEUM PRODUCTS WHOLESALERS, EXCEPT BULK STATIONS AND TERMINALS Organizations: BP OIL COMPANY (CONTACT/OWNER)
, BP EXPLORATION & OIL INC (CONTACT/OWNER)
, BP OIL COMPANY (CONTACT/OWNER)
Alternative names: BP OIL CO, BP OIL CO BULK PLT
BONDED 1099 (1321 PARK AVE W in MANSFIELD, OH)
STATE MASTER (Ohio general info) - RCRA-OHD987006566, HAZARDOUS WASTE PROGRAM, -70-5541-899-1, EPCRA Conditionally Exempt Small Quantity Generators, less than 100 kg/month of hazardous waste (Resource Conservation and Recovery Act (tracking hazardous waste)) - notification Organizations: SPEEDWAY/SUPERAMERICA LLC (CONTACT/OPERATOR)
, SPEEDWAY/SUPERAMERICA (CONTACT/OWNER)
ANLIKER LAURA (350 PARK AVE W in MANSFIELD, OH)
STATE MASTER (Ohio general info) - RCRA-OHR000026096, HAZARDOUS WASTE PROGRAM Conditionally Exempt Small Quantity Generators, less than 100 kg/month of hazardous waste (Resource Conservation and Recovery Act (tracking hazardous waste)) - notification Organizations: LAURA ANLIKER (CONTACT/OWNER)
Alternative names: ANLIKER LAURA RESIDENCE
ASHLAND BRANDED BULK PLANT NO 826 (1012 SPRINGMILL RD in MANSFIELD, OH)
STATE MASTER (Ohio general info) - AIR MAJOR, EPCRA, RCRA-OHD987037421, HAZARDOUS WASTE PROGRAM Small Quantity Generators, between 100 kg and 1000 kg of hazardous waste/month (Resource Conservation and Recovery Act (tracking hazardous waste)) - notification Organizations: ASHLAND BRANDED MARKETING INC (CONTACT/OWNER)
Alternative names: ASHLAND BULK PLANT 826 000
BP OIL CO SITE 05269 (1400 LEXINGTON in MANSFIELD, OH)
STATE MASTER (Ohio general info) - RCRA-OHD987024429, HAZARDOUS WASTE PROGRAM, -70-5541-168-5, EPCRA Conditionally Exempt Small Quantity Generators, less than 100 kg/month of hazardous waste (Resource Conservation and Recovery Act (tracking hazardous waste)) - notification Organizations: BP OIL COMPANY (CONTACT/OWNER)
BP OIL CO SITE 05328 (616 N LEXINGTON in MANSFIELD, OH)
STATE MASTER (Ohio general info) - RCRA-OHD987024379, HAZARDOUS WASTE PROGRAM, -70-5541-905-5, EPCRA Conditionally Exempt Small Quantity Generators, less than 100 kg/month of hazardous waste (Resource Conservation and Recovery Act (tracking hazardous waste)) - notification Organizations: BP OIL COMPANY (CONTACT/OWNER)
BP OIL CO SITE 06515 (1020 NATIONAL PKWY in MANSFIELD, OH)
STATE MASTER (Ohio general info) - AIR MAJOR, EPCRA, RCRA-OHD987027224, HAZARDOUS WASTE PROGRAM Conditionally Exempt Small Quantity Generators, less than 100 kg/month of hazardous waste (Resource Conservation and Recovery Act (tracking hazardous waste)) - notification Organizations: BP OIL COMPANY (CONTACT/OWNER)
Alternative names: BP OIL CO SITE NO 06515
BENDER AND LOUDON MOTOR FREIGHT INC (30 N BEER RD in MANSFIELD, OH)
STATE MASTER (Ohio general info) - RCRA-OHD000804641, HAZARDOUS WASTE PROGRAM TRANSPORTER (Resource Conservation and Recovery Act (tracking hazardous waste))
ADENA CORP (282 N TRIMBLE RD in MANSFIELD, OH)
(Resource Conservation and Recovery Act (tracking hazardous waste)) Organizations: DAVID BUSH (CONTACT/OWNER)
BOTTOM LINE PRO TUNE UP (1095 NATIONAL PKWY in MANSFIELD, OH)
(Resource Conservation and Recovery Act (tracking hazardous waste)) Organizations: JOE MARIETTA (CONTACT/OWNER)
ADENA CORPORATION (1310 W FOURTH ST in MANSFIELD, OH)
Conditionally Exempt Small Quantity Generators, less than 100 kg/month of hazardous waste (Resource Conservation and Recovery Act (tracking hazardous waste))
Housing units lacking complete plumbing facilities: 1.6% Housing units lacking complete kitchen facilities: 3.9%
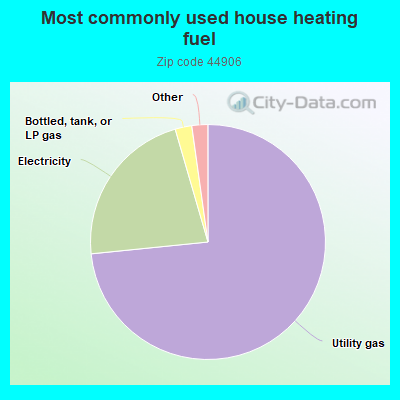
73.4%Utility gas
22.1%Electricity
2.3%Bottled, tank, or LP gas
0.9%No fuel used
0.6%Other fuel
Population in 1990: 16,809. Population change in the 1990s: +1,037 (+6.2%).
Place of birth for U.S.-born residents:
This state: 13,302
Northeast: 556
Midwest: 543
South: 1,503
West: 279
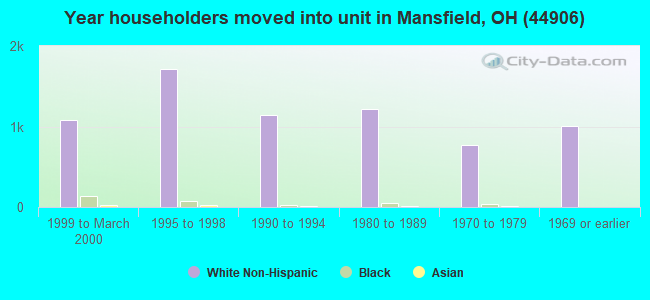
61% of the 44906 zip code residents lived in the same house 5 years ago. Out of people who lived in different houses, 71% lived in this county. Out of people who lived in different counties, 50% lived in Ohio.
89% of the 44906 zip code residents lived in the same house 1 year ago. Out of people who lived in different houses, 48% moved from this county. Out of people who lived in different houses, 32% moved from different county within same state. Out of people who lived in different houses, 16% moved from different state. Out of people who lived in different houses, 5% moved from abroad.
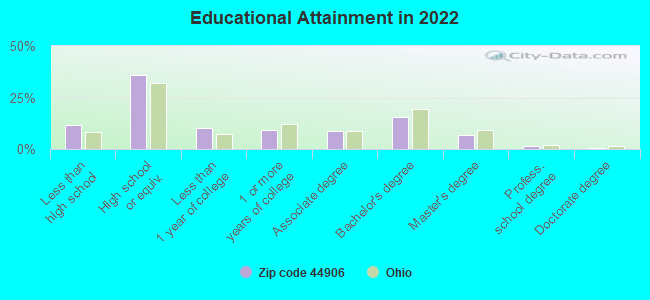
Private vs. public school enrollment:
Students in private schools in grades 1 to 8 (elementary and middle school): 137
Here:
9.8%
Ohio:
16.0%
Students in private schools in grades 9 to 12 (high school): 196
Here:
30.2%
Ohio:
13.1%
Students in private undergraduate colleges: 109
Here:
21.9%
Ohio:
22.3%
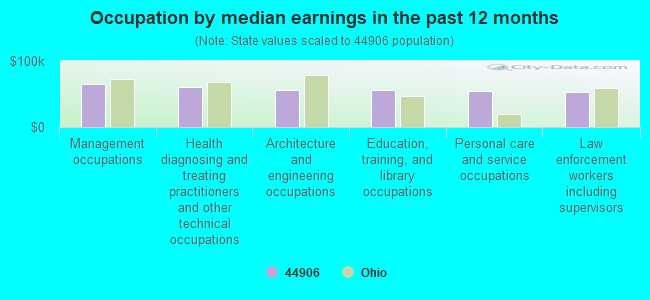
Occupation by median earnings in the past 12 months ($)
64,825Management occupations
60,846Health diagnosing and treating practitioners and other technical occupations
56,231Architecture and engineering occupations
56,195Education, training, and library occupations
54,080Personal care and service occupations
53,215Law enforcement workers including supervisors
Companies with federal contracts located in this zip code (MANSFIELD, OH):
MANSFIELD HOTEL PARTNERSHIP (500 N TRIMBLE RD; small business) : $161,075 in 7 contractsfrom 2001 to 2006
Contracts for Lodging - Hotel/Motel, Lease or Rental of Facilities -- Troop Housing Facilities by Army Signed by year:2000: $0; 2001: $32,130; 2002: $32,130; 2003: $33,480; 2004: $36,745; 2005: $31,860; 2006: -$5,270.
Biggest contracts:
$33,480 with Army for Lodging - Hotel/Motel. Signed on 2004-10-01. Completion date: 2005-09-30.
$33,480, same as above.Signed on 2003-10-17. Completion date: 2004-09-30.
$32,130, same as above.Signed on 2002-10-01. Completion date: 2003-09-30.
$32,130, same as above.Signed on 2001-10-04. Completion date: 2002-09-30.
SPRINGFIELD MOLD & DIE INC (2420 W 4TH ST; small business) : $11,002 in 3 contractsin 2005
$4,482 with Defense Logistics Agency for Aircraft Hydraulic, Vacuum, and De-icing System Components. Signed on 2005-08-30. Completion date: 2005-12-28.
$3,562, same as above.Signed on 2005-01-27. Completion date: 2005-06-01.
$2,958, same as above.Signed on 2005-02-22. Completion date: 2005-07-18.
SIGNALS POWER & GROUNDING SPEC (945 N TRIMBLE RD; small business)
$6,747 with Army for Maintenance, Repair or Alteration of Real Property -- Ammunition Storage Buildings. Signed on 2006-02-23. Completion date: 2006-02-28.
INDUSTRIAL-TECHNICAL SLS & SVC (323 OXFORD AVE; small business)
$5,337 with Army for Miscellaneous Defense Hard Goods -- Management and Support (R&D). Signed on 2003-03-10. Completion date: 2003-05-30.
Top industries in this zip code by the number of employees in 2005:
2002 - 2018 National Fire Incident Reporting System (NFIRS) incidents
Based on the data from the years 2002 - 2018 the average number of fires per year is 74. The highest number of fires - 106 took place in 2014, and the least - 40 in 2002. The data has a growing trend.
When looking into fire subcategories, the most reports belonged to: Structure Fires (43.4%), and Outside Fires (39.9%).
Fire incident types reported to NFIRS in Zip Code 44906

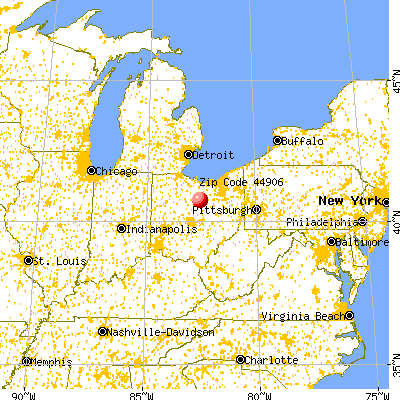


 Nearest zip codes: 44903, 44902, 44907, 44901, 44905, 44904.


 Based on the data from the years 2002 - 2018 the average number of fires per year is 74. The highest number of fires - 106 took place in 2014, and the least - 40 in 2002. The data has a growing trend.
 When looking into fire subcategories, the most reports belonged to: Structure Fires (43.4%), and Outside Fires (39.9%).