The Boulevards (The Blvds.) neighborhood in Mansfield, Ohio (OH), 44906 detailed profile
Settings
X

Business Search - 14 Million verified businesses
Area: 0.106 square miles
Population: 455
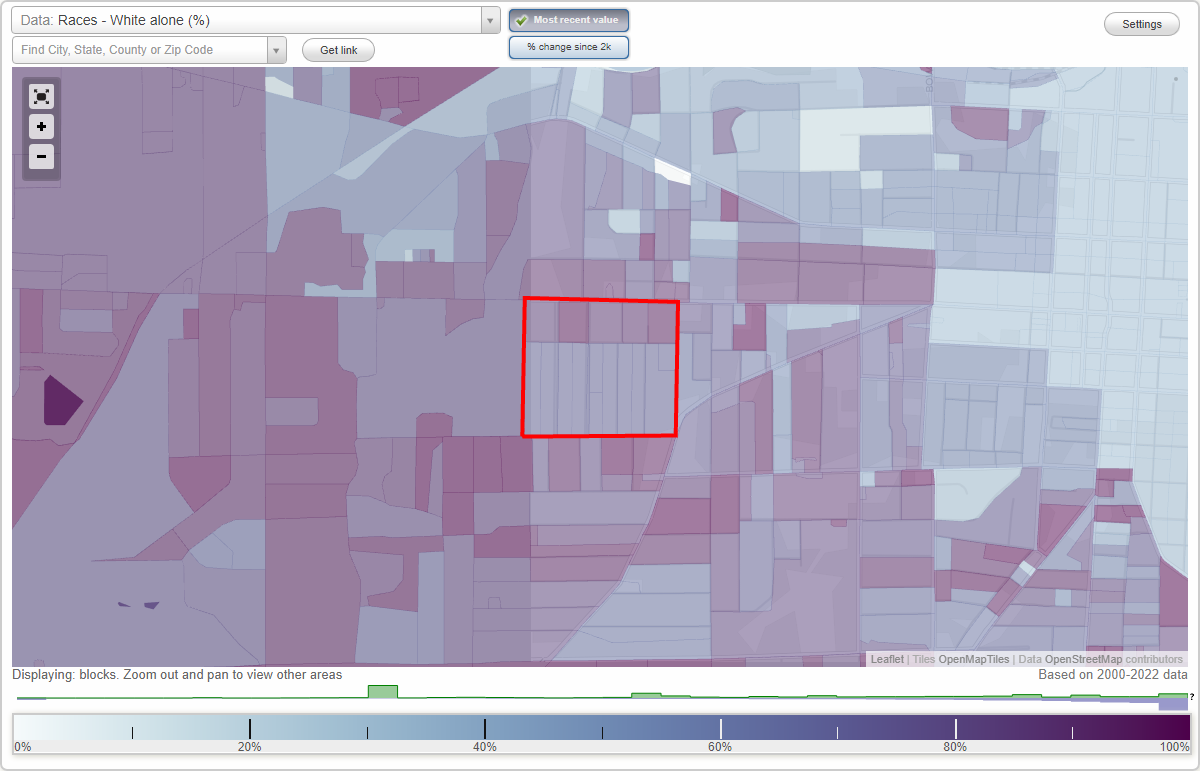
Population density:
| The Boulevards (The Blvds.): | 4,311 people per square mile |
| Mansfield: | 1,593 people per square mile |

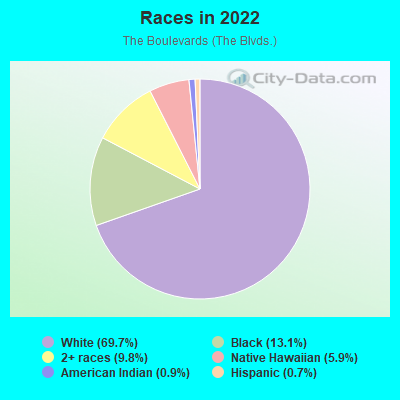
- 31969.7%White
- 6013.1%Black
- 459.8%Two or more races
- 275.9%Native Hawaiian and Other
Pacific Islander - 40.9%American Indian
- 30.7%Hispanic or Latino
Distribution of median household income
![Distribution of median household income]()
- 17Less than $10,000
- 36$10,000 to $19,999
- 14$20,000 to $29,999
- 10$30,000 to $39,999
- 15$40,000 to $49,999
- 23$50,000 to $59,999
- 26$60,000 to $74,999
- 31$75,000 to $99,999
- 4$100,000 to $124,999
- 17$125,000 to $149,999
- 3$150,000 to $199,999
- 6$200,000 or more

Distribution of owner-occupied house/condo value
![Distribution of owner-occupied house/condo value]()
- 32Less than $50,000
- 66$50,000 to $99,999
- 41$100,000 to $149,999
- 5$150,000 to $199,999
- 9$200,000 to $249,999
- 2$250,000 to $299,999
- 1$1,000,000 or more

Distribution of rent paid by renters
![Distribution of rent paid by renters]()
- 32$200 to $299
- 38$300 to $399
- 7$400 to $499
- 9$500 to $599
- 23$600 to $699
- 22$700 to $799
- 14$800 to $899
- 4$900 to $999

Median rent in 2022:
| The Boulevards (The Blvds.): | $514 |
| Mansfield: | $571 |
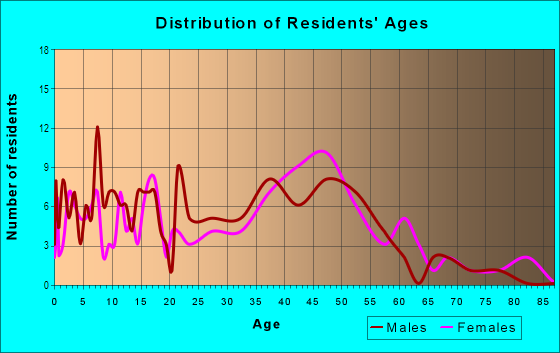
| Males: | 205 |
| Females: | 250 |
Males:
| This neighborhood: | 33.9 years |
| Whole city: | 37.4 years |
| This neighborhood: | 34.4 years |
| Whole city: | 42.1 years |
Average household size:
| The Boulevards (The Blvds.): | 2.6 people |
| Mansfield: | 2.2 people |
Percentage of family households:
| The Boulevards (The Blvds.): | 34.4% |
| Mansfield: | 34.5% |
| Here: | 41.3% |
| Mansfield: | 27.9% |
Percentage of married-couple families with children (among all households):
| The Boulevards (The Blvds.): | 28.4% |
| Mansfield: | 17.4% |
Percentage of single-mother households (among all households):
| The Boulevards (The Blvds.): | 14.4% |
| Mansfield: | 19.2% |
Percentage of never married males 15 years old and over:
Percentage of never married females 15 years old and over:
| The Boulevards (The Blvds.): | 18.1% |
| Mansfield: | 26.3% |
Percentage of never married females 15 years old and over:
| The Boulevards (The Blvds.): | 11.0% |
| city: | 15.9% |
Percentage of people that speak English not well or not at all:
| The Boulevards (The Blvds.): | 0.2% |
| Mansfield: | 0.6% |
Percentage of people born in this state:
Percentage of people born in another U.S. state:
Percentage of native residents but born outside the U.S.:
Percentage of foreign born residents:
| Here: | 70.3% |
| Mansfield: | 77.5% |
Percentage of people born in another U.S. state:
| The Boulevards (The Blvds.): | 27.0% |
| Mansfield: | 20.1% |
Percentage of native residents but born outside the U.S.:
| Here: | 0.5% |
| city: | 0.6% |
Percentage of foreign born residents:
| Here: | 2.1% |
| Mansfield: | 1.8% |
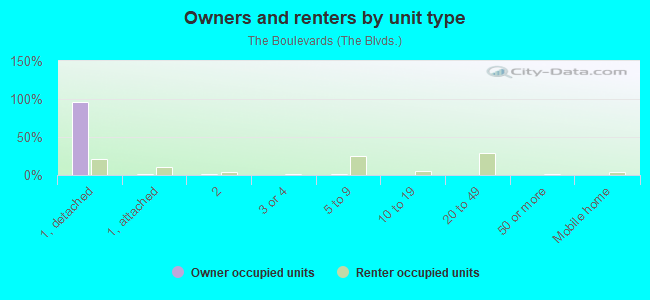
Owner-occupied
Renter-occupied

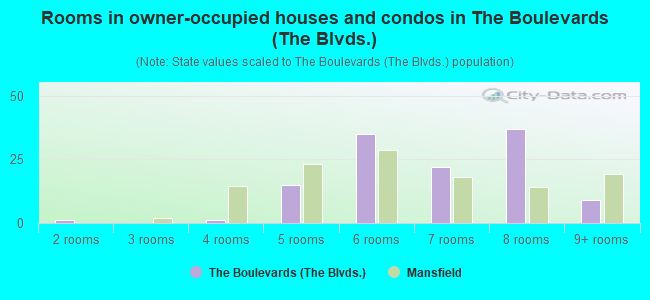
- Rooms in owner-occupied houses and condos in The Boulevards <
> - 01 room
- 12 rooms
- 03 rooms
- 14 rooms
- 155 rooms
- 356 rooms
- 227 rooms
- 378 rooms
- 99+ rooms
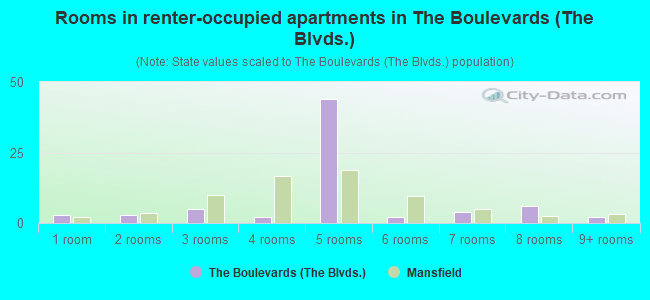
- Rooms in renter-occupied apartments in The Boulevards <
> - 31 room
- 32 rooms
- 53 rooms
- 24 rooms
- 445 rooms
- 26 rooms
- 47 rooms
- 68 rooms
- 29+ rooms
Owner-occupied
Renter-occupied
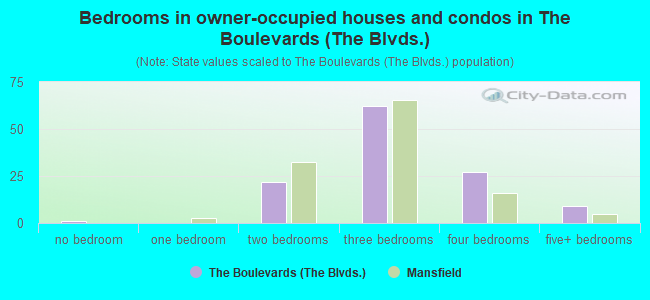
- Bedrooms in owner-occupied houses and condos in The Boulevards <
> - 1no bedroom
- 01 bedroom
- 222 bedrooms
- 623 bedrooms
- 274 bedrooms
- 95+ bedrooms
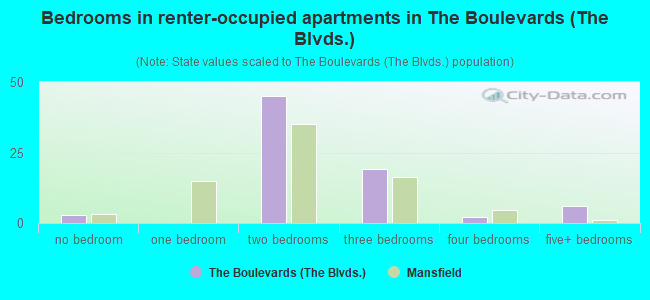
- Bedrooms in renter-occupied apartments in The Boulevards <
> - 3no bedroom
- 01 bedroom
- 452 bedrooms
- 193 bedrooms
- 24 bedrooms
- 65+ bedrooms
Average number of cars or other vehicles available in houses/condos:
Average number of cars or other vehicles available in apartments:
| This neighborhood: | 2.0 |
| Mansfield: | 1.8 |
Average number of cars or other vehicles available in apartments:
| Here: | 1.1 |
| city: | 1.2 |
Percentage of units with a mortgage:
| The Boulevards (The Blvds.): | 71.9% |
| Mansfield: | 53.5% |
Average estimated value of detached houses in 2022 (75.1% of all units):
| The Boulevards (The Blvds.): | $47,268 |
| Mansfield: | $134,529 |
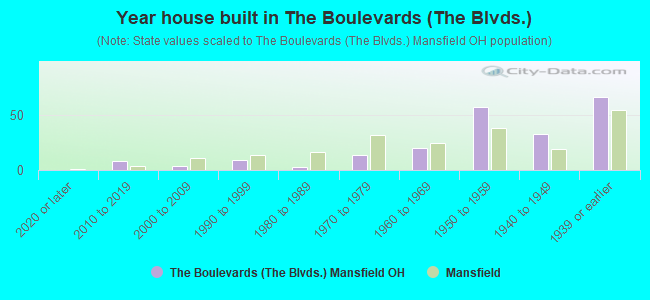
- Year house built in The Boulevards <
> - 02020 or later
- 82010 to 2019
- 42000 to 2009
- 91990 to 1999
- 31980 to 1989
- 141970 to 1979
- 201960 to 1969
- 571950 to 1959
- 331940 to 1949
- 661939 or earlier
City-data.com crime index for city in 2020 (higher means more crime):
| City: | 173.2 |
| U.S. average: | 219.5 |
Travel time to work (commute)
![Travel time to work (commute)]()
- 6Less than 5 minutes
- 125 to 9 minutes
- 5410 to 14 minutes
- 3515 to 19 minutes
- 3020 to 24 minutes
- 1025 to 29 minutes
- 730 to 34 minutes
- 140 to 44 minutes
- 1245 to 59 minutes
- 960 to 89 minutes

Means of transportation to work
![Means of transportation to work]()
- 79.8%157Drove a car alone
- 8.6%17Carpooled
- 1.5%3Walked
- 8.6%17Worked at home

Time leaving home to go to work
![Time leaving home to go to work]()
- 1312:00 a.m. to 4:59 a.m.
- 15:00 a.m. to 5:29 a.m.
- 45:30 a.m. to 5:59 a.m.
- 226:00 a.m. to 6:29 a.m.
- 196:30 a.m. to 6:59 a.m.
- 217:00 a.m. to 7:29 a.m.
- 237:30 a.m. to 7:59 a.m.
- 108:00 a.m. to 8:29 a.m.
- 28:30 a.m. to 8:59 a.m.
- 99:00 a.m. to 9:59 a.m.
- 211:00 a.m. to 11:59 a.m.
- 2312:00 p.m. to 3:59 p.m.
- 214:00 p.m. to 11:59 p.m.

Occupations of males:
- Percentage of males in management occupations (except farmers):
Here: 4.9% city: 7.7%
- Percentage of males in business and financial operations occupations:
Here: 9.2% city: 3.0%
- Percentage of males in architecture and engineering occupations:
Here: 10.5% city: 2.0%
- Percentage of males in education, training, and library occupations:
Here: 6.0% city: 1.8%
- Percentage of males in service occupations:
Here: 5.1% city: 18.3%
- Percentage of males in sales and office occupations:
Here: 20.0% city: 13.6%
- Percentage of males in construction, extraction, and maintenance occupations:
Here: 1.9% city: 4.2%
- Percentage of males in production occupations:
Here: 8.1% city: 14.0%
- Percentage of males in transportation occupations:
Here: 8.0% city: 8.0%
- Percentage of males in material moving occupations:
Here: 12.7% city: 10.4%
Occupations of females:
- Percentage of females in management occupations (except farmers):
Here: 15.1% city: 6.7%
- Percentage of females in business and financial operations occupations:
Here: 5.8% city: 3.1%
- Percentage of females in community and social services occupations:
Here: 26.4% city: 3.5%
- Percentage of females in legal occupations:
Here: 1.9% city: 0.5%
- Percentage of females in education, training, and library occupations:
Here: 9.9% city: 8.8%
- Percentage of females in arts, design, entertainment, sports, and media occupations:
Here: 2.4% city: 0.1%
- Percentage of females in healthcare practitioners and technical occupations:
Here: 6.7% city: 7.1%
- Percentage of females in service occupations:
Here: 9.2% city: 25.9%
- Percentage of females in sales and office occupations:
Here: 22.5% city: 27.3%
Percentage of people 16-64 in Armed Forces:
| The Boulevards (The Blvds.): | 0.2% |
| Mansfield: | 0.0% |
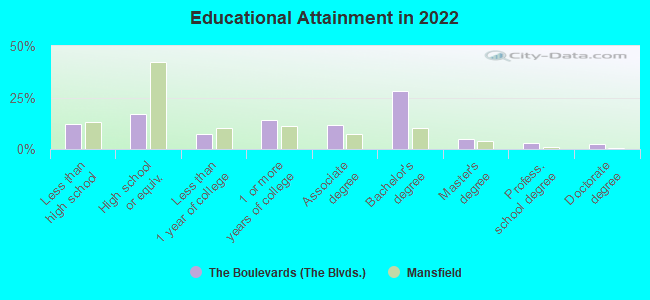
Education in this neighborhood (subdivision or community):
- Percentage of people 3 years and older in K-12 schools:
The Boulevards (The Blvds.): 13.2% Mansfield: 14.3%
- Percentage of people 3 years and older in undergraduate colleges:
The Boulevards (The Blvds.): 7.4% Mansfield: 6.0%
- Percentage of people 3 years and older in grad. or professional schools:
The Boulevards (The Blvds.): 7.7% Mansfield: 0.8%
- Percentage of students K-12 enrolled in private schools:
The Boulevards (The Blvds.): 24.6% Mansfield: 14.1%
Percentage of population below poverty level:
| The Boulevards (The Blvds.): | 20.7% |
| Mansfield: | 25.0% |
Median year renter moved in (as recorded in 2022):
| The Boulevards (The Blvds.): | 2015 |
| Mansfield: | 2016 |
Percentage of married-couple families with both working:
| The Boulevards (The Blvds.): | 77.5% |
| Mansfield: | 69.3% |
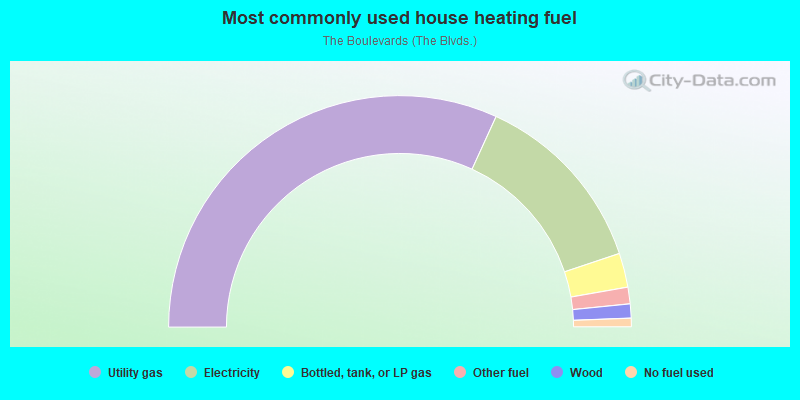
- 63.7%Utility gas
- 26.1%Electricity
- 4.8%Bottled, tank, or LP gas
- 2.3%Other fuel
- 2.0%Wood
- 1.2%No fuel used
Highways in this neighborhood:
State Rte 430 (Park Ave W)
Length: 0.06 miles
Direction: E-W
Address range: 622 to 671
Direction: E-W
Address range: 622 to 671
Roads and streets:
Maple St
Length: 0.45 miles
Direction: E-W
Address range: 500 to 698
Direction: E-W
Address range: 500 to 698
Summit St
Length: 0.40 miles
Direction: E-W
Address range: 501 to 662
Direction: E-W
Address range: 501 to 662
Parkwood Blvd
Length: 0.30 miles
Direction: N-S
Address range: 1 to 170
Direction: N-S
Address range: 1 to 170
Sherman Ave
Length: 0.26 miles
Direction: N-S
Address range: 37 to 156
Direction: N-S
Address range: 37 to 156
Glenwood Blvd
Length: 0.21 miles
Direction: N-S
Address range: 48 to 160
Direction: N-S
Address range: 48 to 160
Stewart Ave
Length: 0.21 miles
Direction: N-S
Address range: 45 to 161
Direction: N-S
Address range: 45 to 161
Dawson Ave
Length: 0.20 miles
Direction: N-S
Address range: 42 to 166
Direction: N-S
Address range: 42 to 166
Summit Ct
Length: 0.03 miles
Direction: N-S
Address range: 1 to 25
Direction: N-S
Address range: 1 to 25