Estimated zip code population in 2022: 13,819 Zip code population in 2010: 13,906 Zip code population in 2000: 13,626
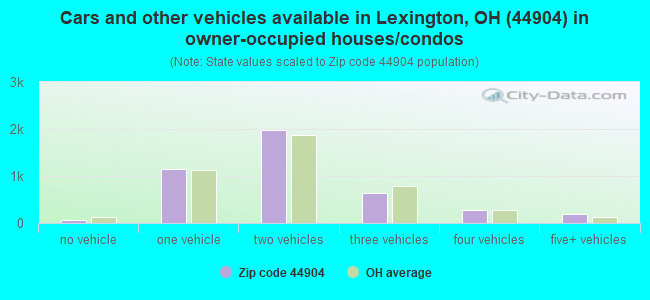
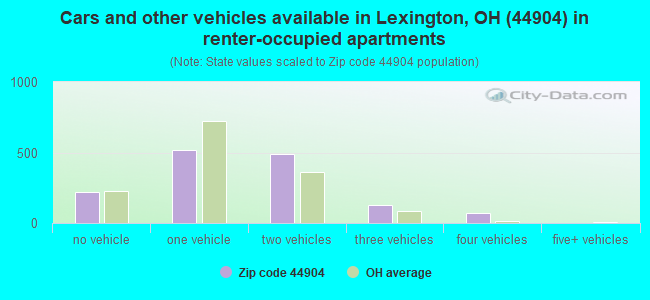
Houses and condos: 5,866 Renter-occupied apartments: 1,441
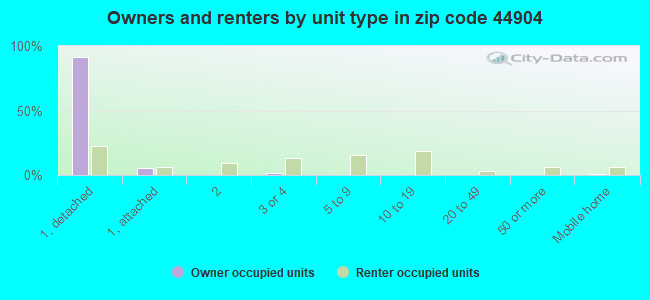
% of renters here:
25%
State:
33%
March 2022 cost of living index in zip code 44904: 90.6 (less than average, U.S. average is 100)
Land area: 51.3 sq. mi. Water area: 0.8 sq. mi.
Population density: 270 people per square mile
(very low).
OSM Map
General Map
Google Map
MSN Map
OSM Map
General Map
Google Map
MSN Map
OSM Map
General Map
Google Map
MSN Map
OSM Map
General Map
Google Map
MSN Map
Please wait while loading the map...
Real estate property taxes paid for housing units in 2022:
This zip code:
1.3% ($2,661)
Ohio:
1.3% ($2,639)
Median real estate property taxes paid for housing units with mortgages in 2022: $2,736 (1.3%) Median real estate property taxes paid for housing units with no mortgage in 2022: $2,553 (1.6%)
Business Search- 14 Million verified businesses
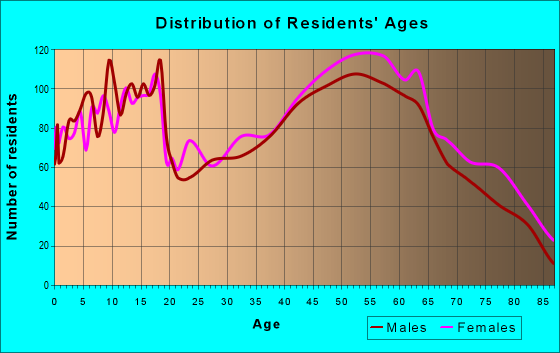
Males: 6,663
(48.2%)
Females: 7,155
(51.8%)
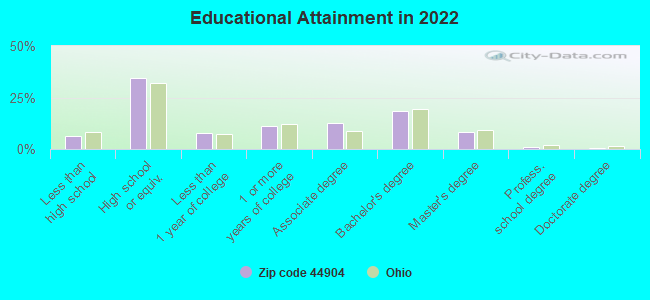
For population 25 years and over in 44904:
High school or higher: 93.4%
Bachelor's degree or higher: 27.8%
Graduate or professional degree: 9.4%
Unemployed: 1.9%
Mean travel time to work (commute): 26.0 minutes
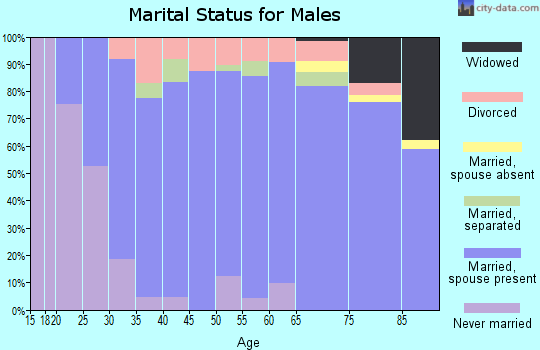
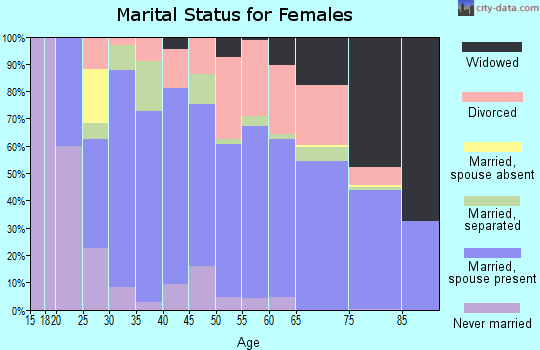
For population 15 years and over in 44904:
Never married: 22.9%
Now married: 58.0%
Separated: 1.3%
Widowed: 6.9%
Divorced: 10.9%
Zip code 44904 compared to state average:
Unemployed percentage below state average.
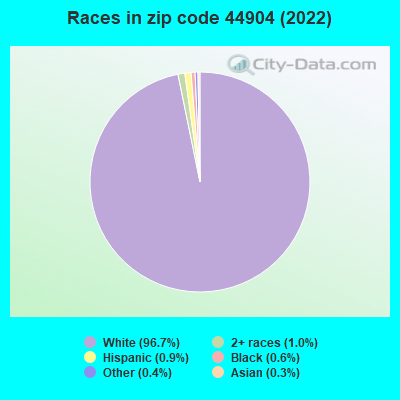
Black race population percentage significantly below state average.
Hispanic race population percentage significantly below state average.
Foreign-born population percentage below state average.
Length of stay since moving in above state average.
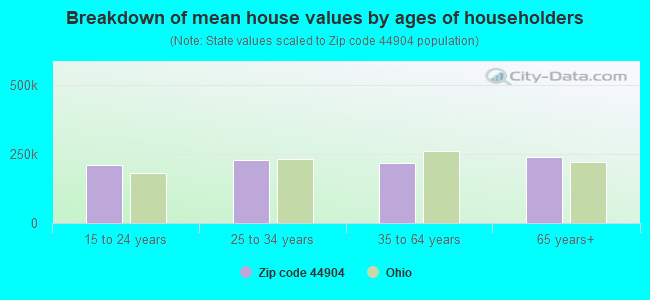
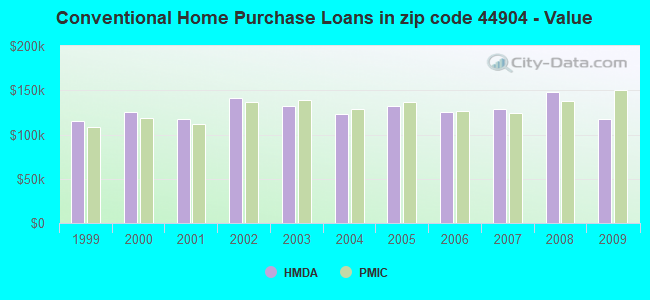
Estimated median house/condo value in 2022: $201,762
44904:
$201,762
Ohio:
$204,100
According to our research of Ohio and other state lists, there were 16 registered sex offenders living in 44904 zip code as of May 07, 2024. The ratio of all residents to sex offenders in zip code 44904 is 847 to 1. The ratio of registered sex offenders to all residents in this zip code is lower than the state average.
Median resident age:
This zip code:
42.2 years
Ohio median age:
39.9 years
Average household size:
This zip code:
2.4 people
Ohio:
2.4 people
Averages for the 2020 tax year for zip code 44904, filed in 2021:
Average Adjusted Gross Income (AGI) in 2020: $62,420 (Individual Income Tax Returns)
Here:
$62,420
State:
$67,288
Salary/wage: $54,020 (reported on 79.0% of returns)
Here:
$54,020
State:
$55,628
(% of AGI for various income ranges: 1066.2% for AGIs below $25k, 3414.1% for AGIs $25k-50k, 5913.7% for AGIs $50k-75k, 9091.4% for AGIs $75k-100k, 15425.5% for AGIs $100k-200k, 61927.1% for AGIs over 200k)
Taxable interest for individuals: $1,206 (reported on 30.1% of returns)
This zip code:
$1,206
Ohio:
$1,518
(% of AGI for various income ranges: 18.5% for AGIs below $25k, 26.4% for AGIs $25k-50k, 25.9% for AGIs $50k-75k, 44.5% for AGIs $75k-100k, 88.5% for AGIs $100k-200k, 1348.6% for AGIs over 200k)
Ordinary dividends: $4,213 (reported on 20.9% of returns)
Here:
$4,213
State:
$7,167
(% of AGI for various income ranges: 28.7% for AGIs below $25k, 47.6% for AGIs $25k-50k, 83.1% for AGIs $50k-75k, 183.2% for AGIs $75k-100k, 258.2% for AGIs $100k-200k, 2694.3% for AGIs over 200k)
Net capital gain/loss in AGI: +$11,343 (reported on 18.3% of returns)
Here:
+$11,343
State:
+$18,919
(% of AGI for various income ranges: 15.9% for AGIs below $25k, 34.9% for AGIs $25k-50k, 102.2% for AGIs $50k-75k, 185.4% for AGIs $75k-100k, 441.5% for AGIs $100k-200k, 13762.9% for AGIs over 200k)
Profit/loss from business: +$12,840 (reported on 13.3% of returns)
Here:
+$12,840
State:
+$13,744
(% of AGI for various income ranges: 95.4% for AGIs below $25k, 107.7% for AGIs $25k-50k, 137.9% for AGIs $50k-75k, 299.1% for AGIs $75k-100k, 648.0% for AGIs $100k-200k, 3378.6% for AGIs over 200k)
Taxable individual retirement arrangement distribution: $17,280 (reported on 13.5% of returns)
44904:
$17,280
Ohio:
$18,876
(% of AGI for various income ranges: 89.8% for AGIs below $25k, 165.1% for AGIs $25k-50k, 326.3% for AGIs $50k-75k, 492.7% for AGIs $75k-100k, 963.5% for AGIs $100k-200k, 2070.0% for AGIs over 200k)
Total itemized deductions: $31,287 (reported on 4.1% of returns)
Here:
$31,287
State:
$33,869
(% of AGI for various income ranges: 69.2% for AGIs $25k-50k, 147.6% for AGIs $50k-75k, 230.4% for AGIs $75k-100k, 471.1% for AGIs $100k-200k, 3888.6% for AGIs over 200k)
Charity contributions: $13,436 (reported on 3.4% of returns)
Here:
$13,436
State:
$14,577
(% of AGI for various income ranges: 7.2% for AGIs below $25k, 28.7% for AGIs $50k-75k, 52.1% for AGIs $75k-100k, 186.3% for AGIs $100k-200k, 2124.3% for AGIs over 200k)
Taxes paid: $6,993 (reported on 4.1% of returns)
44904:
$6,993
State:
$7,681
(% of AGI for various income ranges: 10.4% for AGIs $25k-50k, 30.9% for AGIs $50k-75k, 44.3% for AGIs $75k-100k, 129.8% for AGIs $100k-200k, 827.1% for AGIs over 200k)
Earned income credit: $2,191 (reported on 11.6% of returns)
Here:
$2,191
State:
$2,304
(% of AGI for various income ranges: 69.9% for AGIs below $25k, 56.3% for AGIs $25k-50k, 2.1% for AGIs $50k-75k)
Percentage of individuals using paid preparers for their 2020 taxes: 94.8%
Here:
95%
State:
94%
(% for various income ranges: 93.0% for AGIs below $25k, 95.6% for AGIs $25k-50k, 95.2% for AGIs $50k-75k, 95.2% for AGIs $75k-100k, 95.3% for AGIs $100k-200k, 100.0% for AGIs over 200k)
Averages for the 2012 tax year for zip code 44904, filed in 2013:
Average Adjusted Gross Income (AGI) in 2012: $51,292 (Individual Income Tax Returns)
Here:
$51,292
State:
$54,926
Salary/wage: $43,862 (reported on 83.3% of returns)
Here:
$43,862
State:
$45,869
(% of AGI for various income ranges: 70.8% for AGIs below $25k, 70.8% for AGIs $25k-50k, 73.2% for AGIs $50k-75k, 74.5% for AGIs $75k-100k, 75.4% for AGIs $100k-200k, 51.7% for AGIs over 200k)
Taxable interest for individuals: $949 (reported on 36.4% of returns)
This zip code:
$949
Ohio:
$1,297
(% of AGI for various income ranges: 1.2% for AGIs below $25k, 0.6% for AGIs $25k-50k, 0.7% for AGIs $50k-75k, 0.4% for AGIs $75k-100k, 0.6% for AGIs $100k-200k, 0.7% for AGIs over 200k)
Ordinary dividends: $3,019 (reported on 22.4% of returns)
Here:
$3,019
State:
$5,821
(% of AGI for various income ranges: 1.5% for AGIs below $25k, 1.2% for AGIs $25k-50k, 1.0% for AGIs $50k-75k, 1.2% for AGIs $75k-100k, 1.3% for AGIs $100k-200k, 2.4% for AGIs over 200k)
Net capital gain/loss in AGI: +$4,798 (reported on 17.1% of returns)
Here:
+$4,798
State:
+$11,232
(% of AGI for various income ranges: 0.5% for AGIs $50k-75k, 0.7% for AGIs $75k-100k, 1.3% for AGIs $100k-200k, 10.6% for AGIs over 200k)
Profit/loss from business: +$11,629 (reported on 12.9% of returns)
Here:
+$11,629
State:
+$12,773
(% of AGI for various income ranges: 3.7% for AGIs below $25k, 2.7% for AGIs $25k-50k, 1.9% for AGIs $50k-75k, 1.6% for AGIs $75k-100k, 3.7% for AGIs $100k-200k, 4.9% for AGIs over 200k)
Taxable individual retirement arrangement distribution: $13,703 (reported on 13.8% of returns)
44904:
$13,703
Ohio:
$14,511
(% of AGI for various income ranges: 4.9% for AGIs below $25k, 4.0% for AGIs $25k-50k, 3.9% for AGIs $50k-75k, 3.6% for AGIs $75k-100k, 4.3% for AGIs $100k-200k)
Self-employment retirement plans: $13,533 (reported on 0.4% of returns)
44904:
$13,533
Ohio:
$20,257
(% of AGI for various income ranges: 0.4% for AGIs $100k-200k)
Total itemized deductions: $18,220 (20% of AGI, reported on 30.9% of returns)
Here:
$18,220
State:
$21,278
Here:
20.0% of AGI
State:
18.8% of AGI
(% of AGI for various income ranges: 6.6% for AGIs below $25k, 8.4% for AGIs $25k-50k, 10.0% for AGIs $50k-75k, 12.2% for AGIs $75k-100k, 13.3% for AGIs $100k-200k, 13.0% for AGIs over 200k)
Charity contributions: $4,028 (reported on 24.7% of returns)
Here:
$4,028
State:
$3,943
(% of AGI for various income ranges: 0.7% for AGIs below $25k, 1.3% for AGIs $25k-50k, 1.4% for AGIs $50k-75k, 2.3% for AGIs $75k-100k, 2.4% for AGIs $100k-200k, 3.4% for AGIs over 200k)
Taxes paid: $7,006 (reported on 30.9% of returns)
44904:
$7,006
State:
$9,568
(% of AGI for various income ranges: 1.2% for AGIs below $25k, 2.2% for AGIs $25k-50k, 3.4% for AGIs $50k-75k, 4.5% for AGIs $75k-100k, 6.0% for AGIs $100k-200k, 6.7% for AGIs over 200k)
Earned income credit: $2,085 (reported on 13.1% of returns)
Here:
$2,085
State:
$2,285
(% of AGI for various income ranges: 4.5% for AGIs below $25k, 0.9% for AGIs $25k-50k)
Percentage of individuals using paid preparers for their 2012 taxes: 52.4%
Here:
52%
State:
51%
(% for various income ranges: 47.2% for AGIs below $25k, 54.9% for AGIs $25k-50k, 54.2% for AGIs $50k-75k, 52.9% for AGIs $75k-100k, 56.2% for AGIs $100k-200k, 81.8% for AGIs over 200k)
Averages for the 2004 tax year for zip code 44904, filed in 2005:
Average Adjusted Gross Income (AGI) in 2004: $46,607 (Individual Income Tax Returns)
Here:
$46,607
State:
$44,480
Salary/wage: $42,335 (reported on 86.8% of returns)
Here:
$42,335
State:
$39,198
(% of AGI for various income ranges: 111.6% for AGIs below $10k, 73.7% for AGIs $10k-25k, 79.5% for AGIs $25k-50k, 79.4% for AGIs $50k-75k, 84.7% for AGIs $75k-100k, 74.2% for AGIs over 100k)
Taxable interest for individuals: $1,194 (reported on 52.5% of returns)
This zip code:
$1,194
Ohio:
$1,532
(% of AGI for various income ranges: 6.9% for AGIs below $10k, 2.5% for AGIs $10k-25k, 1.3% for AGIs $25k-50k, 1.0% for AGIs $50k-75k, 0.9% for AGIs $75k-100k, 1.3% for AGIs over 100k)
Taxable dividends: $1,906 (reported on 28.2% of returns)
Here:
$1,906
State:
$3,496
(% of AGI for various income ranges: 5.4% for AGIs below $10k, 1.5% for AGIs $10k-25k, 0.8% for AGIs $25k-50k, 1.2% for AGIs $50k-75k, 0.7% for AGIs $75k-100k, 1.3% for AGIs over 100k)
Net capital gain/loss: +$2,991 (reported on 21.8% of returns)
Here:
+$2,991
State:
+$8,582
(% of AGI for various income ranges: -2.5% for AGIs below $10k, -0.0% for AGIs $10k-25k, 0.5% for AGIs $25k-50k, 0.7% for AGIs $50k-75k, 1.1% for AGIs $75k-100k, 3.2% for AGIs over 100k)
Profit/loss from business: +$9,381 (reported on 13.7% of returns)
Here:
+$9,381
State:
+$10,813
(% of AGI for various income ranges: 0.1% for AGIs below $10k, 3.1% for AGIs $10k-25k, 2.7% for AGIs $25k-50k, 2.4% for AGIs $50k-75k, 2.4% for AGIs $75k-100k, 3.3% for AGIs over 100k)
IRA payment deduction: $3,110 (reported on 2.6% of returns)
44904:
$3,110
Ohio:
$2,794
(% of AGI for various income ranges: 0.3% for AGIs $10k-25k, 0.2% for AGIs $25k-50k, 0.2% for AGIs $50k-75k, 0.1% for AGIs $75k-100k, 0.1% for AGIs over 100k)
Self-employed pension: $10,205 (reported on 0.6% of returns)
Here:
$10,205
Ohio:
$13,981
Total itemized deductions: $16,666 (21% of AGI, reported on 38.6% of returns)
Here:
$16,666
State:
$17,503
Here:
20.9% of AGI
State:
20.8% of AGI
(% of AGI for various income ranges: 14.1% for AGIs below $10k, 7.9% for AGIs $10k-25k, 11.4% for AGIs $25k-50k, 14.6% for AGIs $50k-75k, 15.5% for AGIs $75k-100k, 15.2% for AGIs over 100k)
Charity contributions deductions: $3,139 (4% of AGI, reported on 33.1% of returns)
Here:
$3,139
State:
$3,087
Here:
3.8% of AGI
State:
3.4% of AGI
(% of AGI for various income ranges: 0.5% for AGIs below $10k, 0.9% for AGIs $10k-25k, 1.5% for AGIs $25k-50k, 2.2% for AGIs $50k-75k, 2.5% for AGIs $75k-100k, 2.9% for AGIs over 100k)
Total tax: $6,523 (reported on 78.5% of returns)
44904:
$6,523
State:
$6,781
(% of AGI for various income ranges: 3.2% for AGIs below $10k, 4.1% for AGIs $10k-25k, 7.2% for AGIs $25k-50k, 8.9% for AGIs $50k-75k, 10.5% for AGIs $75k-100k, 17.2% for AGIs over 100k)
Earned income credit: $1,525 (reported on 9.2% of returns)
Here:
$1,525
State:
$1,696
Percentage of individuals using paid preparers for their 2004 taxes: 54.6%
Here:
55%
State:
55%
(% for various income ranges: 45.3% for AGIs below $10k, 55.1% for AGIs $10k-25k, 57.8% for AGIs $25k-50k, 55.7% for AGIs $50k-75k, 55.0% for AGIs $75k-100k, 61.9% for AGIs over 100k)
Likely homosexual households (counted as self-reported same-sex unmarried-partner households)
Lesbian couples: 0.0% of all households
Gay men: 0.0% of all households
Household received Food Stamps/SNAP in the past 12 months: 639 Household did not receive Food Stamps/SNAP in the past 12 months: 5,097
Women who had a birth in the past 12 months: 97 (100 now married, 0 unmarried) Women who did not have a birth in the past 12 months: 2,860 (1,418 now married, 1,441 unmarried)
Housing units in zip code 44904 with a mortgage: 2,857 (265 second mortgage, 10 home equity loan, 217 both second mortgage and home equity loan) Houses without a mortgage: 128
Median monthly owner costs for units with a mortgage: $1,270 Median monthly owner costs for units without a mortgage: $511
Residents with income below the poverty level in 2022:
This zip code:
13.0%
Whole state:
13.4%
Residents with income below 50% of the poverty level in 2022:
This zip code:
5.4%
Whole state:
7.0%
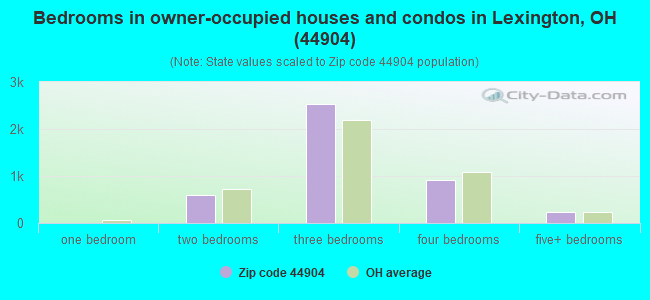
Median number of rooms in houses and condos:
Here:
6.7
State:
6.7
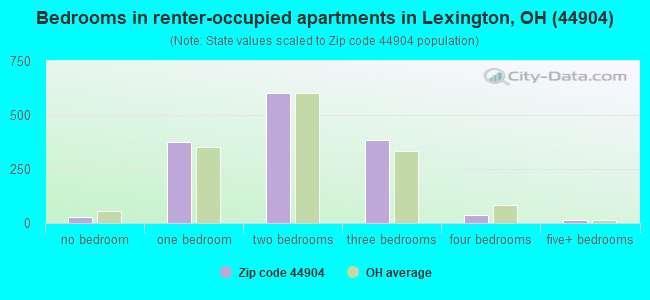
Median number of rooms in apartments:
Here:
4.4
State:
4.4
Notable locations in this zip code not listed on our city pages
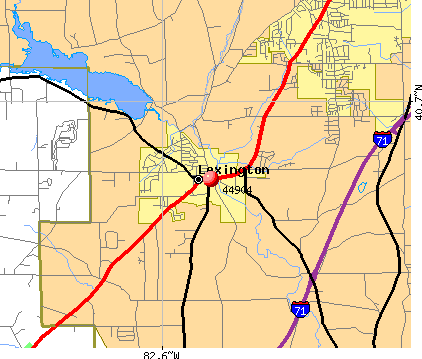
Notable locations in zip code 44904: Mansfield Water Treatment Plant (A), Mid-Ohio Race Course (B), Blueberry Patch Greenhouse (C), Mid - Ohio Sports Car Course Fire Station (D), Troy Township Fire Department (E), Washington Township Fire Department (F). Display/hide their locations on the map
Churches in zip code 44904 include: Hilltop Church (A), Apostolic Christian Church (B), Church of the Cross United Methodist Church (C), Lexington Church of Christ (D), First Congregational Church (E), First Church of the Nazarene (F), Lexington United Presbyterian Church (G). Display/hide their locations on the map
Cemeteries: Shauck Cemetery (1), Day Cemetery (2), Troy Cemetery (3), Walters Cemetery (4), Haldeman Cemetery (5), Lexington Cemetery (6), German Evangelical Cemetery (7). Display/hide their locations on the map
1,902 married couples with children.
715 single-parent households (69 men, 646 women).
96.8% of residents of 44904 zip code speak English at home.
0.9% of residents speak Spanish at home (54% very well, 46% well).
2.0% of residents speak other Indo-European language at home (67% very well, 8% well, 25% not well).
0.1% of residents speak other language at home (100% very well).
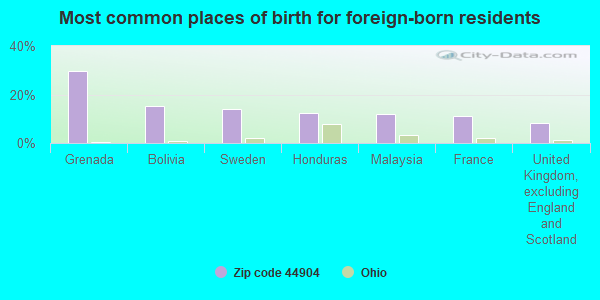
Foreign born population: 310 (2.2%) (48.8% of them are naturalized citizens)
Facilities with environmental interests located in this zip code:
CENTRAL ELEMENTARY SCHOOL (124 FREDERICK ST in LEXINGTON, OH)
(National Center for Education Statistics) - STATE ID-005496 Organizations: LEXINGTON LOCAL SD (SCHOOL DISTRICT)
CERTIFIED OIL CO (35 W MAIN ST in LEXINGTON, OH)
(Resource Conservation and Recovery Act (tracking hazardous waste))
BP OIL CO SITE 05189 (356 E MAIN in LEXINGTON, OH)
(Resource Conservation and Recovery Act (tracking hazardous waste)) Organizations: BP OIL COMPANY (CONTACT/OWNER)
Housing units lacking complete plumbing facilities: 0.5% Housing units lacking complete kitchen facilities: 0.1%
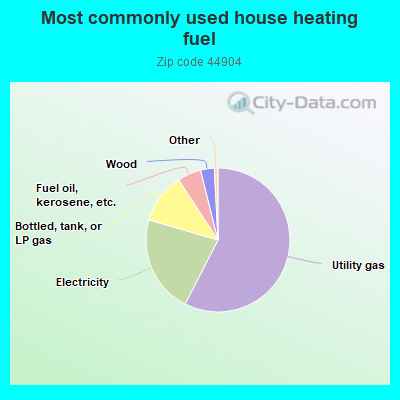
57.6%Utility gas
22.0%Electricity
11.3%Bottled, tank, or LP gas
5.3%Fuel oil, kerosene, etc.
3.1%Wood
Population in 1990: 12,466. Population change in the 1990s: +1,160 (+9.3%).
Place of birth for U.S.-born residents:
This state: 10,746
Northeast: 415
Midwest: 822
South: 1,093
West: 400
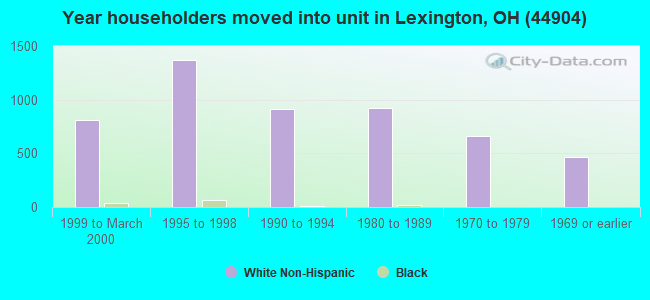
59% of the 44904 zip code residents lived in the same house 5 years ago. Out of people who lived in different houses, 60% lived in this county. Out of people who lived in different counties, 50% lived in Ohio.
92% of the 44904 zip code residents lived in the same house 1 year ago. Out of people who lived in different houses, 54% moved from this county. Out of people who lived in different houses, 23% moved from different county within same state. Out of people who lived in different houses, 24% moved from different state.
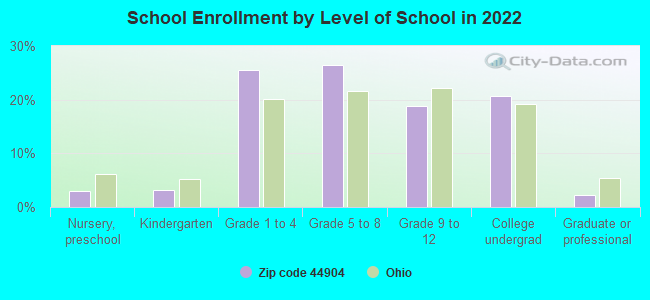
Private vs. public school enrollment:
Students in private schools in grades 1 to 8 (elementary and middle school): 233
Here:
14.4%
Ohio:
16.0%
Students in private schools in grades 9 to 12 (high school): 116
Here:
19.5%
Ohio:
13.1%
Students in private undergraduate colleges: 226
Here:
34.7%
Ohio:
22.3%
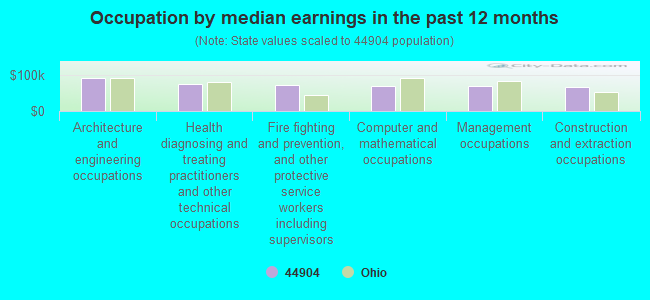
Occupation by median earnings in the past 12 months ($)
91,912Architecture and engineering occupations
76,935Health diagnosing and treating practitioners and other technical occupations
74,335Fire fighting and prevention, and other protective service workers including supervisors
70,774Computer and mathematical occupations
70,128Management occupations
67,899Construction and extraction occupations
Companies with federal contracts located in this zip code:
CONTACT INDUSTRIES, INC (25 LEX-INDUSTRIAL DRIVE in LEXINGTON, OH; small business) : $740,209 in 43 contractsfrom 2003 to 2006
Contracts for Electrical Control Equipment, Relays and Solenoids by Defense Logistics Agency, Army Signed by year:2000: $0; 2001: $0; 2002: $0; 2003: $82,602; 2004: $187,430; 2005: $382,236; 2006: $87,941.
Biggest contracts:
$69,808 with Defense Logistics Agency for Electrical Control Equipment. Signed on 2005-04-20. Completion date: 2005-07-15.
$65,573, same as above.Signed on 2004-02-27. Completion date: 2004-04-27.
$42,795, same as above.Signed on 2005-11-25. Completion date: 2006-01-16.
$42,795, same as above.Signed on 2005-10-28. Completion date: 2005-12-19.
J & B ACOUSTICAL INC (2750 LEXINGTON AVE in MANSFIELD, OH; small business) : $25,984 in 4 contractsin 2005
$8,218 with Army for Construction of Structures and Facilities -- Office Buildings. Signed on 2005-09-06. Completion date: 2005-09-30.
$8,218 with U.S. Army Corps of Engineers - civil program financing only for Construction of Structures and Facilities -- Office Buildings. Signed on 2005-09-06. Completion date: 2005-09-30.
$4,774 with U.S. Army Corps of Engineers - civil program financing only for Construction of Structures and Facilities -- Restoration of real property. Signed on 2005-09-15. Completion date: 2005-09-16.
$4,774 with Army for Construction of Structures and Facilities -- Restoration of real property. Signed on 2005-09-15. Completion date: 2005-09-16.
KLOPFENSTEIN ART EQUIPMENT, IN (25 WALNUT ST in MANSFIELD, OH; small business)
$3,158 with Army for Clay and Concrete Products Industries Machinery. Signed on 2004-09-29. Completion date: 2004-10-29.
Top industries in this zip code by the number of employees in 2005:
2002 - 2018 National Fire Incident Reporting System (NFIRS) incidents
Based on the data from the years 2002 - 2018 the average number of fires per year is 60. The highest number of fires - 83 took place in 2012, and the least - 43 in 2011. The data has a growing trend.
When looking into fire subcategories, the most reports belonged to: Structure Fires (54.7%), and Outside Fires (32.1%).
Fire incident types reported to NFIRS in Zip Code 44904
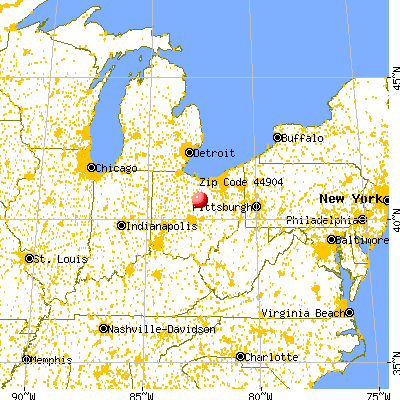


 Nearest zip codes: 44813, 44906, 44907, 44902, 44903, 44901.
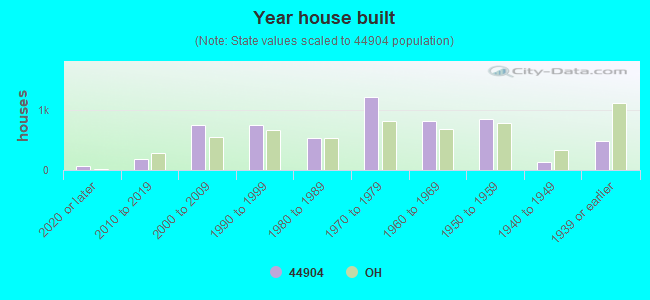


 Based on the data from the years 2002 - 2018 the average number of fires per year is 60. The highest number of fires - 83 took place in 2012, and the least - 43 in 2011. The data has a growing trend.
 When looking into fire subcategories, the most reports belonged to: Structure Fires (54.7%), and Outside Fires (32.1%).