Estimated zip code population in 2022: 15,139
Zip code population in 2010: 14,313
Zip code population in 2000: 15,194
Houses and condos: 7,793
Renter-occupied apartments: 3,313
% of renters here:
45%State:
33%
March 2022 cost of living index in zip code 44907: 90.4
(less than average, U.S. average is 100)
Land area: 7.8
sq. mi.
Water area: 0.0
sq. mi.
Population density: 1,944 people per square mile (low).
OSM Map
General Map
Google Map
MSN Map
OSM Map
General Map
Google Map
MSN Map
OSM Map
General Map
Google Map
MSN Map
OSM Map
General Map
Google Map
MSN Map
Please wait while loading the map...
Real estate property taxes paid for housing units in 2022:
This zip code:
1.4% ($1,769)Ohio:
1.3% ($2,639)
Median real estate property taxes paid for housing units with mortgages in 2022: $1,939 (1.5%)
Median real estate property taxes paid for housing units with no mortgage in 2022: $1,640 (1.3%)
Profiles of local businesses
Business Search - 14 Million verified businesses
Males: 7,206 Females: 7,932
For population 25 years and over in 44907:
High school or higher: 92.5%Bachelor's degree or higher: 19.7%Graduate or professional degree: 8.8%Unemployed: 3.2%Mean travel time to work (commute): 23.1 minutes
For population 15 years and over in 44907:
Never married: 34.8%Now married: 36.4%Separated: 2.3%Widowed: 8.8%Divorced: 17.7%
Zip code 44907 compared to state average:
Median household income below state average. Median house value below state average. Hispanic race population percentage below state average. Foreign-born population percentage below state average. Length of stay since moving in significantly above state average. Percentage of population with a bachelor's degree or higher below state average. 11,584 76.5% White 2,043 13.5% Black 837 5.5% Two or more races 285 1.9% Hispanic or Latino 231 1.5% Asian 127 0.8% Some other race 14 0.09% American Indian 12 0.08% Native Hawaiian and Other
Data:
Median household income ($)
Median household income (% change since 2000)
Household income diversity
Ratio of average income to average house value (%)
Ratio of average income to average rent
Median household income ($) - White
Median household income ($) - Black or African American
Median household income ($) - Asian
Median household income ($) - Hispanic or Latino
Median household income ($) - American Indian and Alaska Native
Median household income ($) - Multirace
Median household income ($) - Other Race
Median household income for houses/condos with a mortgage ($)
Median household income for apartments without a mortgage ($)
Races - White alone (%)
Races - White alone (% change since 2000)
Races - Black alone (%)
Races - Black alone (% change since 2000)
Races - American Indian alone (%)
Races - American Indian alone (% change since 2000)
Races - Asian alone (%)
Races - Asian alone (% change since 2000)
Races - Hispanic (%)
Races - Hispanic (% change since 2000)
Races - Native Hawaiian and Other Pacific Islander alone (%)
Races - Native Hawaiian and Other Pacific Islander alone (% change since 2000)
Races - Two or more races (%)
Races - Two or more races (% change since 2000)
Races - Other race alone (%)
Races - Other race alone (% change since 2000)
Racial diversity
Unemployment (%)
Unemployment (% change since 2000)
Unemployment (%) - White
Unemployment (%) - Black or African American
Unemployment (%) - Asian
Unemployment (%) - Hispanic or Latino
Unemployment (%) - American Indian and Alaska Native
Unemployment (%) - Multirace
Unemployment (%) - Other Race
Population density (people per square mile)
Population - Males (%)
Population - Females (%)
Population - Males (%) - White
Population - Males (%) - Black or African American
Population - Males (%) - Asian
Population - Males (%) - Hispanic or Latino
Population - Males (%) - American Indian and Alaska Native
Population - Males (%) - Multirace
Population - Males (%) - Other Race
Population - Females (%) - White
Population - Females (%) - Black or African American
Population - Females (%) - Asian
Population - Females (%) - Hispanic or Latino
Population - Females (%) - American Indian and Alaska Native
Population - Females (%) - Multirace
Population - Females (%) - Other Race
Coronavirus confirmed cases (Apr 27, 2024)
Deaths caused by coronavirus (Apr 27, 2024)
Coronavirus confirmed cases (per 100k population) (Apr 27, 2024)
Deaths caused by coronavirus (per 100k population) (Apr 27, 2024)
Daily increase in number of cases (Apr 27, 2024)
Weekly increase in number of cases (Apr 27, 2024)
Cases doubled (in days) (Apr 27, 2024)
Hospitalized patients (Apr 18, 2022)
Negative test results (Apr 18, 2022)
Total test results (Apr 18, 2022)
COVID Vaccine doses distributed (per 100k population) (Sep 19, 2023)
COVID Vaccine doses administered (per 100k population) (Sep 19, 2023)
COVID Vaccine doses distributed (Sep 19, 2023)
COVID Vaccine doses administered (Sep 19, 2023)
Likely homosexual households (%)
Likely homosexual households (% change since 2000)
Likely homosexual households - Lesbian couples (%)
Likely homosexual households - Lesbian couples (% change since 2000)
Likely homosexual households - Gay men (%)
Likely homosexual households - Gay men (% change since 2000)
Cost of living index
Median gross rent ($)
Median contract rent ($)
Median monthly housing costs ($)
Median house or condo value ($)
Median house or condo value ($ change since 2000)
Mean house or condo value by units in structure - 1, detached ($)
Mean house or condo value by units in structure - 1, attached ($)
Mean house or condo value by units in structure - 2 ($)
Mean house or condo value by units in structure by units in structure - 3 or 4 ($)
Mean house or condo value by units in structure - 5 or more ($)
Mean house or condo value by units in structure - Boat, RV, van, etc. ($)
Mean house or condo value by units in structure - Mobile home ($)
Median house or condo value ($) - White
Median house or condo value ($) - Black or African American
Median house or condo value ($) - Asian
Median house or condo value ($) - Hispanic or Latino
Median house or condo value ($) - American Indian and Alaska Native
Median house or condo value ($) - Multirace
Median house or condo value ($) - Other Race
Median resident age
Resident age diversity
Median resident age - Males
Median resident age - Females
Median resident age - White
Median resident age - Black or African American
Median resident age - Asian
Median resident age - Hispanic or Latino
Median resident age - American Indian and Alaska Native
Median resident age - Multirace
Median resident age - Other Race
Median resident age - Males - White
Median resident age - Males - Black or African American
Median resident age - Males - Asian
Median resident age - Males - Hispanic or Latino
Median resident age - Males - American Indian and Alaska Native
Median resident age - Males - Multirace
Median resident age - Males - Other Race
Median resident age - Females - White
Median resident age - Females - Black or African American
Median resident age - Females - Asian
Median resident age - Females - Hispanic or Latino
Median resident age - Females - American Indian and Alaska Native
Median resident age - Females - Multirace
Median resident age - Females - Other Race
Commute - mean travel time to work (minutes)
Travel time to work - Less than 5 minutes (%)
Travel time to work - Less than 5 minutes (% change since 2000)
Travel time to work - 5 to 9 minutes (%)
Travel time to work - 5 to 9 minutes (% change since 2000)
Travel time to work - 10 to 19 minutes (%)
Travel time to work - 10 to 19 minutes (% change since 2000)
Travel time to work - 20 to 29 minutes (%)
Travel time to work - 20 to 29 minutes (% change since 2000)
Travel time to work - 30 to 39 minutes (%)
Travel time to work - 30 to 39 minutes (% change since 2000)
Travel time to work - 40 to 59 minutes (%)
Travel time to work - 40 to 59 minutes (% change since 2000)
Travel time to work - 60 to 89 minutes (%)
Travel time to work - 60 to 89 minutes (% change since 2000)
Travel time to work - 90 or more minutes (%)
Travel time to work - 90 or more minutes (% change since 2000)
Marital status - Never married (%)
Marital status - Now married (%)
Marital status - Separated (%)
Marital status - Widowed (%)
Marital status - Divorced (%)
Median family income ($)
Median family income (% change since 2000)
Median non-family income ($)
Median non-family income (% change since 2000)
Median per capita income ($)
Median per capita income (% change since 2000)
Median family income ($) - White
Median family income ($) - Black or African American
Median family income ($) - Asian
Median family income ($) - Hispanic or Latino
Median family income ($) - American Indian and Alaska Native
Median family income ($) - Multirace
Median family income ($) - Other Race
Median year house/condo built
Median year apartment built
Year house built - Built 2005 or later (%)
Year house built - Built 2000 to 2004 (%)
Year house built - Built 1990 to 1999 (%)
Year house built - Built 1980 to 1989 (%)
Year house built - Built 1970 to 1979 (%)
Year house built - Built 1960 to 1969 (%)
Year house built - Built 1950 to 1959 (%)
Year house built - Built 1940 to 1949 (%)
Year house built - Built 1939 or earlier (%)
Average household size
Household density (households per square mile)
Average household size - White
Average household size - Black or African American
Average household size - Asian
Average household size - Hispanic or Latino
Average household size - American Indian and Alaska Native
Average household size - Multirace
Average household size - Other Race
Occupied housing units (%)
Vacant housing units (%)
Owner occupied housing units (%)
Renter occupied housing units (%)
Vacancy status - For rent (%)
Vacancy status - For sale only (%)
Vacancy status - Rented or sold, not occupied (%)
Vacancy status - For seasonal, recreational, or occasional use (%)
Vacancy status - For migrant workers (%)
Vacancy status - Other vacant (%)
Residents with income below the poverty level (%)
Residents with income below 50% of the poverty level (%)
Children below poverty level (%)
Poor families by family type - Married-couple family (%)
Poor families by family type - Male, no wife present (%)
Poor families by family type - Female, no husband present (%)
Poverty status for native-born residents (%)
Poverty status for foreign-born residents (%)
Poverty among high school graduates not in families (%)
Poverty among people who did not graduate high school not in families (%)
Residents with income below the poverty level (%) - White
Residents with income below the poverty level (%) - Black or African American
Residents with income below the poverty level (%) - Asian
Residents with income below the poverty level (%) - Hispanic or Latino
Residents with income below the poverty level (%) - American Indian and Alaska Native
Residents with income below the poverty level (%) - Multirace
Residents with income below the poverty level (%) - Other Race
Air pollution - Air Quality Index (AQI)
Air pollution - CO
Air pollution - NO2
Air pollution - SO2
Air pollution - Ozone
Air pollution - PM10
Air pollution - PM25
Air pollution - Pb
Crime - Murders per 100,000 population
Crime - Rapes per 100,000 population
Crime - Robberies per 100,000 population
Crime - Assaults per 100,000 population
Crime - Burglaries per 100,000 population
Crime - Thefts per 100,000 population
Crime - Auto thefts per 100,000 population
Crime - Arson per 100,000 population
Crime - City-data.com crime index
Crime - Violent crime index
Crime - Property crime index
Crime - Murders per 100,000 population (5 year average)
Crime - Rapes per 100,000 population (5 year average)
Crime - Robberies per 100,000 population (5 year average)
Crime - Assaults per 100,000 population (5 year average)
Crime - Burglaries per 100,000 population (5 year average)
Crime - Thefts per 100,000 population (5 year average)
Crime - Auto thefts per 100,000 population (5 year average)
Crime - Arson per 100,000 population (5 year average)
Crime - City-data.com crime index (5 year average)
Crime - Violent crime index (5 year average)
Crime - Property crime index (5 year average)
1996 Presidential Elections Results (%) - Democratic Party (Clinton)
1996 Presidential Elections Results (%) - Republican Party (Dole)
1996 Presidential Elections Results (%) - Other
2000 Presidential Elections Results (%) - Democratic Party (Gore)
2000 Presidential Elections Results (%) - Republican Party (Bush)
2000 Presidential Elections Results (%) - Other
2004 Presidential Elections Results (%) - Democratic Party (Kerry)
2004 Presidential Elections Results (%) - Republican Party (Bush)
2004 Presidential Elections Results (%) - Other
2008 Presidential Elections Results (%) - Democratic Party (Obama)
2008 Presidential Elections Results (%) - Republican Party (McCain)
2008 Presidential Elections Results (%) - Other
2012 Presidential Elections Results (%) - Democratic Party (Obama)
2012 Presidential Elections Results (%) - Republican Party (Romney)
2012 Presidential Elections Results (%) - Other
2016 Presidential Elections Results (%) - Democratic Party (Clinton)
2016 Presidential Elections Results (%) - Republican Party (Trump)
2016 Presidential Elections Results (%) - Other
2020 Presidential Elections Results (%) - Democratic Party (Biden)
2020 Presidential Elections Results (%) - Republican Party (Trump)
2020 Presidential Elections Results (%) - Other
Ancestries Reported - Arab (%)
Ancestries Reported - Czech (%)
Ancestries Reported - Danish (%)
Ancestries Reported - Dutch (%)
Ancestries Reported - English (%)
Ancestries Reported - French (%)
Ancestries Reported - French Canadian (%)
Ancestries Reported - German (%)
Ancestries Reported - Greek (%)
Ancestries Reported - Hungarian (%)
Ancestries Reported - Irish (%)
Ancestries Reported - Italian (%)
Ancestries Reported - Lithuanian (%)
Ancestries Reported - Norwegian (%)
Ancestries Reported - Polish (%)
Ancestries Reported - Portuguese (%)
Ancestries Reported - Russian (%)
Ancestries Reported - Scotch-Irish (%)
Ancestries Reported - Scottish (%)
Ancestries Reported - Slovak (%)
Ancestries Reported - Subsaharan African (%)
Ancestries Reported - Swedish (%)
Ancestries Reported - Swiss (%)
Ancestries Reported - Ukrainian (%)
Ancestries Reported - United States (%)
Ancestries Reported - Welsh (%)
Ancestries Reported - West Indian (%)
Ancestries Reported - Other (%)
Educational Attainment - No schooling completed (%)
Educational Attainment - Less than high school (%)
Educational Attainment - High school or equivalent (%)
Educational Attainment - Less than 1 year of college (%)
Educational Attainment - 1 or more years of college (%)
Educational Attainment - Associate degree (%)
Educational Attainment - Bachelor's degree (%)
Educational Attainment - Master's degree (%)
Educational Attainment - Professional school degree (%)
Educational Attainment - Doctorate degree (%)
School Enrollment - Nursery, preschool (%)
School Enrollment - Kindergarten (%)
School Enrollment - Grade 1 to 4 (%)
School Enrollment - Grade 5 to 8 (%)
School Enrollment - Grade 9 to 12 (%)
School Enrollment - College undergrad (%)
School Enrollment - Graduate or professional (%)
School Enrollment - Not enrolled in school (%)
School enrollment - Public schools (%)
School enrollment - Private schools (%)
School enrollment - Not enrolled (%)
Median number of rooms in houses and condos
Median number of rooms in apartments
Housing units lacking complete plumbing facilities (%)
Housing units lacking complete kitchen facilities (%)
Density of houses
Urban houses (%)
Rural houses (%)
Households with people 60 years and over (%)
Households with people 65 years and over (%)
Households with people 75 years and over (%)
Households with one or more nonrelatives (%)
Households with no nonrelatives (%)
Population in households (%)
Family households (%)
Nonfamily households (%)
Population in families (%)
Family households with own children (%)
Median number of bedrooms in owner occupied houses
Mean number of bedrooms in owner occupied houses
Median number of bedrooms in renter occupied houses
Mean number of bedrooms in renter occupied houses
Median number of vehichles in owner occupied houses
Mean number of vehichles in owner occupied houses
Median number of vehichles in renter occupied houses
Mean number of vehichles in renter occupied houses
Mortgage status - with mortgage (%)
Mortgage status - with second mortgage (%)
Mortgage status - with home equity loan (%)
Mortgage status - with both second mortgage and home equity loan (%)
Mortgage status - without a mortgage (%)
Average family size
Average family size - White
Average family size - Black or African American
Average family size - Asian
Average family size - Hispanic or Latino
Average family size - American Indian and Alaska Native
Average family size - Multirace
Average family size - Other Race
Geographical mobility - Same house 1 year ago (%)
Geographical mobility - Moved within same county (%)
Geographical mobility - Moved from different county within same state (%)
Geographical mobility - Moved from different state (%)
Geographical mobility - Moved from abroad (%)
Place of birth - Born in state of residence (%)
Place of birth - Born in other state (%)
Place of birth - Native, outside of US (%)
Place of birth - Foreign born (%)
Housing units in structures - 1, detached (%)
Housing units in structures - 1, attached (%)
Housing units in structures - 2 (%)
Housing units in structures - 3 or 4 (%)
Housing units in structures - 5 to 9 (%)
Housing units in structures - 10 to 19 (%)
Housing units in structures - 20 to 49 (%)
Housing units in structures - 50 or more (%)
Housing units in structures - Mobile home (%)
Housing units in structures - Boat, RV, van, etc. (%)
House/condo owner moved in on average (years ago)
Renter moved in on average (years ago)
Year householder moved into unit - Moved in 1999 to March 2000 (%)
Year householder moved into unit - Moved in 1995 to 1998 (%)
Year householder moved into unit - Moved in 1990 to 1994 (%)
Year householder moved into unit - Moved in 1980 to 1989 (%)
Year householder moved into unit - Moved in 1970 to 1979 (%)
Year householder moved into unit - Moved in 1969 or earlier (%)
Means of transportation to work - Drove car alone (%)
Means of transportation to work - Carpooled (%)
Means of transportation to work - Public transportation (%)
Means of transportation to work - Bus or trolley bus (%)
Means of transportation to work - Streetcar or trolley car (%)
Means of transportation to work - Subway or elevated (%)
Means of transportation to work - Railroad (%)
Means of transportation to work - Ferryboat (%)
Means of transportation to work - Taxicab (%)
Means of transportation to work - Motorcycle (%)
Means of transportation to work - Bicycle (%)
Means of transportation to work - Walked (%)
Means of transportation to work - Other means (%)
Working at home (%)
Industry diversity
Most Common Industries - Agriculture, forestry, fishing and hunting, and mining (%)
Most Common Industries - Agriculture, forestry, fishing and hunting (%)
Most Common Industries - Mining, quarrying, and oil and gas extraction (%)
Most Common Industries - Construction (%)
Most Common Industries - Manufacturing (%)
Most Common Industries - Wholesale trade (%)
Most Common Industries - Retail trade (%)
Most Common Industries - Transportation and warehousing, and utilities (%)
Most Common Industries - Transportation and warehousing (%)
Most Common Industries - Utilities (%)
Most Common Industries - Information (%)
Most Common Industries - Finance and insurance, and real estate and rental and leasing (%)
Most Common Industries - Finance and insurance (%)
Most Common Industries - Real estate and rental and leasing (%)
Most Common Industries - Professional, scientific, and management, and administrative and waste management services (%)
Most Common Industries - Professional, scientific, and technical services (%)
Most Common Industries - Management of companies and enterprises (%)
Most Common Industries - Administrative and support and waste management services (%)
Most Common Industries - Educational services, and health care and social assistance (%)
Most Common Industries - Educational services (%)
Most Common Industries - Health care and social assistance (%)
Most Common Industries - Arts, entertainment, and recreation, and accommodation and food services (%)
Most Common Industries - Arts, entertainment, and recreation (%)
Most Common Industries - Accommodation and food services (%)
Most Common Industries - Other services, except public administration (%)
Most Common Industries - Public administration (%)
Occupation diversity
Most Common Occupations - Management, business, science, and arts occupations (%)
Most Common Occupations - Management, business, and financial occupations (%)
Most Common Occupations - Management occupations (%)
Most Common Occupations - Business and financial operations occupations (%)
Most Common Occupations - Computer, engineering, and science occupations (%)
Most Common Occupations - Computer and mathematical occupations (%)
Most Common Occupations - Architecture and engineering occupations (%)
Most Common Occupations - Life, physical, and social science occupations (%)
Most Common Occupations - Education, legal, community service, arts, and media occupations (%)
Most Common Occupations - Community and social service occupations (%)
Most Common Occupations - Legal occupations (%)
Most Common Occupations - Education, training, and library occupations (%)
Most Common Occupations - Arts, design, entertainment, sports, and media occupations (%)
Most Common Occupations - Healthcare practitioners and technical occupations (%)
Most Common Occupations - Health diagnosing and treating practitioners and other technical occupations (%)
Most Common Occupations - Health technologists and technicians (%)
Most Common Occupations - Service occupations (%)
Most Common Occupations - Healthcare support occupations (%)
Most Common Occupations - Protective service occupations (%)
Most Common Occupations - Fire fighting and prevention, and other protective service workers including supervisors (%)
Most Common Occupations - Law enforcement workers including supervisors (%)
Most Common Occupations - Food preparation and serving related occupations (%)
Most Common Occupations - Building and grounds cleaning and maintenance occupations (%)
Most Common Occupations - Personal care and service occupations (%)
Most Common Occupations - Sales and office occupations (%)
Most Common Occupations - Sales and related occupations (%)
Most Common Occupations - Office and administrative support occupations (%)
Most Common Occupations - Natural resources, construction, and maintenance occupations (%)
Most Common Occupations - Farming, fishing, and forestry occupations (%)
Most Common Occupations - Construction and extraction occupations (%)
Most Common Occupations - Installation, maintenance, and repair occupations (%)
Most Common Occupations - Production, transportation, and material moving occupations (%)
Most Common Occupations - Production occupations (%)
Most Common Occupations - Transportation occupations (%)
Most Common Occupations - Material moving occupations (%)
People in Group quarters - Institutionalized population (%)
People in Group quarters - Correctional institutions (%)
People in Group quarters - Federal prisons and detention centers (%)
People in Group quarters - Halfway houses (%)
People in Group quarters - Local jails and other confinement facilities (including police lockups) (%)
People in Group quarters - Military disciplinary barracks (%)
People in Group quarters - State prisons (%)
People in Group quarters - Other types of correctional institutions (%)
People in Group quarters - Nursing homes (%)
People in Group quarters - Hospitals/wards, hospices, and schools for the handicapped (%)
People in Group quarters - Hospitals/wards and hospices for chronically ill (%)
People in Group quarters - Hospices or homes for chronically ill (%)
People in Group quarters - Military hospitals or wards for chronically ill (%)
People in Group quarters - Other hospitals or wards for chronically ill (%)
People in Group quarters - Hospitals or wards for drug/alcohol abuse (%)
People in Group quarters - Mental (Psychiatric) hospitals or wards (%)
People in Group quarters - Schools, hospitals, or wards for the mentally retarded (%)
People in Group quarters - Schools, hospitals, or wards for the physically handicapped (%)
People in Group quarters - Institutions for the deaf (%)
People in Group quarters - Institutions for the blind (%)
People in Group quarters - Orthopedic wards and institutions for the physically handicapped (%)
People in Group quarters - Wards in general hospitals for patients who have no usual home elsewhere (%)
People in Group quarters - Wards in military hospitals for patients who have no usual home elsewhere (%)
People in Group quarters - Juvenile institutions (%)
People in Group quarters - Long-term care (%)
People in Group quarters - Homes for abused, dependent, and neglected children (%)
People in Group quarters - Residential treatment centers for emotionally disturbed children (%)
People in Group quarters - Training schools for juvenile delinquents (%)
People in Group quarters - Short-term care, detention or diagnostic centers for delinquent children (%)
People in Group quarters - Type of juvenile institution unknown (%)
People in Group quarters - Noninstitutionalized population (%)
People in Group quarters - College dormitories (includes college quarters off campus) (%)
People in Group quarters - Military quarters (%)
People in Group quarters - On base (%)
People in Group quarters - Barracks, unaccompanied personnel housing (UPH), (Enlisted/Officer), ;and similar group living quarters for military personnel (%)
People in Group quarters - Transient quarters for temporary residents (%)
People in Group quarters - Military ships (%)
People in Group quarters - Group homes (%)
People in Group quarters - Homes or halfway houses for drug/alcohol abuse (%)
People in Group quarters - Homes for the mentally ill (%)
People in Group quarters - Homes for the mentally retarded (%)
People in Group quarters - Homes for the physically handicapped (%)
People in Group quarters - Other group homes (%)
People in Group quarters - Religious group quarters (%)
People in Group quarters - Dormitories (%)
People in Group quarters - Agriculture workers' dormitories on farms (%)
People in Group quarters - Job Corps and vocational training facilities (%)
People in Group quarters - Other workers' dormitories (%)
People in Group quarters - Crews of maritime vessels (%)
People in Group quarters - Other nonhousehold living situations (%)
People in Group quarters - Other noninstitutional group quarters (%)
Residents speaking English at home (%)
Residents speaking English at home - Born in the United States (%)
Residents speaking English at home - Native, born elsewhere (%)
Residents speaking English at home - Foreign born (%)
Residents speaking Spanish at home (%)
Residents speaking Spanish at home - Born in the United States (%)
Residents speaking Spanish at home - Native, born elsewhere (%)
Residents speaking Spanish at home - Foreign born (%)
Residents speaking other language at home (%)
Residents speaking other language at home - Born in the United States (%)
Residents speaking other language at home - Native, born elsewhere (%)
Residents speaking other language at home - Foreign born (%)
Class of Workers - Employee of private company (%)
Class of Workers - Self-employed in own incorporated business (%)
Class of Workers - Private not-for-profit wage and salary workers (%)
Class of Workers - Local government workers (%)
Class of Workers - State government workers (%)
Class of Workers - Federal government workers (%)
Class of Workers - Self-employed workers in own not incorporated business and Unpaid family workers (%)
House heating fuel used in houses and condos - Utility gas (%)
House heating fuel used in houses and condos - Bottled, tank, or LP gas (%)
House heating fuel used in houses and condos - Electricity (%)
House heating fuel used in houses and condos - Fuel oil, kerosene, etc. (%)
House heating fuel used in houses and condos - Coal or coke (%)
House heating fuel used in houses and condos - Wood (%)
House heating fuel used in houses and condos - Solar energy (%)
House heating fuel used in houses and condos - Other fuel (%)
House heating fuel used in houses and condos - No fuel used (%)
House heating fuel used in apartments - Utility gas (%)
House heating fuel used in apartments - Bottled, tank, or LP gas (%)
House heating fuel used in apartments - Electricity (%)
House heating fuel used in apartments - Fuel oil, kerosene, etc. (%)
House heating fuel used in apartments - Coal or coke (%)
House heating fuel used in apartments - Wood (%)
House heating fuel used in apartments - Solar energy (%)
House heating fuel used in apartments - Other fuel (%)
House heating fuel used in apartments - No fuel used (%)
Armed forces status - In Armed Forces (%)
Armed forces status - Civilian (%)
Armed forces status - Civilian - Veteran (%)
Armed forces status - Civilian - Nonveteran (%)
Fatal accidents locations in years 2005-2021
Fatal accidents locations in 2005
Fatal accidents locations in 2006
Fatal accidents locations in 2007
Fatal accidents locations in 2008
Fatal accidents locations in 2009
Fatal accidents locations in 2010
Fatal accidents locations in 2011
Fatal accidents locations in 2012
Fatal accidents locations in 2013
Fatal accidents locations in 2014
Fatal accidents locations in 2015
Fatal accidents locations in 2016
Fatal accidents locations in 2017
Fatal accidents locations in 2018
Fatal accidents locations in 2019
Fatal accidents locations in 2020
Fatal accidents locations in 2021
Alcohol use - People drinking some alcohol every month (%)
Alcohol use - People not drinking at all (%)
Alcohol use - Average days/month drinking alcohol
Alcohol use - Average drinks/week
Alcohol use - Average days/year people drink much
Audiometry - Average condition of hearing (%)
Audiometry - People that can hear a whisper from across a quiet room (%)
Audiometry - People that can hear normal voice from across a quiet room (%)
Audiometry - Ears ringing, roaring, buzzing (%)
Audiometry - Had a job exposure to loud noise (%)
Audiometry - Had off-work exposure to loud noise (%)
Blood Pressure & Cholesterol - Has high blood pressure (%)
Blood Pressure & Cholesterol - Checking blood pressure at home (%)
Blood Pressure & Cholesterol - Frequently checking blood cholesterol (%)
Blood Pressure & Cholesterol - Has high cholesterol level (%)
Consumer Behavior - Money monthly spent on food at supermarket/grocery store
Consumer Behavior - Money monthly spent on food at other stores
Consumer Behavior - Money monthly spent on eating out
Consumer Behavior - Money monthly spent on carryout/delivered foods
Consumer Behavior - Income spent on food at supermarket/grocery store (%)
Consumer Behavior - Income spent on food at other stores (%)
Consumer Behavior - Income spent on eating out (%)
Consumer Behavior - Income spent on carryout/delivered foods (%)
Current Health Status - General health condition (%)
Current Health Status - Blood donors (%)
Current Health Status - Has blood ever tested for HIV virus (%)
Current Health Status - Left-handed people (%)
Dermatology - People using sunscreen (%)
Diabetes - Diabetics (%)
Diabetes - Had a blood test for high blood sugar (%)
Diabetes - People taking insulin (%)
Diet Behavior & Nutrition - Diet health (%)
Diet Behavior & Nutrition - Milk product consumption (# of products/month)
Diet Behavior & Nutrition - Meals not home prepared (#/week)
Diet Behavior & Nutrition - Meals from fast food or pizza place (#/week)
Diet Behavior & Nutrition - Ready-to-eat foods (#/month)
Diet Behavior & Nutrition - Frozen meals/pizza (#/month)
Drug Use - People that ever used marijuana or hashish (%)
Drug Use - Ever used hard drugs (%)
Drug Use - Ever used any form of cocaine (%)
Drug Use - Ever used heroin (%)
Drug Use - Ever used methamphetamine (%)
Health Insurance - People covered by health insurance (%)
Kidney Conditions-Urology - Avg. # of times urinating at night
Medical Conditions - People with asthma (%)
Medical Conditions - People with anemia (%)
Medical Conditions - People with psoriasis (%)
Medical Conditions - People with overweight (%)
Medical Conditions - Elderly people having difficulties in thinking or remembering (%)
Medical Conditions - People who ever received blood transfusion (%)
Medical Conditions - People having trouble seeing even with glass/contacts (%)
Medical Conditions - People with arthritis (%)
Medical Conditions - People with gout (%)
Medical Conditions - People with congestive heart failure (%)
Medical Conditions - People with coronary heart disease (%)
Medical Conditions - People with angina pectoris (%)
Medical Conditions - People who ever had heart attack (%)
Medical Conditions - People who ever had stroke (%)
Medical Conditions - People with emphysema (%)
Medical Conditions - People with thyroid problem (%)
Medical Conditions - People with chronic bronchitis (%)
Medical Conditions - People with any liver condition (%)
Medical Conditions - People who ever had cancer or malignancy (%)
Mental Health - People who have little interest in doing things (%)
Mental Health - People feeling down, depressed, or hopeless (%)
Mental Health - People who have trouble sleeping or sleeping too much (%)
Mental Health - People feeling tired or having little energy (%)
Mental Health - People with poor appetite or overeating (%)
Mental Health - People feeling bad about themself (%)
Mental Health - People who have trouble concentrating on things (%)
Mental Health - People moving or speaking slowly or too fast (%)
Mental Health - People having thoughts they would be better off dead (%)
Oral Health - Average years since last visit a dentist
Oral Health - People embarrassed because of mouth (%)
Oral Health - People with gum disease (%)
Oral Health - General health of teeth and gums (%)
Oral Health - Average days a week using dental floss/device
Oral Health - Average days a week using mouthwash for dental problem
Oral Health - Average number of teeth
Pesticide Use - Households using pesticides to control insects (%)
Pesticide Use - Households using pesticides to kill weeds (%)
Physical Activity - People doing vigorous-intensity work activities (%)
Physical Activity - People doing moderate-intensity work activities (%)
Physical Activity - People walking or bicycling (%)
Physical Activity - People doing vigorous-intensity recreational activities (%)
Physical Activity - People doing moderate-intensity recreational activities (%)
Physical Activity - Average hours a day doing sedentary activities
Physical Activity - Average hours a day watching TV or videos
Physical Activity - Average hours a day using computer
Physical Functioning - People having limitations keeping them from working (%)
Physical Functioning - People limited in amount of work they can do (%)
Physical Functioning - People that need special equipment to walk (%)
Physical Functioning - People experiencing confusion/memory problems (%)
Physical Functioning - People requiring special healthcare equipment (%)
Prescription Medications - Average number of prescription medicines taking
Preventive Aspirin Use - Adults 40+ taking low-dose aspirin (%)
Reproductive Health - Vaginal deliveries (%)
Reproductive Health - Cesarean deliveries (%)
Reproductive Health - Deliveries resulted in a live birth (%)
Reproductive Health - Pregnancies resulted in a delivery (%)
Reproductive Health - Women breastfeeding newborns (%)
Reproductive Health - Women that had a hysterectomy (%)
Reproductive Health - Women that had both ovaries removed (%)
Reproductive Health - Women that have ever taken birth control pills (%)
Reproductive Health - Women taking birth control pills (%)
Reproductive Health - Women that have ever used Depo-Provera or injectables (%)
Reproductive Health - Women that have ever used female hormones (%)
Sexual Behavior - People 18+ that ever had sex (vaginal, anal, or oral) (%)
Sexual Behavior - Males 18+ that ever had vaginal sex with a woman (%)
Sexual Behavior - Males 18+ that ever performed oral sex on a woman (%)
Sexual Behavior - Males 18+ that ever had anal sex with a woman (%)
Sexual Behavior - Males 18+ that ever had any sex with a man (%)
Sexual Behavior - Females 18+ that ever had vaginal sex with a man (%)
Sexual Behavior - Females 18+ that ever performed oral sex on a man (%)
Sexual Behavior - Females 18+ that ever had anal sex with a man (%)
Sexual Behavior - Females 18+ that ever had any kind of sex with a woman (%)
Sexual Behavior - Average age people first had sex
Sexual Behavior - Average number of female sex partners in lifetime (males 18+)
Sexual Behavior - Average number of female vaginal sex partners in lifetime (males 18+)
Sexual Behavior - Average age people first performed oral sex on a woman (18+)
Sexual Behavior - Average number of woman performed oral sex on in lifetime (18+)
Sexual Behavior - Average number of male sex partners in lifetime (males 18+)
Sexual Behavior - Average number of male anal sex partners in lifetime (males 18+)
Sexual Behavior - Average age people first performed oral sex on a man (18+)
Sexual Behavior - Average number of male oral sex partners in lifetime (18+)
Sexual Behavior - People using protection when performing oral sex (%)
Sexual Behavior - Average number of times people have vaginal or anal sex a year
Sexual Behavior - People having sex without condom (%)
Sexual Behavior - Average number of male sex partners in lifetime (females 18+)
Sexual Behavior - Average number of male vaginal sex partners in lifetime (females 18+)
Sexual Behavior - Average number of female sex partners in lifetime (females 18+)
Sexual Behavior - Circumcised males 18+ (%)
Sleep Disorders - Average hours sleeping at night
Sleep Disorders - People that has trouble sleeping (%)
Smoking-Cigarette Use - People smoking cigarettes (%)
Taste & Smell - People 40+ having problems with smell (%)
Taste & Smell - People 40+ having problems with taste (%)
Taste & Smell - People 40+ that ever had wisdom teeth removed (%)
Taste & Smell - People 40+ that ever had tonsils teeth removed (%)
Taste & Smell - People 40+ that ever had a loss of consciousness because of a head injury (%)
Taste & Smell - People 40+ that ever had a broken nose or other serious injury to face or skull (%)
Taste & Smell - People 40+ that ever had two or more sinus infections (%)
Weight - Average height (inches)
Weight - Average weight (pounds)
Weight - Average BMI
Weight - People that are obese (%)
Weight - People that ever were obese (%)
Weight - People trying to lose weight (%)
Urban population: 15,044
Rural population: 94
Estimated median house/condo value in 2022: $128,718
44907:
$128,718Ohio:
$204,100
Median resident age: This zip code:
42.3 yearsOhio median age:
39.9 years
Average household size: This zip code:
2.0 peopleOhio:
2.4 people
Averages for the 2020 tax year for zip code 44907, filed in 2021:
Average Adjusted Gross Income (AGI) in 2020: $44,525 (Individual Income Tax Returns) Here:
$44,525State:
$67,288
Salary/wage: $37,753 (reported on 81.3% of returns )Here:
$37,753State:
$55,628
(% of AGI for various income ranges: 1053.4% for AGIs below $25k , 3406.3% for AGIs $25k-50k , 5981.2% for AGIs $50k-75k , 9318.4% for AGIs $75k-100k , 15193.1% for AGIs $100k-200k , 61440.0% for AGIs over 200k ) Taxable interest for individuals: $1,015 (reported on 19.9% of returns )This zip code:
$1,015Ohio:
$1,518
(% of AGI for various income ranges: 11.8% for AGIs below $25k , 12.5% for AGIs $25k-50k , 25.2% for AGIs $50k-75k , 77.4% for AGIs $75k-100k , 147.3% for AGIs $100k-200k , 546.7% for AGIs over 200k ) Ordinary dividends: $5,640 (reported on 13.3% of returns )(% of AGI for various income ranges: 20.3% for AGIs below $25k , 24.8% for AGIs $25k-50k , 61.7% for AGIs $50k-75k , 166.1% for AGIs $75k-100k , 610.8% for AGIs $100k-200k , 6690.0% for AGIs over 200k ) Net capital gain/loss in AGI: +$8,130 (reported on 11.5% of returns )Here:
+$8,130State:
+$18,919
(% of AGI for various income ranges: 4.1% for AGIs below $25k , 15.6% for AGIs $25k-50k , 75.6% for AGIs $50k-75k , 279.0% for AGIs $75k-100k , 795.8% for AGIs $100k-200k , 9993.3% for AGIs over 200k ) Profit/loss from business: +$9,106 (reported on 10.3% of returns )Here:
+$9,106State:
+$13,744
(% of AGI for various income ranges: 62.9% for AGIs below $25k , 50.2% for AGIs $25k-50k , 129.8% for AGIs $50k-75k , 233.2% for AGIs $75k-100k , 723.5% for AGIs $100k-200k , 2990.0% for AGIs over 200k ) Taxable individual retirement arrangement distribution: $14,009 (reported on 10.3% of returns )44907:
$14,009Ohio:
$18,876
(% of AGI for various income ranges: 74.3% for AGIs below $25k , 100.5% for AGIs $25k-50k , 205.8% for AGIs $50k-75k , 577.1% for AGIs $75k-100k , 956.5% for AGIs $100k-200k , 3663.3% for AGIs over 200k ) Total itemized deductions: $30,333 (reported on 2.4% of returns )Here:
$30,333State:
$33,869
(% of AGI for various income ranges: 42.9% for AGIs $25k-50k , 85.3% for AGIs $50k-75k , 203.9% for AGIs $75k-100k , 789.2% for AGIs $100k-200k , 3960.0% for AGIs over 200k ) Charity contributions: $12,485 (reported on 1.7% of returns )Here:
$12,485State:
$14,577
(% of AGI for various income ranges: 7.7% for AGIs below $25k , 41.1% for AGIs $50k-75k , 250.4% for AGIs $100k-200k , 1463.3% for AGIs over 200k ) Taxes paid: $6,112 (reported on 2.1% of returns )(% of AGI for various income ranges: 3.3% for AGIs below $25k , 14.2% for AGIs $50k-75k , 37.7% for AGIs $75k-100k , 160.8% for AGIs $100k-200k , 820.0% for AGIs over 200k ) Earned income credit: $2,236 (reported on 18.9% of returns )(% of AGI for various income ranges: 87.3% for AGIs below $25k , 62.8% for AGIs $25k-50k ) Percentage of individuals using paid preparers for their 2020 taxes: 95.0%(% for various income ranges: 94.7% for AGIs below $25k , 96.2% for AGIs $25k-50k , 95.8% for AGIs $50k-75k , 91.8% for AGIs $75k-100k , 93.8% for AGIs $100k-200k , 90.0% for AGIs over 200k )
Averages for the 2012 tax year for zip code 44907, filed in 2013:
Average Adjusted Gross Income (AGI) in 2012: $40,103 (Individual Income Tax Returns) Here:
$40,103State:
$54,926
Salary/wage: $33,490 (reported on 82.7% of returns )Here:
$33,490State:
$45,869
(% of AGI for various income ranges: 74.2% for AGIs below $25k , 76.2% for AGIs $25k-50k , 73.7% for AGIs $50k-75k , 74.0% for AGIs $75k-100k , 63.3% for AGIs $100k-200k , 40.9% for AGIs over 200k ) Taxable interest for individuals: $1,243 (reported on 27.8% of returns )This zip code:
$1,243Ohio:
$1,297
(% of AGI for various income ranges: 1.2% for AGIs below $25k , 0.8% for AGIs $25k-50k , 0.7% for AGIs $50k-75k , 1.1% for AGIs $75k-100k , 0.8% for AGIs $100k-200k , 0.7% for AGIs over 200k ) Ordinary dividends: $5,152 (reported on 16.3% of returns )(% of AGI for various income ranges: 1.1% for AGIs below $25k , 0.8% for AGIs $25k-50k , 1.5% for AGIs $50k-75k , 1.6% for AGIs $75k-100k , 2.8% for AGIs $100k-200k , 6.8% for AGIs over 200k ) Net capital gain/loss in AGI: +$4,059 (reported on 11.8% of returns )Here:
+$4,059State:
+$11,232
(% of AGI for various income ranges: 0.5% for AGIs $50k-75k , 1.4% for AGIs $100k-200k , 7.6% for AGIs over 200k ) Profit/loss from business: +$13,780 (reported on 10.3% of returns )Here:
+$13,780State:
+$12,773
(% of AGI for various income ranges: 5.0% for AGIs below $25k , 1.8% for AGIs $25k-50k , 1.8% for AGIs $50k-75k , 1.7% for AGIs $75k-100k , 5.0% for AGIs $100k-200k , 8.7% for AGIs over 200k ) Taxable individual retirement arrangement distribution: $13,242 (reported on 12.1% of returns )44907:
$13,242Ohio:
$14,511
(% of AGI for various income ranges: 4.3% for AGIs below $25k , 3.1% for AGIs $25k-50k , 2.8% for AGIs $50k-75k , 3.5% for AGIs $75k-100k , 4.8% for AGIs $100k-200k , 7.1% for AGIs over 200k ) Self-employment retirement plans: $19,350 (reported on 0.3% of returns )44907:
$19,350Ohio:
$20,257
(% of AGI for various income ranges: 0.5% for AGIs $25k-50k ) Total itemized deductions: $17,704 (21% of AGI, reported on 20.3% of returns )Here:
$17,704State:
$21,278
Here:
21.1% of AGIState:
18.8% of AGI
(% of AGI for various income ranges: 5.7% for AGIs below $25k , 6.8% for AGIs $25k-50k , 8.3% for AGIs $50k-75k , 10.1% for AGIs $75k-100k , 12.2% for AGIs $100k-200k , 13.6% for AGIs over 200k ) Charity contributions: $4,608 (reported on 15.3% of returns )(% of AGI for various income ranges: 0.6% for AGIs below $25k , 1.0% for AGIs $25k-50k , 1.4% for AGIs $50k-75k , 2.2% for AGIs $75k-100k , 2.6% for AGIs $100k-200k , 3.9% for AGIs over 200k ) Taxes paid: $6,294 (reported on 20.3% of returns )(% of AGI for various income ranges: 0.9% for AGIs below $25k , 1.9% for AGIs $25k-50k , 2.7% for AGIs $50k-75k , 3.6% for AGIs $75k-100k , 5.1% for AGIs $100k-200k , 6.9% for AGIs over 200k ) Earned income credit: $2,247 (reported on 22.1% of returns )(% of AGI for various income ranges: 6.9% for AGIs below $25k , 0.9% for AGIs $25k-50k ) Percentage of individuals using paid preparers for their 2012 taxes: 49.6%(% for various income ranges: 43.9% for AGIs below $25k , 52.6% for AGIs $25k-50k , 53.8% for AGIs $50k-75k , 57.1% for AGIs $75k-100k , 56.2% for AGIs $100k-200k , 87.5% for AGIs over 200k )
Averages for the 2004 tax year for zip code 44907, filed in 2005:
Average Adjusted Gross Income (AGI) in 2004: $37,393 (Individual Income Tax Returns) Here:
$37,393State:
$44,480
Salary/wage: $32,904 (reported on 83.8% of returns )Here:
$32,904State:
$39,198
(% of AGI for various income ranges: 86.2% for AGIs below $10k , 74.4% for AGIs $10k-25k , 80.9% for AGIs $25k-50k , 80.4% for AGIs $50k-75k , 79.1% for AGIs $75k-100k , 56.0% for AGIs over 100k ) Taxable interest for individuals: $1,594 (reported on 43.6% of returns )This zip code:
$1,594Ohio:
$1,532
(% of AGI for various income ranges: 4.8% for AGIs below $10k , 2.6% for AGIs $10k-25k , 1.6% for AGIs $25k-50k , 1.6% for AGIs $50k-75k , 1.7% for AGIs $75k-100k , 1.8% for AGIs over 100k ) Taxable dividends: $3,351 (reported on 23.5% of returns )(% of AGI for various income ranges: 3.9% for AGIs below $10k , 1.7% for AGIs $10k-25k , 0.9% for AGIs $25k-50k , 1.4% for AGIs $50k-75k , 1.6% for AGIs $75k-100k , 4.4% for AGIs over 100k ) Net capital gain/loss: +$4,095 (reported on 17.7% of returns )Here:
+$4,095State:
+$8,582
(% of AGI for various income ranges: -2.9% for AGIs below $10k , 0.4% for AGIs $10k-25k , 0.3% for AGIs $25k-50k , 0.9% for AGIs $50k-75k , 1.9% for AGIs $75k-100k , 5.9% for AGIs over 100k ) Profit/loss from business: +$11,835 (reported on 11.2% of returns )Here:
+$11,835State:
+$10,813
(% of AGI for various income ranges: 2.5% for AGIs below $10k , 2.7% for AGIs $10k-25k , 2.3% for AGIs $25k-50k , 1.9% for AGIs $50k-75k , 3.8% for AGIs $75k-100k , 6.7% for AGIs over 100k ) IRA payment deduction: $2,873 (reported on 2.2% of returns )(% of AGI for various income ranges: 0.2% for AGIs $10k-25k , 0.2% for AGIs $25k-50k , 0.2% for AGIs $50k-75k , 0.2% for AGIs $75k-100k , 0.1% for AGIs over 100k ) Self-employed pension: $10,644 (reported on 0.6% of returns )Total itemized deductions: $15,103 (21% of AGI, reported on 28.4% of returns )Here:
$15,103State:
$17,503
Here:
21.1% of AGIState:
20.8% of AGI
(% of AGI for various income ranges: 8.6% for AGIs below $10k , 6.8% for AGIs $10k-25k , 9.4% for AGIs $25k-50k , 12.4% for AGIs $50k-75k , 14.1% for AGIs $75k-100k , 14.5% for AGIs over 100k ) Charity contributions deductions: $3,340 (4% of AGI, reported on 23.3% of returns )Here:
4.4% of AGIState:
3.4% of AGI
(% of AGI for various income ranges: 0.8% for AGIs below $10k , 0.9% for AGIs $10k-25k , 1.3% for AGIs $25k-50k , 2.1% for AGIs $50k-75k , 2.3% for AGIs $75k-100k , 3.5% for AGIs over 100k ) Total tax: $5,256 (reported on 74.4% of returns )(% of AGI for various income ranges: 2.0% for AGIs below $10k , 4.1% for AGIs $10k-25k , 7.3% for AGIs $25k-50k , 9.2% for AGIs $50k-75k , 11.3% for AGIs $75k-100k , 18.8% for AGIs over 100k ) Earned income credit: $1,591 (reported on 14.9% of returns )Percentage of individuals using paid preparers for their 2004 taxes: 56.4%(% for various income ranges: 46.4% for AGIs below $10k , 56.3% for AGIs $10k-25k , 59.0% for AGIs $25k-50k , 57.4% for AGIs $50k-75k , 62.3% for AGIs $75k-100k , 72.0% for AGIs over 100k )
Estimated median household income in 2022: This zip code:
$42,642Ohio:
$65,720
Nearest zip codes: 44902 ,
44903 ,
44901 ,
44906 ,
44905 ,
44904 .
Mansfield Zip Code Map
Percentage of family households: This zip code:
28.3%Ohio:
43.3%
Percentage of households with unmarried partners: This zip code:
5.7%Ohio:
44.6%
Likely homosexual households (counted as self-reported same-sex unmarried-partner households)
Lesbian couples: 0.2% of all households Gay men: 0.0% of all households
Household received Food Stamps/SNAP in the past 12 months: 1,264Household did not receive Food Stamps/SNAP in the past 12 months: 6,095
Women who had a birth in the past 12 months: 80 (49 now married , 31 unmarried) Women who did not have a birth in the past 12 months: 3,217 (1,039 now married , 2,178 unmarried)
Housing units in zip code 44907 with a mortgage: 2,169 (175
second mortgage , 23
home equity loan , 152
both second mortgage and home equity loan )
Houses without a mortgage: 26
Median monthly owner costs for units with a mortgage: $1,005
Median monthly owner costs for units without a mortgage: $421
Residents with income below the poverty level in 2022:
This zip code:
15.9%Whole state:
13.4%
Residents with income below 50% of the poverty level in 2022:
This zip code:
10.1%Whole state:
7.0%
Median number of rooms in houses and condos: Median number of rooms in apartments: Notable locations in this zip code not listed on our city pages
Click to draw/clear zip code borders Notable locations in zip code 44907: (A) , D And D Orchard Farm (B) , Critical Life Emergency Medical Services (C) , Mansfield Fire Department Station 3 (D) . Display/hide their locations on the map
Shopping Center: (1) . Display/hide its location on the map
Churches in zip code 44907 include: (A) , Mansfield Bible Church (B) , Fellowship Baptist Church (C) , Diamond Hills Baptist Church (D) , Woodville Grace Brethren Church (E) , Cook Road Baptist Church (F) , Temple Emanuel (G) , Southwood Baptist Church (H) , Holy Trinity Lutheran Church (I) . Display/hide their locations on the map
Parks in zip code 44907 include: (1) , Sterkel Park (2) , Sunset Park (3) , Gorman Nature Park (4) , Prospect Park (5) . Display/hide their locations on the map
Year house built (houses)
65 2020 or later24 2010 to 2019303 2000 to 2009572 1990 to 1999554 1980 to 19891,090 1970 to 19791,353 1960 to 19691,721 1950 to 1959746 1940 to 19491,200 1939 or earlier
Zip code 44907 household income distribution in 2022 484 Less than $10,000481 $10,000 to $14,999512 $15,000 to $19,999319 $20,000 to $24,999608 $25,000 to $29,999352 $30,000 to $34,999538 $35,000 to $39,999556 $40,000 to $44,999271 $45,000 to $49,999586 $50,000 to $59,999850 $60,000 to $74,999722 $75,000 to $99,999505 $100,000 to $124,999206 $125,000 to $149,999136 $150,000 to $199,999223 $200,000 or moreEstimate of home value of owner-occupied houses/condos in 2022 in zip code 44907 77 Less than $10,00096 $10,000 to $14,99981 $15,000 to $19,99972 $20,000 to $24,99918 $25,000 to $29,99942 $30,000 to $34,99924 $35,000 to $39,99955 $40,000 to $49,999211 $50,000 to $59,999150 $60,000 to $69,999328 $70,000 to $79,999177 $80,000 to $89,999191 $90,000 to $99,999365 $100,000 to $124,999437 $125,000 to $149,999411 $150,000 to $174,999382 $175,000 to $199,999213 $200,000 to $249,99970 $250,000 to $299,999132 $300,000 to $399,99928 $400,000 to $499,99941 $500,000 to $749,99913 $1,000,000 to $1,499,999Rent paid by renters in 2022 in zip code 44907 5 $150 to $19918 $200 to $24917 $250 to $299154 $300 to $349127 $350 to $399438 $400 to $449228 $450 to $499477 $500 to $549172 $550 to $599241 $600 to $649471 $650 to $699283 $700 to $749262 $750 to $79941 $800 to $899158 $900 to $99944 $1,000 to $1,24912 $1,250 to $1,49992 $1,500 to $1,999131 No cash rent
Median gross rent in 2022: $752.
Estimated median house (or condo) value in 2022 for: White Non-Hispanic householders: $130,513Black or African American householders: $120,934Native Hawaiian and other Pacific Islander householders: $935,448Two or more races householders: $92,497Hispanic or Latino householders: $79,775Estimated median house or condo value in 2022: $128,718
44907:
$128,718Ohio:
$204,100
Lower value quartile - upper value quartile: $78,348 - $188,953
Mean price in 2022: Detached houses: $139,108Here:
$139,108State:
$254,366
Townhouses or other attached units: $164,654Here:
$164,654State:
$225,733
In 2-unit structures: $145,376Here:
$145,376State:
$144,384
In 5-or-more-unit structures: $126,453Here:
$126,453State:
$211,593
Mobile homes: $74,140Here:
$74,140State:
$62,719
Housing units in structures:
One, detached: 4,465One, attached: 587Two: 5083 or 4: 3525 to 9: 63410 to 19: 50620 to 49: 30850 or more: 93Mobile homes: 321Unemployment : 3.2%
Means of transportation to work in zip code 44907 82.1% 6,046 Drove a car alone7.3% 536 Carpooled0.1% 10 Bus or trolley bus0.1% 10 Streetcar or trolley car0.1% 6 Ferryboat0.8% 58 Taxi0.5% 36 Walked7.5% 552 Worked at homeTravel time to work (commute) in zip code 44907 303 Less than 5 minutes964 5 to 9 minutes1,391 10 to 14 minutes1,161 15 to 19 minutes1,079 20 to 24 minutes100 25 to 29 minutes363 30 to 34 minutes92 35 to 39 minutes393 40 to 44 minutes193 45 to 59 minutes416 60 to 89 minutes237 90 or more minutes
Neighborhoods in zip code 44907: Percentage of zip code residents living and working in this county: 84.2%
Household type by relationship:
Households: 15,139
Male householders: 3,374 (1,459 living alone ), Female householders: 3,978 (1,879 living alone )2,222 spouses (2,199 opposite-sex spouses ), 815 unmarried partners , (736 opposite-sex unmarried partners ), 3,316 children (3,143 natural , 21 adopted , 149 stepchildren ), 470 grandchildren , 125 brothers or sisters , 191 parents , 44 foster children , 96 other relatives , 322 non-relatives In group quarters: 235 (-1 institutionalized population )
Size of family households: 1,740 2-persons , 687 3-persons , 442 4-persons , 253 5-persons , 116 6-persons , 19 7-or-more-persons
Size of nonfamily households: 3,339 1-person , 701 2-persons , 83 3-persons , 5 4-persons
1,346 married couples with children. single-parent households (445 men , 683 women ).
96.8% of residents of 44907 zip code speak English at home. of residents speak Spanish at home (18% very well, 32% well, 50% not well ).of residents speak other Indo-European language at home (80% very well, 20% well ).of residents speak Asian or Pacific Island language at home (47% very well, 37% well, 16% not well ).
Foreign born population: 353 (2.3%)
(68.7%
of them are naturalized citizens )
This zip code:
2.3%Whole state:
5.0%
13% Honduras 12% Bolivia 8% Ukraine 8% Nepal 8% Costa Rica 6% Greece 6% Malaysia 18% German 13% American 9% English 7% Irish 5% Italian 3% Greek 2% Polish
Year of entry for the foreign-born population
69 2010 or later 63 2000 to 2009 77 1990 to 1999 176 Before 1990
There are
240 Medical Specialists in Zip Code 44907 .
Facilities with environmental interests located in this zip code:
BECHTEL DRYCLEANERS (1351 LEXINGTON AVE in MANSFIELD, OH)
STATE MASTER (Ohio general info) - RCRA-OHD018143396, HAZARDOUS WASTE PROGRAM, AIR MAJOR Small Quantity Generators, between 100 kg and 1000 kg of hazardous waste/month (Resource Conservation and Recovery Act (tracking hazardous waste)) - notification Organizations: ROBERTS JON (CONTACT/OWNER)
ALLTEL - MSC MANSFIELD (1699 SOUTH MAIN ST. in MANSFIELD, OH)
(Integrated Compliance Information System) - ICIS-HQ-2000-6004, FORMAL ENFORCEMENT ACTION
ALLTEL - WOODLAND (1194 TIMBERCLIFF DR in MANSFIELD, OH)
(Integrated Compliance Information System) - ICIS-HQ-2000-6004, FORMAL ENFORCEMENT ACTION
Housing units lacking complete plumbing facilities: 0.7%
Housing units lacking complete kitchen facilities: 0.7%
72.8% Utility gas 23.7% Electricity 1.0% No fuel used 0.7% Wood 0.7% Bottled, tank, or LP gas 0.6% Fuel oil, kerosene, etc.
Population in 1990: 14,891. Population change in the 1990s: +303 (+2.0%).
Place of birth for U.S.-born residents:
This state: 12,237Northeast: 365Midwest: 434South: 1,333West: 336
55% of the 44907 zip code residents lived in the same house 5 years ago.
Out of people who lived in different houses, 70% lived in this county.
Out of people who lived in different counties, 50% lived in Ohio.
91% of the 44907 zip code residents lived in the same house 1 year ago.
Out of people who lived in different houses, 64% moved from this county.
Out of people who lived in different houses, 16% moved from different county within same state.
Out of people who lived in different houses, 18% moved from different state.
Private vs. public school enrollment:
Students in private schools in grades 1 to 8 (elementary and middle school): 145
Students in private schools in grades 9 to 12 (high school): 112
Students in private undergraduate colleges: 147
Occupation by median earnings in the past 12 months ($)
100,724 Health diagnosing and treating practitioners and other technical occupations 68,297 Legal occupations 63,748 Life, physical, and social science occupations 60,709 Management occupations 60,001 Business and financial operations occupations 57,366 Law enforcement workers including supervisors
Top industries in this zip code by the number of employees in 2005:
Accommodation and Food Services: Limited-Service Restaurants (50-99 employees: 2 establishments, 20-49 employees: 7 establishments, 10-19 employees: 1 establishment, 5-9 employees: 2 establishments, 1-4 employees: 3 establishments)Administrative and Support and Waste Management and Remediation Services: Janitorial Services (250-499: 1, 1-4: 1)Health Care and Social Assistance: Nursing Care Facilities (100-249: 2, 10-19: 1, 1-4: 1)Health Care and Social Assistance: Outpatient Mental Health and Substance Abuse Centers (100-249: 2)Health Care and Social Assistance: Offices of Physicians (except Mental Health Specialists) (20-49: 2, 10-19: 6, 5-9: 7, 1-4: 7)Information: Wired Telecommunications Carriers (100-249: 1, 20-49: 1)Health Care and Social Assistance: Offices of Dentists (10-19: 6, 5-9: 12, 1-4: 3)Arts, Entertainment, and Recreation: Promoters of Performing Arts, Sports, and Similar Events with Facilities (100-249: 1)
People in group quarters in 2010:
166 people in nursing facilities/skilled-nursing facilities
108 people in other noninstitutional facilities
59 people in group homes intended for adults
10 people in residential treatment centers for adults
People in group quarters in 2000:
215 people in nursing homes
63 people in homes for the mentally retarded
3 people in homes for the mentally ill
Home Mortgage Disclosure Act Aggregated Statistics For Year 2009(Based on 1 full and 8 partial tracts) A) FHA, FSA/RHS & VA B) Conventional C) Refinancings D) Home Improvement Loans E) Loans on Dwellings For 5+ Families F) Non-occupant Loans on G) Loans On Manufactured Number Average Value Number Average Value Number Average Value Number Average Value Number Average Value Number Average Value Number Average Value
LOANS ORIGINATED 50 $81,294 75 $75,963 207 $101,616 19 $41,734 1 $312,330 33 $58,752 0 $0 APPLICATIONS APPROVED, NOT ACCEPTED 0 $0 6 $160,552 30 $116,009 3 $26,717 0 $0 2 $15,275 0 $0 APPLICATIONS DENIED 9 $96,789 19 $77,822 116 $99,404 16 $32,502 0 $0 13 $59,603 2 $3,595 APPLICATIONS WITHDRAWN 4 $68,925 2 $185,115 41 $113,304 2 $71,635 0 $0 2 $80,315 0 $0 FILES CLOSED FOR INCOMPLETENESS 1 $128,320 0 $0 6 $103,908 1 $14,730 0 $0 0 $0 0 $0
Aggregated Statistics For Year 2008(Based on 1 full and 8 partial tracts) A) FHA, FSA/RHS & VA B) Conventional C) Refinancings D) Home Improvement Loans E) Loans on Dwellings For 5+ Families F) Non-occupant Loans on G) Loans On Manufactured Number Average Value Number Average Value Number Average Value Number Average Value Number Average Value Number Average Value Number Average Value
LOANS ORIGINATED 79 $80,067 110 $104,300 140 $87,875 51 $30,965 2 $596,690 48 $62,543 2 $6,290 APPLICATIONS APPROVED, NOT ACCEPTED 6 $83,943 16 $94,881 22 $96,211 12 $22,478 1 $484,870 6 $92,365 3 $44,220 APPLICATIONS DENIED 17 $74,724 26 $75,748 182 $92,207 57 $25,346 4 $344,760 28 $70,715 3 $49,833 APPLICATIONS WITHDRAWN 6 $73,268 11 $129,156 54 $98,675 4 $48,518 0 $0 6 $58,310 0 $0 FILES CLOSED FOR INCOMPLETENESS 3 $138,817 1 $55,000 7 $100,793 2 $31,445 0 $0 0 $0 0 $0
Aggregated Statistics For Year 2007(Based on 1 full and 8 partial tracts) A) FHA, FSA/RHS & VA B) Conventional C) Refinancings D) Home Improvement Loans E) Loans on Dwellings For 5+ Families F) Non-occupant Loans on G) Loans On Manufactured Number Average Value Number Average Value Number Average Value Number Average Value Number Average Value Number Average Value Number Average Value
LOANS ORIGINATED 30 $84,914 199 $90,043 210 $91,423 61 $29,174 2 $552,195 61 $67,349 3 $15,820 APPLICATIONS APPROVED, NOT ACCEPTED 8 $65,859 32 $66,646 53 $90,279 12 $34,656 1 $1,448,310 16 $74,947 0 $0 APPLICATIONS DENIED 5 $74,192 43 $78,412 238 $99,046 72 $30,738 3 $199,527 23 $128,297 2 $15,765 APPLICATIONS WITHDRAWN 0 $0 14 $68,884 63 $104,963 5 $72,938 0 $0 2 $65,930 1 $6,300 FILES CLOSED FOR INCOMPLETENESS 0 $0 8 $88,290 27 $100,634 0 $0 0 $0 0 $0 0 $0
Aggregated Statistics For Year 2006(Based on 1 full and 8 partial tracts) A) FHA, FSA/RHS & VA B) Conventional C) Refinancings D) Home Improvement Loans E) Loans on Dwellings For 5+ Families F) Non-occupant Loans on G) Loans On Manufactured Number Average Value Number Average Value Number Average Value Number Average Value Number Average Value Number Average Value Number Average Value
LOANS ORIGINATED 41 $97,984 304 $81,997 293 $83,678 74 $33,769 4 $289,330 99 $55,070 3 $6,297 APPLICATIONS APPROVED, NOT ACCEPTED 4 $81,180 24 $68,267 61 $95,535 14 $41,430 0 $0 5 $29,112 2 $30,550 APPLICATIONS DENIED 13 $100,188 68 $75,313 284 $88,034 94 $26,008 0 $0 53 $63,162 6 $27,322 APPLICATIONS WITHDRAWN 2 $110,290 31 $62,829 129 $94,351 16 $35,607 0 $0 16 $43,982 0 $0 FILES CLOSED FOR INCOMPLETENESS 0 $0 6 $86,083 32 $84,366 0 $0 0 $0 2 $116,860 0 $0
Aggregated Statistics For Year 2005(Based on 1 full and 8 partial tracts) A) FHA, FSA/RHS & VA B) Conventional C) Refinancings D) Home Improvement Loans E) Loans on Dwellings For 5+ Families F) Non-occupant Loans on G) Loans On Manufactured Number Average Value Number Average Value Number Average Value Number Average Value Number Average Value Number Average Value Number Average Value
LOANS ORIGINATED 42 $89,643 324 $94,127 382 $87,627 89 $33,456 5 $712,626 93 $86,677 1 $3,780 APPLICATIONS APPROVED, NOT ACCEPTED 3 $80,680 50 $80,429 84 $85,777 13 $65,241 0 $0 15 $63,417 4 $33,130 APPLICATIONS DENIED 6 $82,702 84 $75,526 353 $81,710 74 $26,787 1 $114,020 57 $54,521 15 $39,571 APPLICATIONS WITHDRAWN 0 $0 39 $88,621 187 $99,507 29 $98,892 4 $533,670 8 $105,309 1 $88,160 FILES CLOSED FOR INCOMPLETENESS 0 $0 25 $77,474 34 $107,519 2 $33,370 0 $0 8 $47,669 0 $0
Aggregated Statistics For Year 2004(Based on 1 full and 8 partial tracts) A) FHA, FSA/RHS & VA B) Conventional C) Refinancings D) Home Improvement Loans E) Loans on Dwellings For 5+ Families F) Non-occupant Loans on G) Loans On Manufactured Number Average Value Number Average Value Number Average Value Number Average Value Number Average Value Number Average Value Number Average Value
LOANS ORIGINATED 51 $95,316 301 $90,976 363 $97,445 96 $28,863 6 $396,227 76 $105,106 4 $13,578 APPLICATIONS APPROVED, NOT ACCEPTED 6 $67,918 32 $92,211 84 $80,562 15 $33,636 0 $0 4 $66,135 3 $10,367 APPLICATIONS DENIED 9 $81,568 55 $74,630 301 $77,178 75 $21,508 0 $0 22 $52,460 11 $25,954 APPLICATIONS WITHDRAWN 2 $170,325 12 $99,950 217 $86,543 11 $39,246 0 $0 11 $53,391 0 $0 FILES CLOSED FOR INCOMPLETENESS 3 $93,070 10 $91,468 37 $86,148 3 $29,587 0 $0 4 $78,310 0 $0
Aggregated Statistics For Year 2003(Based on 1 full and 8 partial tracts) A) FHA, FSA/RHS & VA B) Conventional C) Refinancings D) Home Improvement Loans E) Loans on Dwellings For 5+ Families F) Non-occupant Loans on Number Average Value Number Average Value Number Average Value Number Average Value Number Average Value Number Average Value
LOANS ORIGINATED 64 $88,481 257 $83,327 835 $90,667 71 $19,039 8 $597,122 77 $84,621 APPLICATIONS APPROVED, NOT ACCEPTED 4 $103,792 20 $66,620 125 $83,993 19 $14,932 0 $0 6 $61,138 APPLICATIONS DENIED 7 $80,660 34 $54,072 307 $84,042 67 $10,727 1 $3,771,900 19 $46,408 APPLICATIONS WITHDRAWN 8 $69,392 18 $81,808 203 $81,174 3 $12,517 0 $0 8 $56,474 FILES CLOSED FOR INCOMPLETENESS 3 $97,480 13 $75,056 52 $85,859 3 $22,040 0 $0 6 $69,630
Aggregated Statistics For Year 2002(Based on 1 full and 6 partial tracts) A) FHA, FSA/RHS & VA B) Conventional C) Refinancings D) Home Improvement Loans E) Loans on Dwellings For 5+ Families F) Non-occupant Loans on Number Average Value Number Average Value Number Average Value Number Average Value Number Average Value Number Average Value
LOANS ORIGINATED 76 $72,936 187 $68,053 425 $74,035 39 $13,771 1 $500,000 71 $60,572 APPLICATIONS APPROVED, NOT ACCEPTED 3 $69,267 24 $57,191 95 $64,356 5 $8,544 0 $0 7 $37,674 APPLICATIONS DENIED 7 $78,036 28 $58,427 257 $62,037 33 $14,313 1 $547,840 17 $34,952 APPLICATIONS WITHDRAWN 5 $67,172 14 $54,503 211 $69,869 8 $9,870 0 $0 7 $45,951 FILES CLOSED FOR INCOMPLETENESS 1 $123,420 2 $81,075 50 $72,124 1 $25,190 0 $0 1 $55,410
Aggregated Statistics For Year 2001(Based on 1 full and 6 partial tracts) A) FHA, FSA/RHS & VA B) Conventional C) Refinancings D) Home Improvement Loans E) Loans on Dwellings For 5+ Families F) Non-occupant Loans on Number Average Value Number Average Value Number Average Value Number Average Value Number Average Value Number Average Value
LOANS ORIGINATED 70 $70,739 202 $65,766 453 $70,026 43 $10,163 1 $133,500 54 $53,828 APPLICATIONS APPROVED, NOT ACCEPTED 3 $61,290 25 $46,838 97 $69,623 19 $17,307 0 $0 5 $37,058 APPLICATIONS DENIED 10 $67,859 47 $43,489 266 $59,961 64 $12,372 0 $0 17 $39,098 APPLICATIONS WITHDRAWN 4 $68,180 4 $113,005 174 $64,863 16 $21,307 1 $4,168,610 4 $54,375 FILES CLOSED FOR INCOMPLETENESS 3 $59,940 8 $60,151 28 $61,214 0 $0 0 $0 0 $0
Aggregated Statistics For Year 2000(Based on 1 full and 6 partial tracts) A) FHA, FSA/RHS & VA B) Conventional C) Refinancings D) Home Improvement Loans F) Non-occupant Loans on Number Average Value Number Average Value Number Average Value Number Average Value Number Average Value
LOANS ORIGINATED 49 $70,444 250 $70,682 180 $52,533 67 $13,829 39 $42,028 APPLICATIONS APPROVED, NOT ACCEPTED 4 $83,378 34 $35,466 92 $58,697 23 $14,546 14 $31,960 APPLICATIONS DENIED 13 $60,000 138 $39,869 236 $51,515 67 $13,622 41 $39,666 APPLICATIONS WITHDRAWN 3 $62,147 27 $52,718 84 $52,647 5 $32,492 8 $46,624 FILES CLOSED FOR INCOMPLETENESS 0 $0 2 $55,705 14 $52,042 0 $0 0 $0
Aggregated Statistics For Year 1999(Based on 1 full and 4 partial tracts) A) FHA, FSA/RHS & VA B) Conventional C) Refinancings D) Home Improvement Loans F) Non-occupant Loans on Number Average Value Number Average Value Number Average Value Number Average Value Number Average Value
LOANS ORIGINATED 44 $70,282 160 $73,398 230 $60,843 44 $15,987 26 $62,471 APPLICATIONS APPROVED, NOT ACCEPTED 1 $63,400 21 $52,261 67 $54,236 18 $10,471 2 $43,425 APPLICATIONS DENIED 5 $65,734 47 $42,277 142 $54,841 43 $14,524 8 $37,452 APPLICATIONS WITHDRAWN 3 $93,653 15 $61,577 96 $55,155 5 $63,462 1 $43,650 FILES CLOSED FOR INCOMPLETENESS 0 $0 6 $62,618 18 $60,387 0 $0 2 $37,965
Private Mortgage Insurance Companies Aggregated Statistics For Year 2009(Based on 1 full and 6 partial tracts) A) Conventional B) Refinancings Number Average Value Number Average Value
LOANS ORIGINATED 5 $93,082 5 $108,766 APPLICATIONS APPROVED, NOT ACCEPTED 6 $83,287 4 $86,948 APPLICATIONS DENIED 2 $67,855 0 $0 APPLICATIONS WITHDRAWN 1 $61,710 1 $142,390 FILES CLOSED FOR INCOMPLETENESS 2 $94,725 0 $0
Aggregated Statistics For Year 2008(Based on 1 full and 8 partial tracts) A) Conventional B) Refinancings C) Non-occupant Loans on Number Average Value Number Average Value Number Average Value
LOANS ORIGINATED 31 $108,053 15 $92,640 3 $110,540 APPLICATIONS APPROVED, NOT ACCEPTED 11 $97,409 8 $138,402 2 $77,270 APPLICATIONS DENIED 6 $56,447 4 $112,162 4 $92,295 APPLICATIONS WITHDRAWN 2 $149,370 2 $137,785 1 $215,620 FILES CLOSED FOR INCOMPLETENESS 3 $80,993 1 $119,640 3 $93,877
Aggregated Statistics For Year 2007(Based on 1 full and 8 partial tracts) A) Conventional B) Refinancings C) Non-occupant Loans on Number Average Value Number Average Value Number Average Value
LOANS ORIGINATED 88 $87,506 14 $92,001 10 $69,523 APPLICATIONS APPROVED, NOT ACCEPTED 20 $91,660 12 $134,877 1 $65,000 APPLICATIONS DENIED 1 $105,790 0 $0 1 $105,790 APPLICATIONS WITHDRAWN 1 $159,940 4 $120,258 0 $0 FILES CLOSED FOR INCOMPLETENESS 0 $0 0 $0 0 $0
Aggregated Statistics For Year 2006(Based on 1 full and 8 partial tracts) A) Conventional B) Refinancings C) Non-occupant Loans on Number Average Value Number Average Value Number Average Value
LOANS ORIGINATED 76 $87,026 24 $106,105 17 $47,044 APPLICATIONS APPROVED, NOT ACCEPTED 13 $86,094 11 $115,965 6 $57,547 APPLICATIONS DENIED 1 $75,000 0 $0 0 $0 APPLICATIONS WITHDRAWN 2 $90,475 3 $171,443 0 $0 FILES CLOSED FOR INCOMPLETENESS 0 $0 1 $84,000 0 $0
Aggregated Statistics For Year 2005(Based on 1 full and 8 partial tracts) A) Conventional B) Refinancings C) Non-occupant Loans on Number Average Value Number Average Value Number Average Value
LOANS ORIGINATED 104 $93,371 25 $98,169 13 $63,876 APPLICATIONS APPROVED, NOT ACCEPTED 14 $117,689 16 $81,733 2 $56,775 APPLICATIONS DENIED 2 $79,070 0 $0 2 $79,070 APPLICATIONS WITHDRAWN 4 $116,558 2 $166,720 0 $0 FILES CLOSED FOR INCOMPLETENESS 2 $64,085 4 $57,505 1 $45,050
Aggregated Statistics For Year 2004(Based on 1 full and 8 partial tracts) A) Conventional B) Refinancings C) Non-occupant Loans on Number Average Value Number Average Value Number Average Value
LOANS ORIGINATED 91 $90,106 35 $95,512 7 $88,006 APPLICATIONS APPROVED, NOT ACCEPTED 8 $116,462 19 $89,796 1 $90,680 APPLICATIONS DENIED 0 $0 2 $37,735 2 $37,735 APPLICATIONS WITHDRAWN 1 $115,700 8 $84,304 0 $0 FILES CLOSED FOR INCOMPLETENESS 0 $0 0 $0 0 $0
Aggregated Statistics For Year 2003(Based on 1 full and 8 partial tracts) A) Conventional B) Refinancings C) Non-occupant Loans on Number Average Value Number Average Value Number Average Value
LOANS ORIGINATED 100 $83,450 101 $86,934 13 $61,379 APPLICATIONS APPROVED, NOT ACCEPTED 21 $73,083 30 $95,404 2 $63,065 APPLICATIONS DENIED 0 $0 0 $0 0 $0 APPLICATIONS WITHDRAWN 3 $78,427 4 $150,815 1 $116,750 FILES CLOSED FOR INCOMPLETENESS 0 $0 0 $0 0 $0
Aggregated Statistics For Year 2002(Based on 1 full and 6 partial tracts) A) Conventional B) Refinancings C) Non-occupant Loans on Number Average Value Number Average Value Number Average Value
LOANS ORIGINATED 74 $70,754 65 $77,084 7 $62,423 APPLICATIONS APPROVED, NOT ACCEPTED 16 $64,976 21 $83,686 0 $0 APPLICATIONS DENIED 0 $0 3 $89,113 0 $0 APPLICATIONS WITHDRAWN 8 $60,879 8 $87,905 3 $69,687 FILES CLOSED FOR INCOMPLETENESS 0 $0 1 $108,310 0 $0
Aggregated Statistics For Year 2001(Based on 1 full and 6 partial tracts) A) Conventional B) Refinancings C) Non-occupant Loans on Number Average Value Number Average Value Number Average Value
LOANS ORIGINATED 61 $76,123 70 $80,024 5 $61,438 APPLICATIONS APPROVED, NOT ACCEPTED 14 $59,956 13 $69,338 4 $34,142 APPLICATIONS DENIED 0 $0 1 $87,880 0 $0 APPLICATIONS WITHDRAWN 1 $55,410 4 $84,750 0 $0 FILES CLOSED FOR INCOMPLETENESS 0 $0 0 $0 0 $0
Aggregated Statistics For Year 2000(Based on 1 full and 6 partial tracts) A) Conventional B) Refinancings C) Non-occupant Loans on Number Average Value Number Average Value Number Average Value
LOANS ORIGINATED 63 $69,568 23 $65,310 10 $52,845 APPLICATIONS APPROVED, NOT ACCEPTED 4 $105,415 4 $64,012 0 $0 APPLICATIONS DENIED 2 $83,730 1 $79,340 0 $0 APPLICATIONS WITHDRAWN 3 $62,577 0 $0 0 $0 FILES CLOSED FOR INCOMPLETENESS 0 $0 0 $0 0 $0
Aggregated Statistics For Year 1999(Based on 1 full and 4 partial tracts) A) Conventional B) Refinancings C) Non-occupant Loans on Number Average Value Number Average Value Number Average Value
LOANS ORIGINATED 39 $73,797 16 $74,541 5 $30,586 APPLICATIONS APPROVED, NOT ACCEPTED 7 $57,123 1 $71,210 0 $0 APPLICATIONS DENIED 1 $81,090 1 $102,900 0 $0 APPLICATIONS WITHDRAWN 1 $60,570 2 $59,885 0 $0 FILES CLOSED FOR INCOMPLETENESS 0 $0 0 $0 0 $0
2002 - 2018 National Fire Incident Reporting System (NFIRS) incidents See full 2006 National Fire Incident Reporting System statistics for zip code 44907, Ohio
Most common first names in zip code 44907 among deceased individuals Name Count Lived (average)
Mary 166 81.4 years John 164 76.2 years William 134 76.0 years Robert 121 73.4 years Helen 102 80.4 years Charles 97 77.8 years James 83 70.5 years Margaret 82 82.1 years Dorothy 64 80.0 years Ruth 63 80.1 years
Most common last names in zip code 44907 among deceased individuals Last name Count Lived (average)
Smith 54 72.3 years Miller 51 78.6 years Williams 28 77.3 years Young 24 76.8 years Jones 21 80.4 years Brown 20 75.9 years Thompson 20 76.8 years Davis 20 77.5 years Hoffman 20 77.9 years Baker 19 80.5 years
Businesses in zip code 44907
Name Count Name Count
Advance Auto Parts 1 New Balance 3 Blockbuster 1 Pizza Hut 1 Burger King 1 RadioShack 1 CVS 1 Rite Aid 1 Circle K 2 Starbucks 1 FedEx 1 Subway 2 GNC 1 T-Mobile 1 H&R Block 2 True Value 1 Jones New York 1 UPS 3 KFC 1 Walgreens 1 Kroger 2 YMCA 1
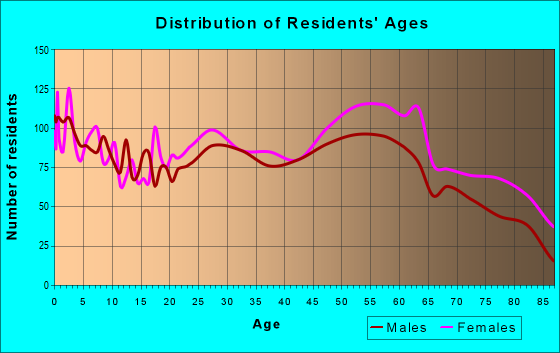
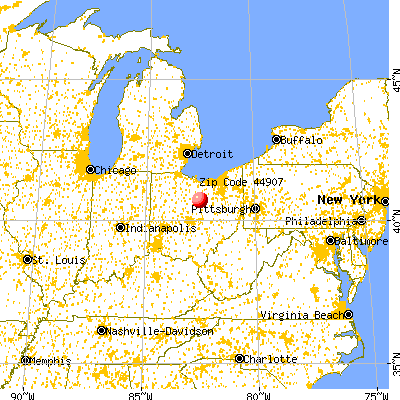


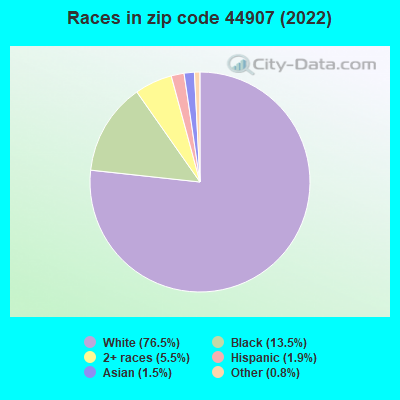


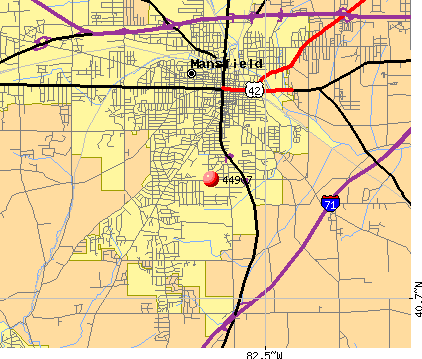 Nearest zip codes: 44902, 44903, 44901, 44906, 44905, 44904.
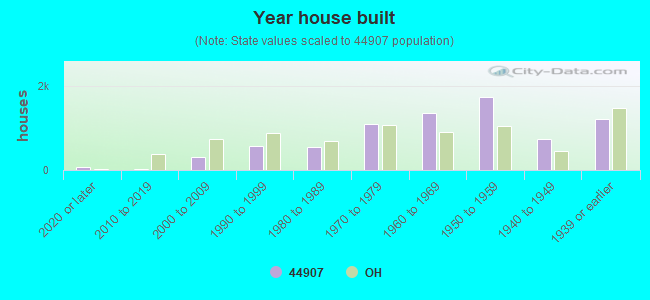
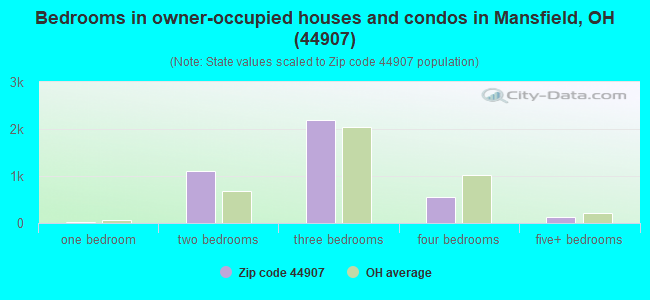
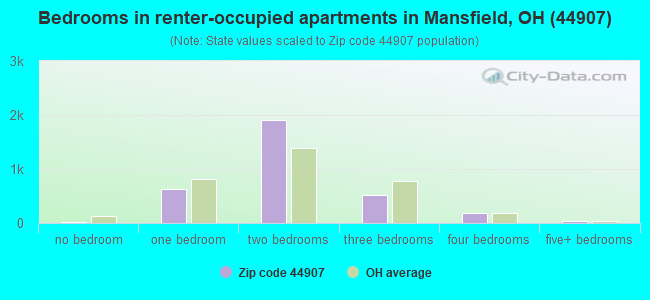
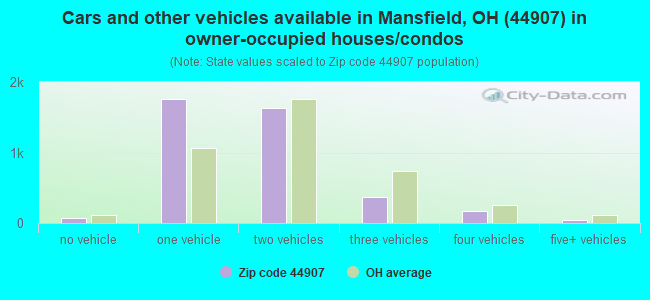
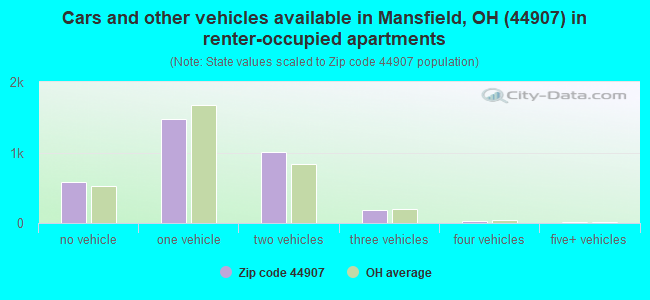


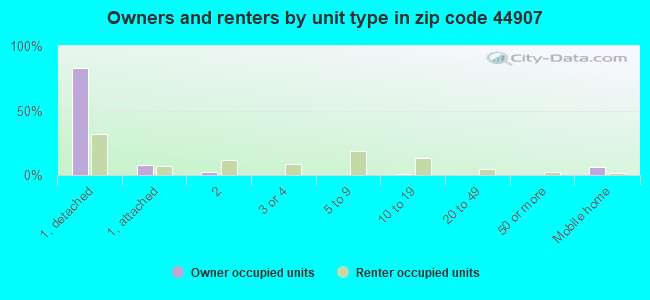
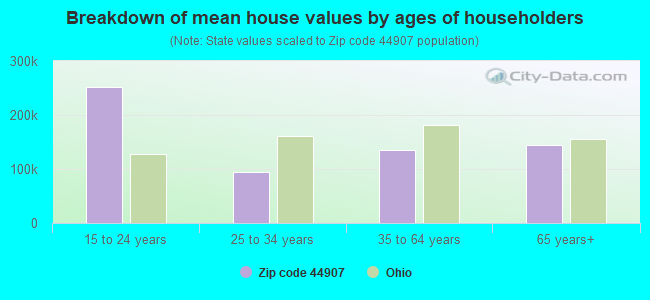


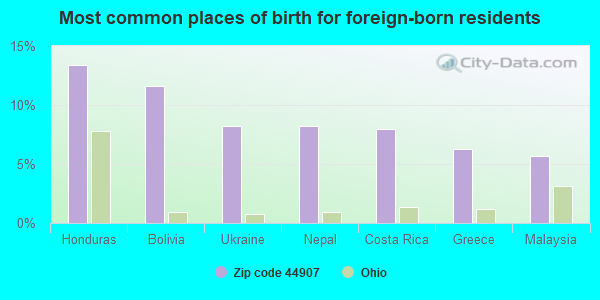
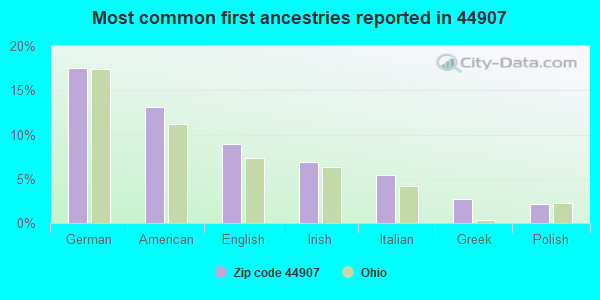
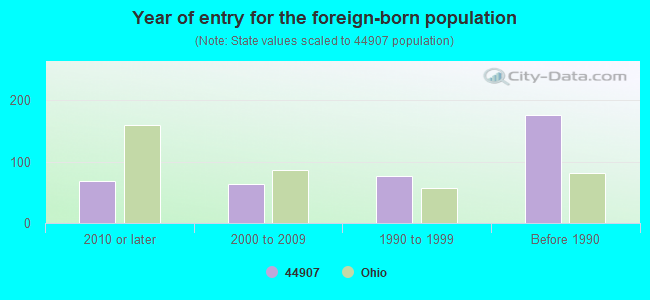


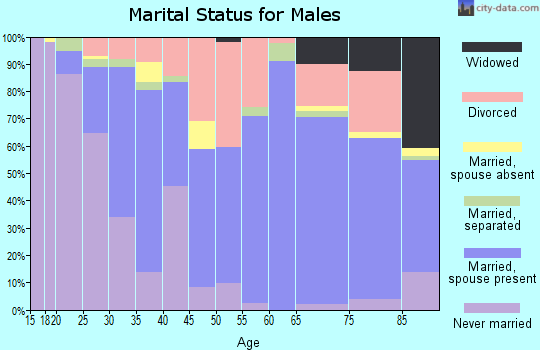
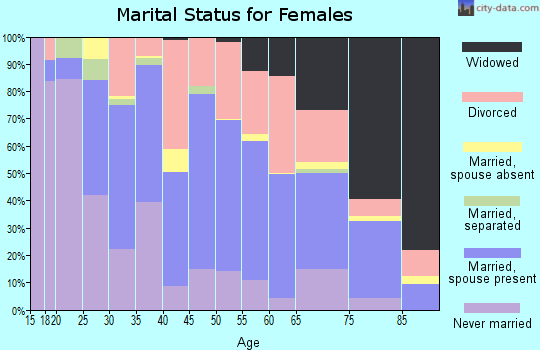
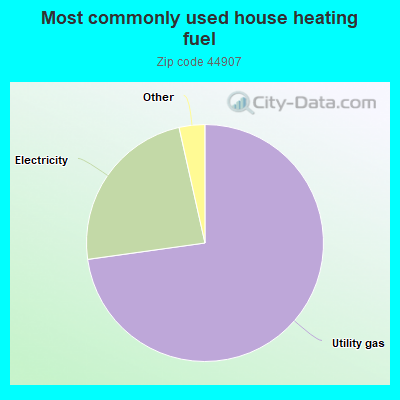
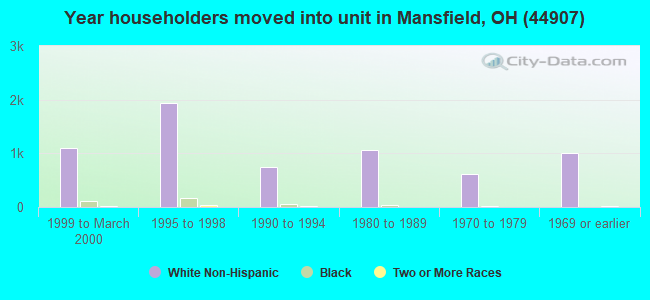
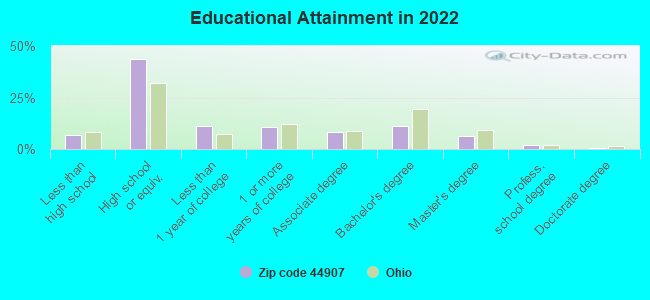
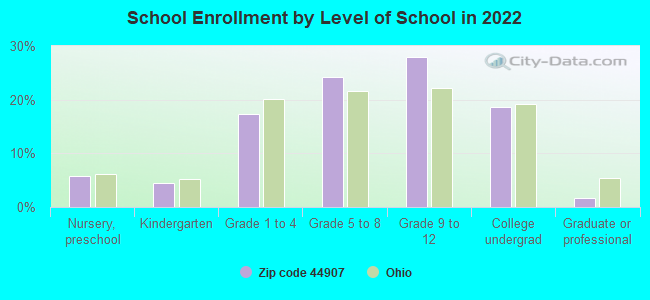
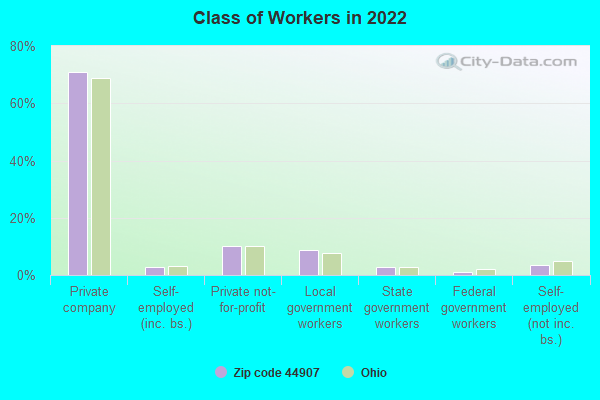
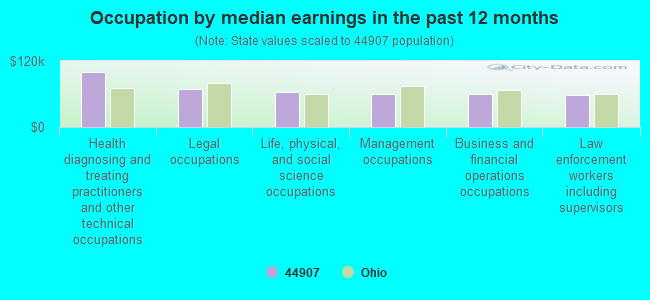
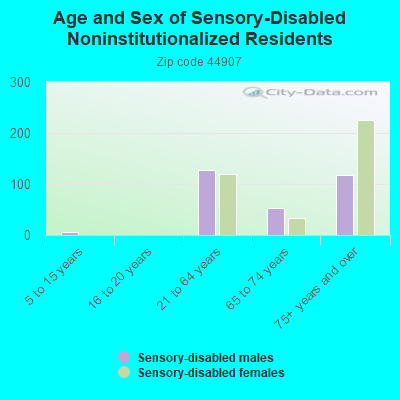
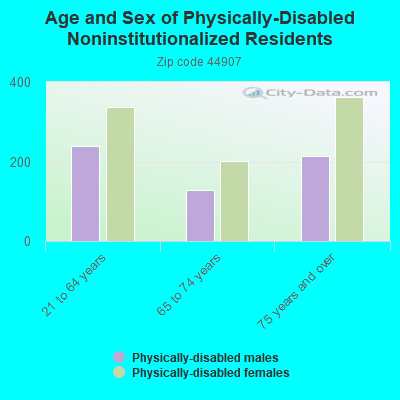
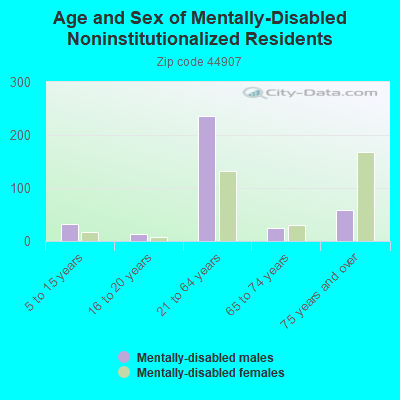
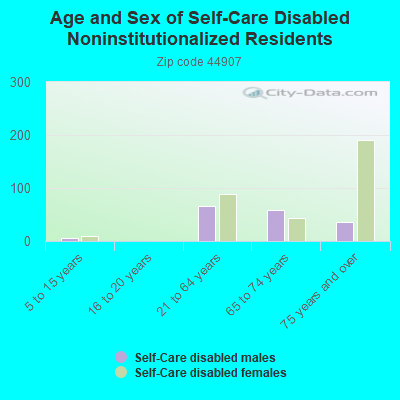
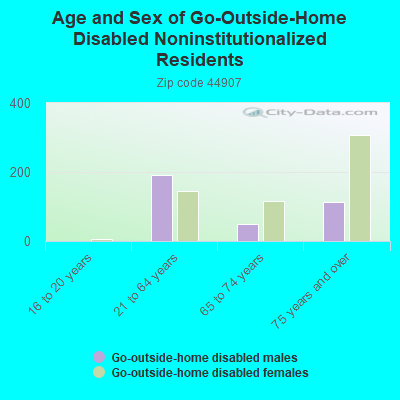
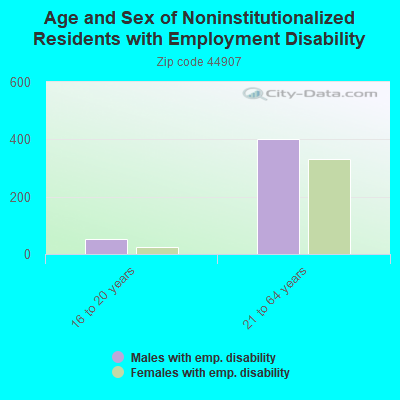
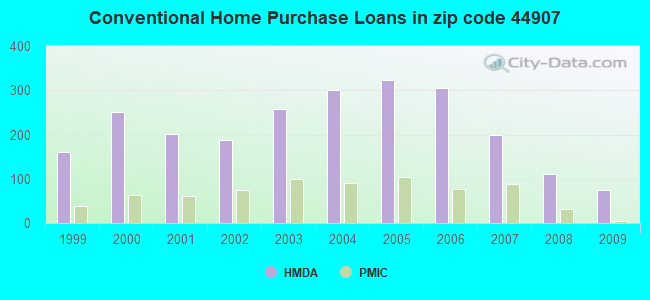
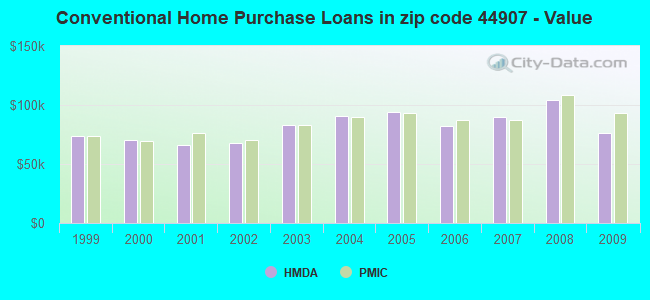
 According to the data from the years 2002 - 2018 the average number of fire incidents per year is 33. The highest number of fires - 72 took place in 2016, and the least - 9 in 2002. The data has an increasing trend.
 When looking into fire subcategories, the most incidents belonged to: Structure Fires (48.2%), and Outside Fires (38.0%).