Santana Row neighborhood in San Jose, California (CA), 95128 detailed profile
Settings
X


Business Search - 14 Million verified businesses
Area: 0.157 square miles
Population: 169
Population density:
| Santana Row: | 1,077 people per square mile |
| San Jose: | 5,554 people per square mile |

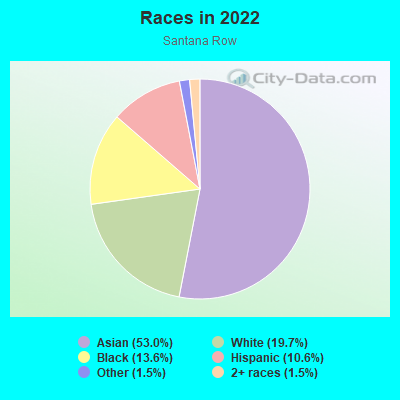
- 10553.0%Asian
- 3919.7%White
- 2713.6%Black
- 2110.6%Hispanic or Latino
- 31.5%Some other race
- 31.5%Two or more races
Median household income in 2022:
| Santana Row: | $182,318 |
| San Jose: | $133,835 |
Distribution of median household income
![Distribution of median household income]()
- 10Less than $10,000
- 43$10,000 to $19,999
- 52$20,000 to $29,999
- 17$30,000 to $39,999
- 25$40,000 to $49,999
- 1$50,000 to $59,999
- 42$60,000 to $74,999
- 19$75,000 to $99,999
- 8$100,000 to $124,999
- 123$125,000 to $149,999
- 4$150,000 to $199,999
- 49$200,000 or more

Distribution of owner-occupied house/condo value
![Distribution of owner-occupied house/condo value]()
- 11$100,000 to $149,999
- 3$150,000 to $199,999
- 18$200,000 to $249,999
- 3$300,000 to $399,999
- 9$400,000 to $499,999
- 11$500,000 to $749,999
- 30$750,000 to $999,999
- 100$1,000,000 or more

Distribution of rent paid by renters
![Distribution of rent paid by renters]()
- 10$100 to $199
- 12$200 to $299
- 61$300 to $399
- 6$400 to $499
- 20$500 to $599
- 3$900 to $999
- 18$1,000 to $1,249
- 29$1,250 to $1,499
- 7$1,500 to $1,999
- 186$2,000 or more

Median rent in 2022:
| Santana Row: | $3,458 |
| San Jose: | $2,001 |
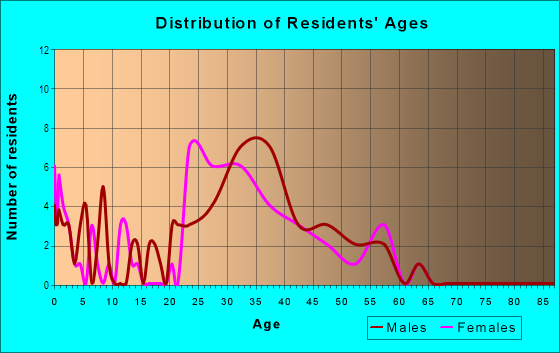
| Males: | 79 |
| Females: | 90 |
Males:
| This neighborhood: | 31.5 years |
| Whole city: | 37.6 years |
| This neighborhood: | 35.2 years |
| Whole city: | 39.1 years |
Average household size:
| Santana Row: | 2.1 people |
| San Jose: | 2.9 people |
Percentage of family households:
| Santana Row: | 66.0% |
| San Jose: | 49.9% |
| Here: | 55.8% |
| San Jose: | 53.0% |
Percentage of married-couple families with children (among all households):
| Santana Row: | 275.2% |
| San Jose: | 25.8% |
Percentage of single-mother households (among all households):
| Santana Row: | 14.5% |
| San Jose: | 5.2% |
Percentage of never married males 15 years old and over:
Percentage of never married females 15 years old and over:
| Santana Row: | 8.4% |
| San Jose: | 20.9% |
Percentage of never married females 15 years old and over:
| Santana Row: | 15.0% |
| city: | 16.7% |
Percentage of people that speak English not well or not at all:
| Santana Row: | 26.5% |
| San Jose: | 11.4% |
Percentage of people born in this state:
Percentage of people born in another U.S. state:
Percentage of native residents but born outside the U.S.:
Percentage of foreign born residents:
| Here: | 49.9% |
| San Jose: | 46.1% |
Percentage of people born in another U.S. state:
| Santana Row: | 11.7% |
| San Jose: | 10.4% |
Percentage of native residents but born outside the U.S.:
| Here: | 2.0% |
| city: | 1.7% |
Percentage of foreign born residents:
| Here: | 36.4% |
| San Jose: | 41.8% |
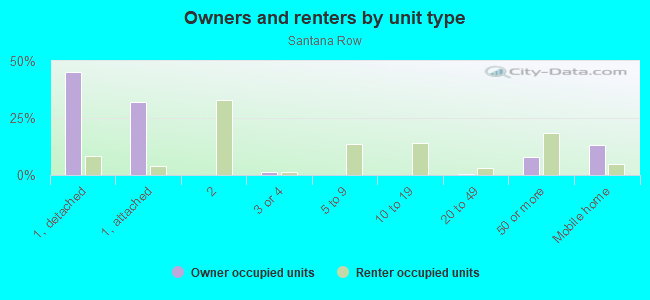
Owner-occupied
Renter-occupied

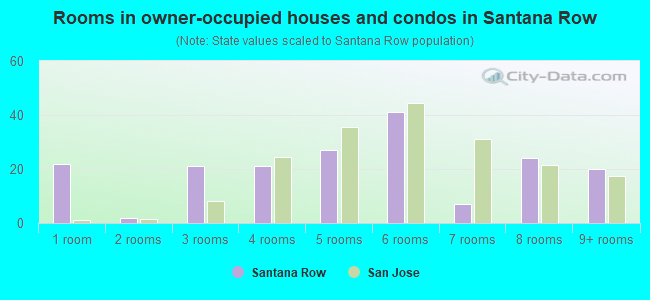
- Rooms in owner-occupied houses and condos in Santana Row
- 221 room
- 22 rooms
- 213 rooms
- 214 rooms
- 275 rooms
- 416 rooms
- 77 rooms
- 248 rooms
- 209+ rooms
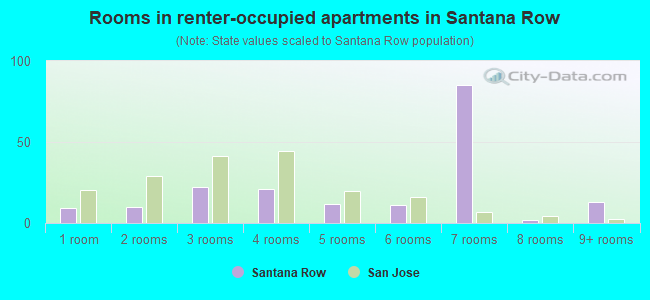
- Rooms in renter-occupied apartments in Santana Row
- 91 room
- 102 rooms
- 223 rooms
- 214 rooms
- 125 rooms
- 116 rooms
- 857 rooms
- 28 rooms
- 139+ rooms
Owner-occupied
Renter-occupied
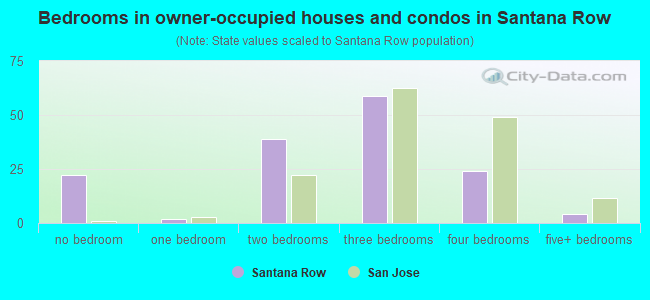
- Bedrooms in owner-occupied houses and condos in Santana Row
- 22no bedroom
- 21 bedroom
- 392 bedrooms
- 593 bedrooms
- 244 bedrooms
- 45+ bedrooms
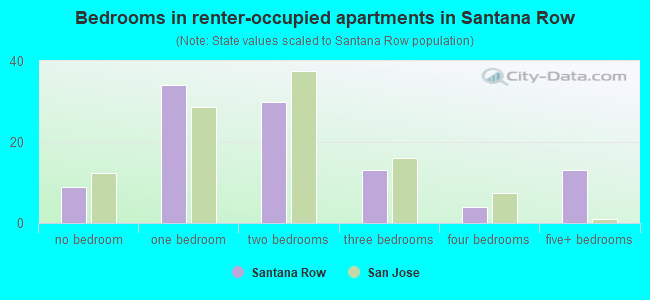
- Bedrooms in renter-occupied apartments in Santana Row
- 9no bedroom
- 341 bedroom
- 302 bedrooms
- 133 bedrooms
- 44 bedrooms
- 135+ bedrooms
Average number of cars or other vehicles available in houses/condos:
Average number of cars or other vehicles available in apartments:
| This neighborhood: | |
| San Jose: |
Average number of cars or other vehicles available in apartments:
| Here: | 1.4 |
| city: | 1.6 |
Percentage of units with a mortgage:
| Santana Row: | 69.2% |
| San Jose: | 66.9% |
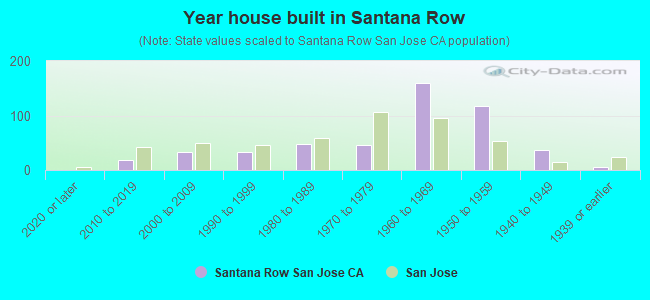
- Year house built in Santana Row
- 02020 or later
- 182010 to 2019
- 332000 to 2009
- 331990 to 1999
- 481980 to 1989
- 451970 to 1979
- 1601960 to 1969
- 1171950 to 1959
- 361940 to 1949
- 51939 or earlier
City-data.com crime index for city in 2020 (higher means more crime):
| City: | 268.4 |
| U.S. average: | 219.5 |
Travel time to work (commute)
![Travel time to work (commute)]()
- 12Less than 5 minutes
- 275 to 9 minutes
- 4710 to 14 minutes
- 7415 to 19 minutes
- 9920 to 24 minutes
- 825 to 29 minutes
- 7530 to 34 minutes
- 1035 to 39 minutes
- 2640 to 44 minutes
- 3545 to 59 minutes
- 960 to 89 minutes
- 2690 or more minutes

Means of transportation to work
![Means of transportation to work]()
- 59.9%61Drove a car alone
- 13.7%14Carpooled
- 18.6%19Bus
- 2.0%2Long-distance train or commuter rail
- 2.0%2Light rail, streetcar or trolley
- 27.5%28Motorcycle
- 10.8%11Bicycle
- 83.4%85Walked
- 23.5%24Other means
- 23.5%24Worked at home

Time leaving home to go to work
![Time leaving home to go to work]()
- 212:00 a.m. to 4:59 a.m.
- 125:00 a.m. to 5:29 a.m.
- 165:30 a.m. to 5:59 a.m.
- 446:00 a.m. to 6:29 a.m.
- 46:30 a.m. to 6:59 a.m.
- 557:00 a.m. to 7:29 a.m.
- 927:30 a.m. to 7:59 a.m.
- 498:00 a.m. to 8:29 a.m.
- 458:30 a.m. to 8:59 a.m.
- 659:00 a.m. to 9:59 a.m.
- 710:00 a.m. to 10:59 a.m.
- 811:00 a.m. to 11:59 a.m.
- 1812:00 p.m. to 3:59 p.m.
- 294:00 p.m. to 11:59 p.m.

Occupations of males:
- Percentage of males in management occupations (except farmers):
Here: 41.4% city: 13.0%
- Percentage of males in business and financial operations occupations:
Here: 20.8% city: 4.6%
- Percentage of males in computer and mathematical occupations:
Here: 15.8% city: 13.6%
- Percentage of males in architecture and engineering occupations:
Here: 12.5% city: 10.2%
- Percentage of males in life, physical, and social science occupations:
Here: 2.6% city: 1.1%
- Percentage of males in community and social services occupations:
Here: 3.6% city: 0.8%
- Percentage of males in legal occupations:
Here: 18.2% city: 0.8%
- Percentage of males in education, training, and library occupations:
Here: 6.0% city: 2.8%
- Percentage of males in arts, design, entertainment, sports, and media occupations:
Here: 5.9% city: 1.8%
- Percentage of males in healthcare practitioners and technical occupations:
Here: 2.7% city: 2.0%
- Percentage of males in construction, extraction, and maintenance occupations:
Here: 36.4% city: 7.8%
- Percentage of males in production occupations:
Here: 11.9% city: 5.5%
- Percentage of males in transportation occupations:
Here: 14.7% city: 3.6%
- Percentage of males in material moving occupations:
Here: 2.2% city: 3.1%
Occupations of females:
- Percentage of females in business and financial operations occupations:
Here: 23.4% city: 8.6%
- Percentage of females in computer and mathematical occupations:
Here: 36.5% city: 5.4%
- Percentage of females in architecture and engineering occupations:
Here: 21.8% city: 2.8%
- Percentage of females in life, physical, and social science occupations:
Here: 7.6% city: 1.7%
- Percentage of females in community and social services occupations:
Here: 7.5% city: 1.8%
- Percentage of females in healthcare practitioners and technical occupations:
Here: 2.8% city: 6.8%
- Percentage of females in sales and office occupations:
Here: 43.8% city: 22.0%
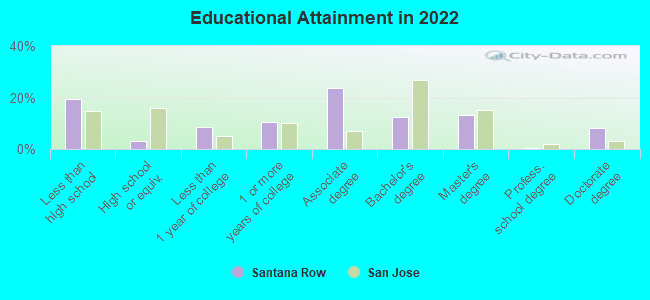
Education in this neighborhood (subdivision or community):
- Percentage of people 3 years and older in K-12 schools:
Santana Row: 66.9% San Jose: 16.1%
- Percentage of people 3 years and older in undergraduate colleges:
Santana Row: 10.7% San Jose: 6.5%
- Percentage of people 3 years and older in grad. or professional schools:
Santana Row: 2.4% San Jose: 2.0%
- Percentage of students K-12 enrolled in private schools:
Santana Row: 61.1% San Jose: 14.9%
Percentage of population below poverty level:
| Santana Row: | 7.1% |
| San Jose: | 9.0% |
Median year renter moved in (as recorded in 2022):
| Santana Row: | 2017 |
| San Jose: | 2020 |
Percentage of married-couple families with both working:
| Santana Row: | 100.0% |
| San Jose: | 72.5% |
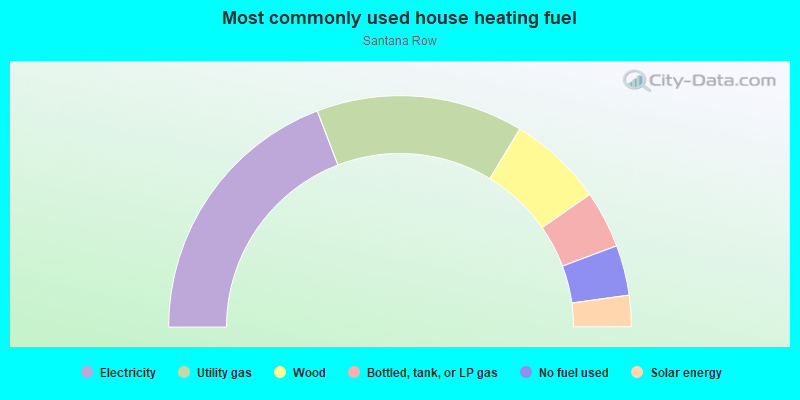
- 38.4%Electricity
- 29.0%Utility gas
- 13.3%Wood
- 8.0%Bottled, tank, or LP gas
- 7.0%No fuel used
- 4.4%Solar energy
Roads and streets:
Villa Centre Way
Length: 0.32 miles
Directions: E-W, N-S, SE-NW, SW-NE
Address range: 500 to 799
Directions: E-W, N-S, SE-NW, SW-NE
Address range: 500 to 799
Hemlock Ave
Length: 0.26 miles
Direction: E-W
Address range: 2800 to 2999
Direction: E-W
Address range: 2800 to 2999
Tisch Way
Length: 0.25 miles
Direction: E-W
Direction: E-W
Hatton St
Length: 0.09 miles
Directions: N-S, SW-NE
Directions: N-S, SW-NE
Dudley Ave
Length: 0.08 miles
Direction: N-S
Address range: 500 to 599
Direction: N-S
Address range: 500 to 599
S Baywood Ave
Length: 0.07 miles
Direction: N-S
Direction: N-S