Stonycreek neighborhood in Norristown, Pennsylvania (PA), 19403 detailed profile
Settings
X

Business Search - 14 Million verified businesses
Area: 0.082 square miles
Population: 213
Population density:
| Stonycreek: | 2,613 people per square mile |
| Norristown: | 10,128 people per square mile |

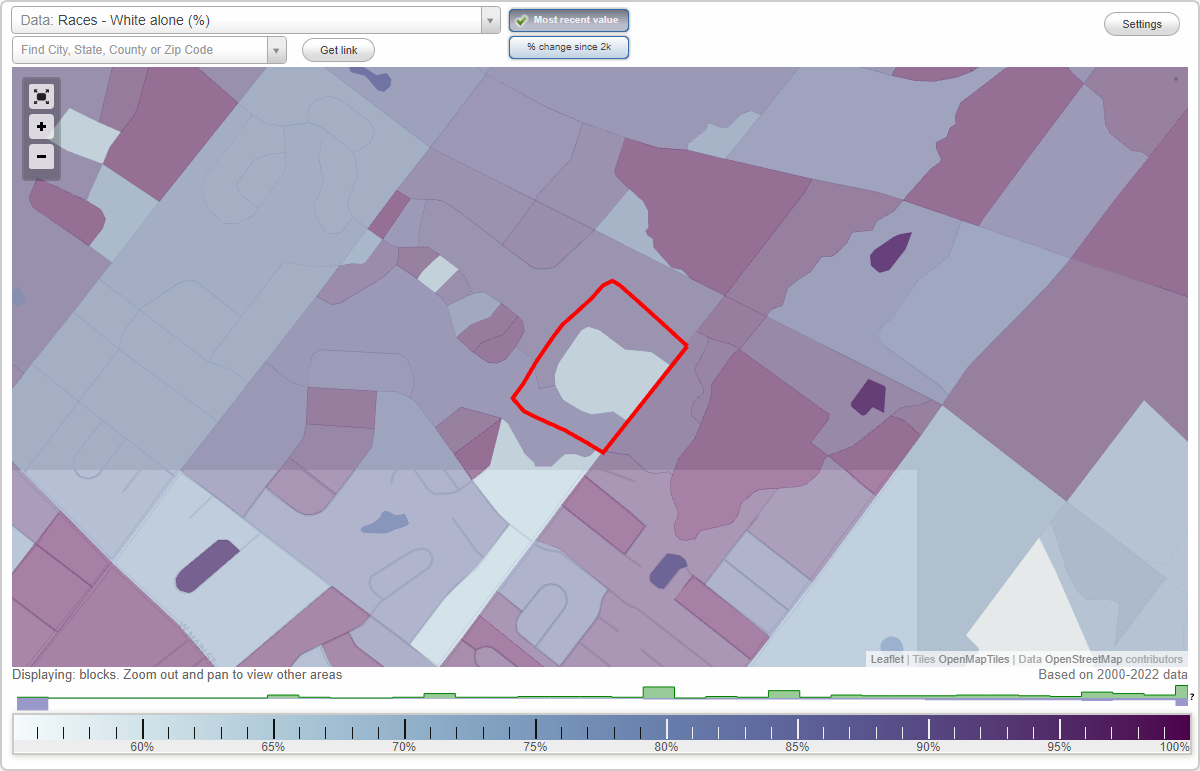
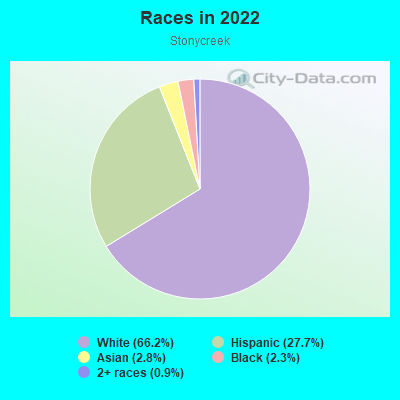
- 14166.2%White
- 5927.7%Hispanic or Latino
- 62.8%Asian
- 52.3%Black
- 20.9%Two or more races
Median household income in 2022:
| Stonycreek: | $79,087 |
| Norristown: | $59,068 |
Distribution of median household income
![Distribution of median household income]()
- 7Less than $10,000
- 7$10,000 to $19,999
- 5$20,000 to $29,999
- 9$30,000 to $39,999
- 5$40,000 to $49,999
- 15$50,000 to $59,999
- 9$60,000 to $74,999
- 11$75,000 to $99,999
- 7$100,000 to $124,999
- 5$125,000 to $149,999
- 7$150,000 to $199,999
- 12$200,000 or more

Distribution of owner-occupied house/condo value
![Distribution of owner-occupied house/condo value]()
- 7Less than $50,000
- 23$50,000 to $99,999
- 13$100,000 to $149,999
- 13$150,000 to $199,999
- 5$200,000 to $249,999
- 15$250,000 to $299,999
- 22$300,000 to $399,999
- 9$400,000 to $499,999
- 4$500,000 to $749,999
- 2$750,000 to $999,999

Distribution of rent paid by renters
![Distribution of rent paid by renters]()
- 3$200 to $299
- 8$300 to $399
- 8$400 to $499
- 4$700 to $799
- 1$800 to $899
- 3$900 to $999
- 3$1,000 to $1,249
- 3$1,250 to $1,499
- 3$1,500 to $1,999
- 9$2,000 or more

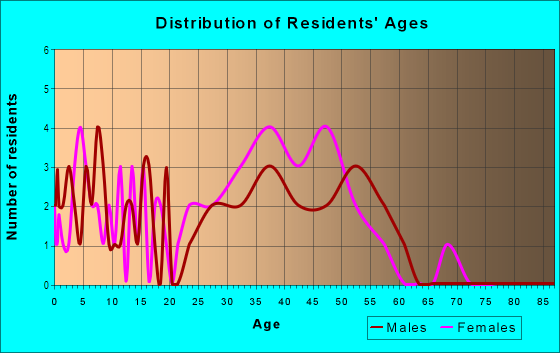
| Males: | 107 |
| Females: | 105 |
Males:
| This neighborhood: | 40.6 years |
| Whole city: | 30.3 years |
| This neighborhood: | 45.5 years |
| Whole city: | 35.2 years |
Average household size:
| Stonycreek: | 2.2 people |
| Norristown: | 2.7 people |
Percentage of family households:
| Stonycreek: | 53.0% |
| Norristown: | 52.1% |
| Here: | 45.6% |
| Norristown: | 30.6% |
Percentage of married-couple families with children (among all households):
| Stonycreek: | 32.1% |
| Norristown: | 20.9% |
Percentage of single-mother households (among all households):
| Stonycreek: | 6.0% |
| Norristown: | 12.5% |
Percentage of never married males 15 years old and over:
Percentage of never married females 15 years old and over:
| Stonycreek: | 20.6% |
| Norristown: | 25.7% |
Percentage of never married females 15 years old and over:
| Stonycreek: | 17.6% |
| borough: | 24.1% |
Percentage of people that speak English not well or not at all:
| Stonycreek: | 5.4% |
| Norristown: | 7.5% |
Percentage of people born in this state:
Percentage of people born in another U.S. state:
Percentage of native residents but born outside the U.S.:
Percentage of foreign born residents:
| Here: | 70.3% |
| Norristown: | 65.3% |
Percentage of people born in another U.S. state:
| Stonycreek: | 13.5% |
| Norristown: | 14.3% |
Percentage of native residents but born outside the U.S.:
| Here: | 1.0% |
| borough: | 3.9% |
Percentage of foreign born residents:
| Here: | 15.2% |
| Norristown: | 16.5% |
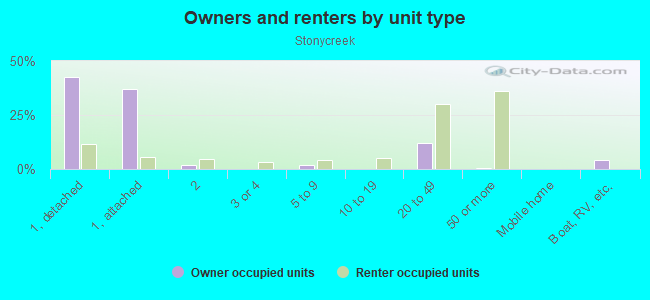
Owner-occupied
Renter-occupied

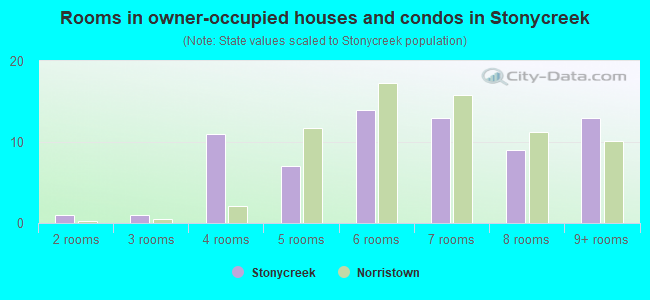
- Rooms in owner-occupied houses and condos in Stonycreek
- 01 room
- 12 rooms
- 13 rooms
- 114 rooms
- 75 rooms
- 146 rooms
- 137 rooms
- 98 rooms
- 139+ rooms
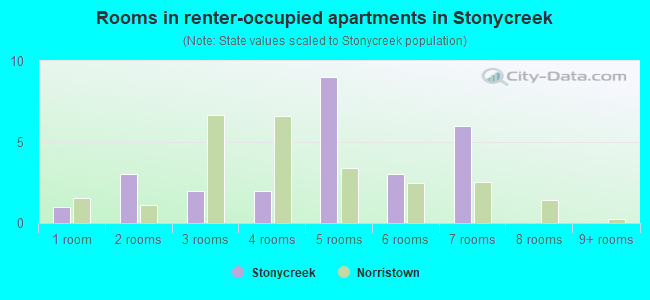
- Rooms in renter-occupied apartments in Stonycreek
- 11 room
- 32 rooms
- 23 rooms
- 24 rooms
- 95 rooms
- 36 rooms
- 67 rooms
- 08 rooms
- 09+ rooms
Owner-occupied
Renter-occupied
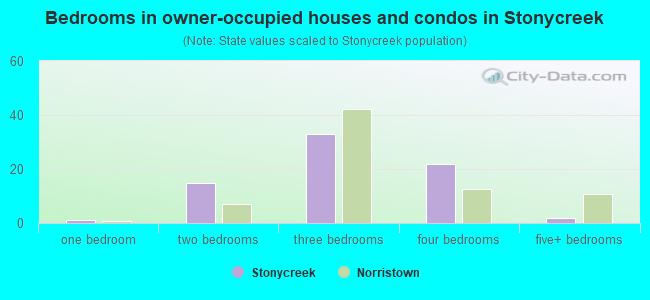
- Bedrooms in owner-occupied houses and condos in Stonycreek
- 0no bedroom
- 11 bedroom
- 152 bedrooms
- 333 bedrooms
- 224 bedrooms
- 25+ bedrooms
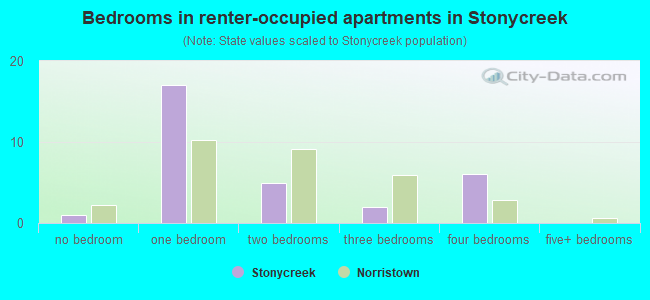
- Bedrooms in renter-occupied apartments in Stonycreek
- 1no bedroom
- 171 bedroom
- 52 bedrooms
- 23 bedrooms
- 64 bedrooms
- 05+ bedrooms
Average number of cars or other vehicles available in houses/condos:
Average number of cars or other vehicles available in apartments:
| This neighborhood: | 2.2 |
| Norristown: | 2.0 |
Average number of cars or other vehicles available in apartments:
| Here: | 0.9 |
| borough: | 1.0 |
Percentage of units with a mortgage:
| Stonycreek: | 64.2% |
| Norristown: | 74.7% |
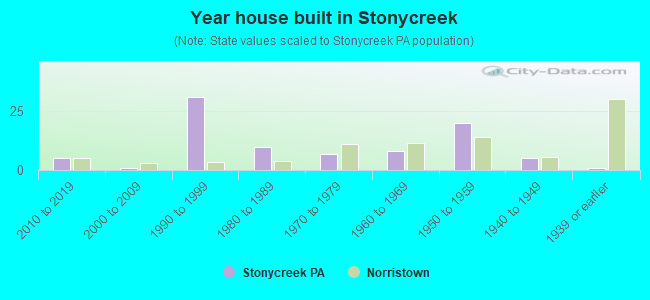
- Year house built in Stonycreek
- 02020 or later
- 52010 to 2019
- 12000 to 2009
- 311990 to 1999
- 101980 to 1989
- 71970 to 1979
- 81960 to 1969
- 201950 to 1959
- 51940 to 1949
- 11939 or earlier
City-data.com crime index for borough in 2020 (higher means more crime):
| City: | 16.0 |
| U.S. average: | 219.5 |
Travel time to work (commute)
![Travel time to work (commute)]()
- 1Less than 5 minutes
- 175 to 9 minutes
- 810 to 14 minutes
- 2515 to 19 minutes
- 1520 to 24 minutes
- 525 to 29 minutes
- 3530 to 34 minutes
- 535 to 39 minutes
- 140 to 44 minutes
- 145 to 59 minutes
- 460 to 89 minutes
- 190 or more minutes

Means of transportation to work
![Means of transportation to work]()
- 62.0%77Drove a car alone
- 13.7%17Carpooled
- 0.8%1Long-distance train or commuter rail
- 0.8%1Other means
- 21.7%27Worked at home

Time leaving home to go to work
![Time leaving home to go to work]()
- 712:00 a.m. to 4:59 a.m.
- 95:00 a.m. to 5:29 a.m.
- 45:30 a.m. to 5:59 a.m.
- 106:00 a.m. to 6:29 a.m.
- 66:30 a.m. to 6:59 a.m.
- 177:00 a.m. to 7:29 a.m.
- 237:30 a.m. to 7:59 a.m.
- 108:00 a.m. to 8:29 a.m.
- 138:30 a.m. to 8:59 a.m.
- 159:00 a.m. to 9:59 a.m.
- 510:00 a.m. to 10:59 a.m.
- 712:00 p.m. to 3:59 p.m.
- 84:00 p.m. to 11:59 p.m.

Occupations of males:
- Percentage of males in management occupations (except farmers):
Here: 12.3% borough: 9.4%
- Percentage of males in computer and mathematical occupations:
Here: 2.5% borough: 3.0%
- Percentage of males in life, physical, and social science occupations:
Here: 3.4% borough: 0.9%
- Percentage of males in legal occupations:
Here: 14.2% borough: 0.7%
- Percentage of males in education, training, and library occupations:
Here: 6.5% borough: 1.0%
- Percentage of males in arts, design, entertainment, sports, and media occupations:
Here: 2.6% borough: 0.9%
- Percentage of males in service occupations:
Here: 8.8% borough: 20.6%
- Percentage of males in sales and office occupations:
Here: 13.6% borough: 10.6%
- Percentage of males in construction, extraction, and maintenance occupations:
Here: 19.3% borough: 10.7%
- Percentage of males in production occupations:
Here: 7.4% borough: 7.7%
- Percentage of males in transportation occupations:
Here: 4.0% borough: 8.7%
- Percentage of males in material moving occupations:
Here: 7.0% borough: 8.2%
Occupations of females:
- Percentage of females in management occupations (except farmers):
Here: 4.9% borough: 11.3%
- Percentage of females in business and financial operations occupations:
Here: 11.4% borough: 5.6%
- Percentage of females in computer and mathematical occupations:
Here: 2.4% borough: 1.9%
- Percentage of females in architecture and engineering occupations:
Here: 5.6% borough: 0.3%
- Percentage of females in life, physical, and social science occupations:
Here: 2.4% borough: 1.7%
- Percentage of females in community and social services occupations:
Here: 2.8% borough: 1.3%
- Percentage of females in education, training, and library occupations:
Here: 10.6% borough: 9.2%
- Percentage of females in healthcare practitioners and technical occupations:
Here: 4.7% borough: 7.3%
- Percentage of females in service occupations:
Here: 17.3% borough: 22.2%
- Percentage of females in sales and office occupations:
Here: 43.5% borough: 28.9%
- Percentage of females in production occupations:
Here: 2.4% borough: 6.1%
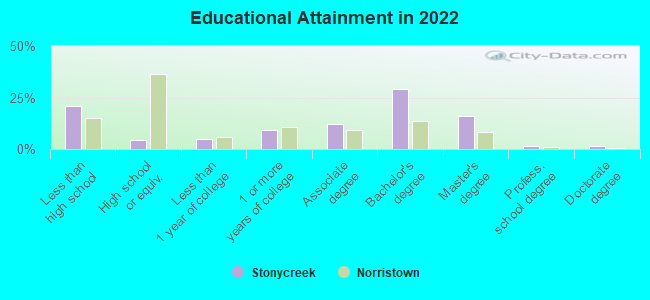
Education in this neighborhood (subdivision or community):
- Percentage of people 3 years and older in K-12 schools:
Stonycreek: 21.5% Norristown: 19.2%
- Percentage of people 3 years and older in undergraduate colleges:
Stonycreek: 7.7% Norristown: 4.1%
- Percentage of people 3 years and older in grad. or professional schools:
Stonycreek: 2.6% Norristown: 0.9%
- Percentage of students K-12 enrolled in private schools:
Stonycreek: 21.4% Norristown: 16.7%
Percentage of population below poverty level:
| Stonycreek: | 9.9% |
| Norristown: | 18.4% |
Median year owner moved in (as recorded in 2022):
| Stonycreek: | 2011 |
| Norristown: | 2008 |
Percentage of married-couple families with both working:
| Stonycreek: | 49.8% |
| Norristown: | 64.2% |
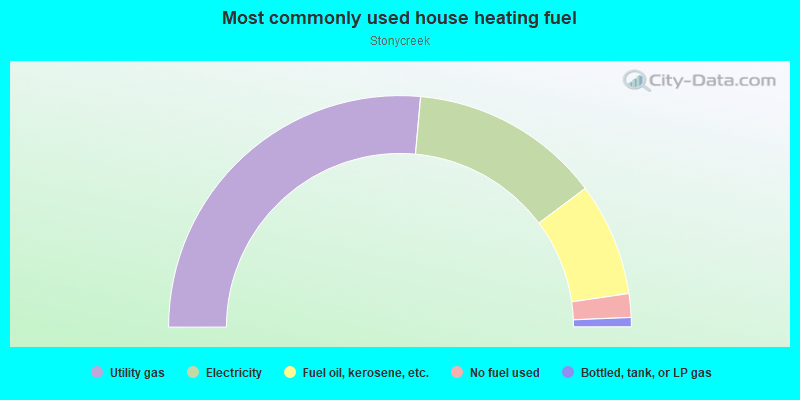
- 52.8%Utility gas
- 26.7%Electricity
- 15.8%Fuel oil, kerosene, etc.
- 3.3%No fuel used
- 1.3%Bottled, tank, or LP gas
Roads and streets:
Alexander Dr
Length: 0.68 miles
Directions: E-W, N-S, SE-NW, SW-NE
Address range: 2100 to 21010
Directions: E-W, N-S, SE-NW, SW-NE
Address range: 2100 to 21010
Burnside Ave
Length: 0.28 miles
Direction: SW-NE
Address range: 400 to 439
Direction: SW-NE
Address range: 400 to 439
Steven St
Length: 0.12 miles
Directions: N-S, SE-NW
Address range: 400 to 499
Directions: N-S, SE-NW
Address range: 400 to 499
Laurel Ln
Length: 0.05 miles
Direction: E-W
Address range: 400 to 499
Direction: E-W
Address range: 400 to 499