Norristown, Pennsylvania
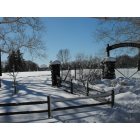
Norristown: Montgomery Cemetary, Hartranft Ave, Norristown, PA
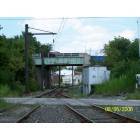
Norristown: Water Street Crossing
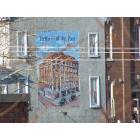
Norristown: West Main St.
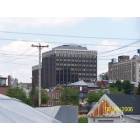
Norristown: One Montgomery Plaza
- add
your
Submit your own pictures of this borough and show them to the world
- OSM Map
- General Map
- Google Map
- MSN Map
Population change since 2000: +14.4%
 |
| Males: 17,870 | |
| Females: 17,925 |
| Median resident age: | 32.3 years |
| Pennsylvania median age: | 40.9 years |
Zip codes: 19401.
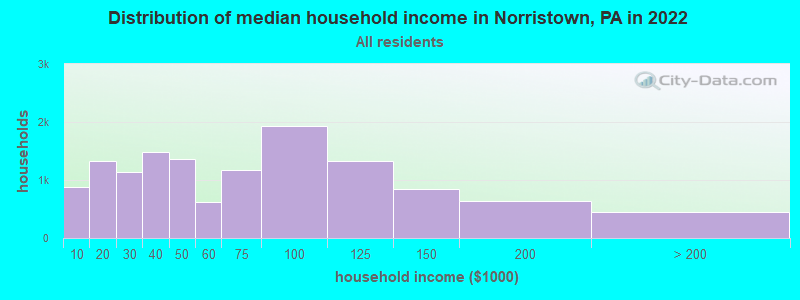
| Norristown: | $58,722 |
| PA: | $71,798 |
Estimated per capita income in 2022: $27,171 (it was $17,977 in 2000)
Norristown borough income, earnings, and wages data
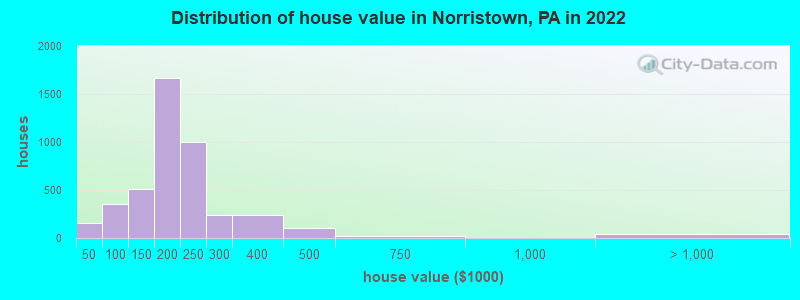
Estimated median house or condo value in 2022: $203,254 (it was $85,800 in 2000)
| Norristown: | $203,254 |
| PA: | $245,500 |
Mean prices in 2022: all housing units: $222,919; detached houses: $355,980; townhouses or other attached units: $196,892; in 2-unit structures: $284,004; in 5-or-more-unit structures: $212,586
Median gross rent in 2022: $1,302.
(13.1% for White Non-Hispanic residents, 18.9% for Black residents, 18.7% for Hispanic or Latino residents, 10.2% for American Indian residents, 32.5% for other race residents, 18.9% for two or more races residents)
Detailed information about poverty and poor residents in Norristown, PA


Compare current foreclosures in Norristown, PA:
| Photo | Address | Area | Beds / Baths | Price | Details |
|---|---|---|---|---|---|

|
#1
Egypt Rd
Norristown, PA 19403
|
1,440 sq. feet
|
1 baths 3 beds |
$719,090
|
show details |

|
#2
Deerfield Dr
Norristown, PA 19403
|
2,082 sq. feet
|
2 baths 3 beds |
$396,413
|
show details |

|
#3
Dekalb Pike
Norristown, PA 19401
|
2,583 sq. feet
|
2 baths 4 beds |
$255,189
|
show details |

|
#4
Buttonwood St
Norristown, PA 19401
|
1,080 sq. feet
|
1 baths 3 beds |
show details | |

|
#5
E Oak St
Norristown, PA 19401
|
1,544 sq. feet
|
2 baths 3 beds |
show details | |

|
#6
S Trooper Rd
Norristown, PA 19403
|
1,061 sq. feet
|
1 baths 4 beds |
show details | |

|
#7
Robin Ln
Norristown, PA 19401
|
1,817 sq. feet
|
2 baths 4 beds |
show details | |

|
#8
Calamia Dr
Norristown, PA 19401
|
1,000 sq. feet
|
2 baths 3 beds |
show details | |

|
#9
Lincoln Ter
Norristown, PA 19403
|
2,681 sq. feet
|
3 baths 4 beds |
show details | |

|
#10
W Beech St
Norristown, PA 19401
|
1,216 sq. feet
|
1 baths 3 beds |
show details |
| Photo | Address | Area | Beds / Baths | Price | Details |
|---|---|---|---|---|---|

|
#11
W Johnson Hwy
Norristown, PA 19401
|
1,000 sq. feet
|
1 baths 3 beds |
show details | |

|
#12
E Fornance St
Norristown, PA 19401
|
1,660 sq. feet
|
1 baths 3 beds |
show details | |

|
#13
Swede St
Norristown, PA 19401
|
- sq. feet
|
- baths - beds |
$92,691
|
show details |

|
#14
Stanbridge St
Norristown, PA 19401
|
1,616 sq. feet
|
1 baths 3 beds |
show details | |

|
#15
Calamia Dr
Norristown, PA 19401
|
1,000 sq. feet
|
1 baths 3 beds |
show details | |

|
#16
Sunset Ave
Norristown, PA 19403
|
1,778 sq. feet
|
1 baths 3 beds |
show details | |

|
#17
Middleton Pl
Norristown, PA 19403
|
1,058 sq. feet
|
1 baths 2 beds |
show details | |

|
#18
Sunset Ave
Norristown, PA 19403
|
1,778 sq. feet
|
1 baths 3 beds |
show details | |

|
#19
Dekalb Pike
Norristown, PA 19401
|
2,583 sq. feet
|
2 baths 4 beds |
show details | |

|
#20
Winterfall Ave
Norristown, PA 19403
|
1,472 sq. feet
|
1 baths 2 beds |
show details |
| Photo | Address | Area | Beds / Baths | Price | Details |
|---|---|---|---|---|---|

|
#21
Arch St
Norristown, PA 19401
|
1,812 sq. feet
|
1 baths 3 beds |
show details | |

|
#22
Crimson Dr
Norristown, PA 19401
|
2,239 sq. feet
|
2 baths 4 beds |
show details | |

|
#23
Barley Sheaf Dr
Norristown, PA 19403
|
1,626 sq. feet
|
2 baths 2 beds |
show details | |

|
#24
E Mount Kirk Ave
Norristown, PA 19403
|
1,764 sq. feet
|
1 baths 3 beds |
show details | |

|
#25
New Hope St
Norristown, PA 19401
|
1,194 sq. feet
|
1 baths 3 beds |
show details | |

|
#26
Hamilton St
Norristown, PA 19401
|
3,534 sq. feet
|
2 baths 6 beds |
show details | |

|
#27
Dartmouth Dr
Norristown, PA 19401
|
1,360 sq. feet
|
1 baths 3 beds |
show details | |

|
#28
E Mount Kirk Ave
Norristown, PA 19403
|
1,554 sq. feet
|
1 baths 4 beds |
show details | |

|
#29
Hartranft Ave
Norristown, PA 19401
|
1,428 sq. feet
|
1 baths 3 beds |
show details | |

|
#30
Deerfield Dr
Norristown, PA 19403
|
2,082 sq. feet
|
2 baths 3 beds |
show details |
| Photo | Address | Area | Beds / Baths | Price | Details |
|---|---|---|---|---|---|

|
#31
Brownstone Dr
Norristown, PA 19401
|
2,492 sq. feet
|
2 baths 3 beds |
show details | |

|
#32
N Parkview Dr
Norristown, PA 19403
|
2,602 sq. feet
|
2 baths 4 beds |
show details | |

|
#33
Kohn St
Norristown, PA 19401
|
1,184 sq. feet
|
1 baths 3 beds |
show details | |

|
#34
Deerfield Dr
Norristown, PA 19403
|
2,082 sq. feet
|
2 baths 3 beds |
show details | |

|
#35
Hamilton St
Norristown, PA 19401
|
1,408 sq. feet
|
1 baths 3 beds |
show details | |

|
#36
Arch St
Norristown, PA 19401
|
1,844 sq. feet
|
1 baths 4 beds |
show details | |

|
#37
Bayless Pl
Norristown, PA 19403
|
1,260 sq. feet
|
2 baths 3 beds |
show details | |

|
#38
Sunset Ave
Norristown, PA 19403
|
1,778 sq. feet
|
1 baths 3 beds |
show details | |

|
#39
E Marshall St
Norristown, PA 19401
|
1,896 sq. feet
|
1 baths 4 beds |
show details | |

|
#40
E Main St
Norristown, PA 19401
|
1,818 sq. feet
|
1 baths 5 beds |
show details |
| Photo | Address | Area | Beds / Baths | Price | Details |
|---|---|---|---|---|---|

|
#41
Kohn St
Norristown, PA 19401
|
1,258 sq. feet
|
1 baths 3 beds |
show details | |

|
#42
W Basin St
Norristown, PA 19401
|
1,232 sq. feet
|
1 baths 3 beds |
show details | |

|
#43
E Main St
Norristown, PA 19401
|
1,818 sq. feet
|
1 baths 5 beds |
show details | |

|
#44
Astor St
Norristown, PA 19401
|
1,824 sq. feet
|
1 baths 5 beds |
show details | |

|
#45
Shirlene Rd
Norristown, PA 19403
|
1,725 sq. feet
|
1 baths 3 beds |
show details | |

|
#46
Abbott Ct
Norristown, PA 19403
|
2,442 sq. feet
|
2 baths 3 beds |
show details | |

|
#47
Eagleville Rd
Norristown, PA 19403
|
1,037 sq. feet
|
1 baths 2 beds |
show details | |

|
#48
Brownstone Dr
Norristown, PA 19401
|
2,492 sq. feet
|
2 baths 3 beds |
show details | |

|
#49
Stony Way
Norristown, PA 19403
|
1,228 sq. feet
|
2 baths 3 beds |
show details | |

|
Check over 1 million property listings on Foreclosure.com!
|
browse all offers | |||


- 12,24634.0%Black alone
- 10,42028.9%Hispanic
- 10,18828.3%White alone
- 3,3979.4%Two or more races
- 9512.6%Asian alone
- 1670.5%Other race alone
- 530.1%Native Hawaiian and Other
Pacific Islander alone
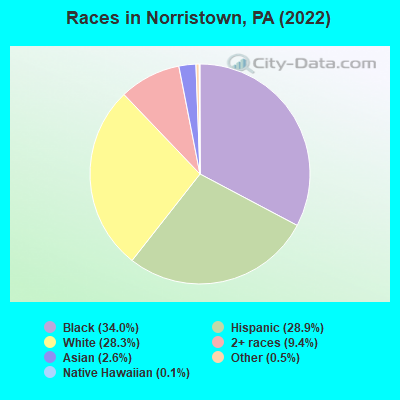
Races in Norristown detailed stats: ancestries, foreign born residents, place of birth
According to our research of Pennsylvania and other state lists, there were 115 registered sex offenders living in Norristown, Pennsylvania as of April 26, 2024.
The ratio of all residents to sex offenders in Norristown is 302 to 1.
Type |
2009 |
2010 |
2011 |
2012 |
2013 |
2014 |
2015 |
2016 |
2017 |
2018 |
2019 |
2020 |
2022 |
|---|---|---|---|---|---|---|---|---|---|---|---|---|---|
| Murders (per 100,000) | 10 (31.3) | 6 (17.5) | 4 (11.6) | 4 (11.6) | 3 (8.7) | 2 (5.8) | 4 (11.6) | 2 (5.8) | 4 (11.6) | 5 (14.5) | 4 (11.6) | 3 (8.7) | 9 (25.1) |
| Rapes (per 100,000) | 18 (56.4) | 23 (67.0) | 12 (34.9) | 10 (28.9) | 15 (43.5) | 5 (14.5) | 6 (17.4) | 2 (5.8) | 6 (17.5) | 10 (29.0) | 4 (11.6) | 1 (2.9) | 6 (16.7) |
| Robberies (per 100,000) | 197 (617.4) | 172 (501.1) | 198 (575.0) | 173 (500.2) | 185 (537.0) | 143 (415.1) | 124 (359.2) | 83 (241.1) | 103 (299.6) | 68 (196.9) | 100 (290.4) | 68 (198.0) | 66 (183.9) |
| Assaults (per 100,000) | 145 (454.4) | 193 (562.3) | 153 (444.3) | 130 (375.9) | 121 (351.2) | 107 (310.6) | 93 (269.4) | 61 (177.2) | 74 (215.3) | 56 (162.2) | 62 (180.1) | 66 (192.2) | 81 (225.7) |
| Burglaries (per 100,000) | 205 (642.5) | 229 (667.2) | 241 (699.9) | 293 (847.2) | 274 (795.3) | 220 (638.6) | 107 (310.0) | 95 (276.0) | 67 (194.9) | 86 (249.1) | 70 (203.3) | 60 (174.7) | 69 (192.3) |
| Thefts (per 100,000) | 646 (2,025) | 688 (2,004) | 641 (1,862) | 613 (1,772) | 690 (2,003) | 590 (1,712) | 524 (1,518) | 465 (1,351) | 463 (1,347) | 376 (1,089) | 411 (1,194) | 425 (1,238) | 474 (1,321) |
| Auto thefts (per 100,000) | 134 (419.9) | 131 (381.7) | 115 (334.0) | 96 (277.6) | 104 (301.9) | 72 (209.0) | 53 (153.5) | 58 (168.5) | 44 (128.0) | 49 (141.9) | 62 (180.1) | 83 (241.7) | 179 (498.8) |
| Arson (per 100,000) | 7 (21.9) | 8 (23.3) | 5 (14.5) | 11 (31.8) | 7 (20.3) | 4 (11.6) | 6 (17.4) | 0 (0.0) | 2 (5.8) | 2 (5.8) | 1 (2.9) | 4 (11.6) | 2 (5.6) |
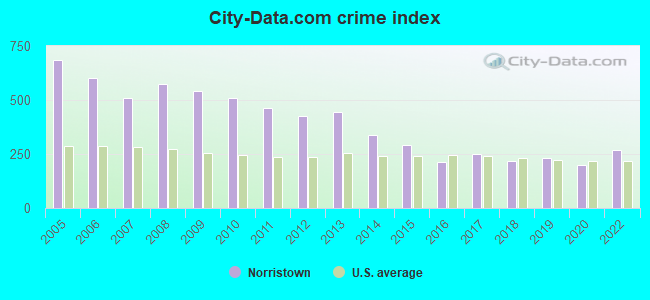
| City-Data.com crime index | 543.5 | 508.8 | 462.7 | 423.9 | 443.5 | 339.8 | 293.4 | 210.9 | 247.9 | 216.0 | 232.1 | 198.7 | 270.0 |
The City-Data.com crime index weighs serious crimes and violent crimes more heavily. Higher means more crime, U.S. average is 246.1. It adjusts for the number of visitors and daily workers commuting into cities.
Crime rate in Norristown detailed stats: murders, rapes, robberies, assaults, burglaries, thefts, arson
Full-time law enforcement employees in 2021, including police officers: 80 (65 officers - 59 male; 6 female).
| Officers per 1,000 residents here: | 1.89 |
| Pennsylvania average: | 2.55 |
 Recent articles from our blog. Our writers, many of them Ph.D. graduates or candidates, create easy-to-read articles on a wide variety of topics.

 | The Future of Norristown (105 replies) |
| new resident - commute advice needed (17 replies) |
| Philly vs. Bala Cynwyd--Income Taxes (21 replies) |
| Methacton School/Norristown etc (6 replies) |
| Norristown High Speed Line parking (8 replies) |
| Norristown ? (2 replies) |
Latest news from Norristown, PA collected exclusively by city-data.com from local newspapers, TV, and radio stations
Ancestries: American (6.5%), Italian (6.2%), Irish (2.8%), Jamaican (2.3%), German (1.6%), Polish (1.4%).
Current Local Time: EST time zone
Incorporated on 03/31/1812
Elevation: 179 feet
Land area: 3.53 square miles.
Population density: 10,152 people per square mile (high).
6,129 residents are foreign born (11.8% Latin America, 2.1% Asia, 2.1% Africa).
| This borough: | 17.0% |
| Pennsylvania: | 7.3% |
Median real estate property taxes paid for housing units with mortgages in 2022: $4,752 (2.3%)
Median real estate property taxes paid for housing units with no mortgage in 2022: $4,105 (2.1%)
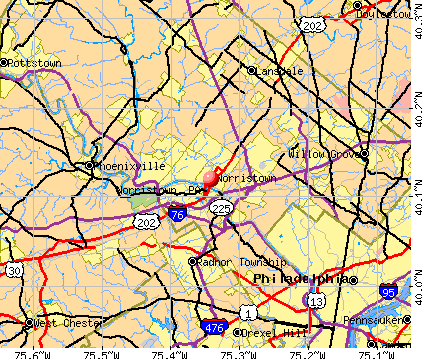
Nearest city with pop. 50,000+: Philadelphia, PA  (13.4 miles , pop. 1,517,550).
Nearest cities:
), ), Latitude: 40.12 N, Longitude: 75.34 W
Daytime population change due to commuting: -4,586 (-12.7%)
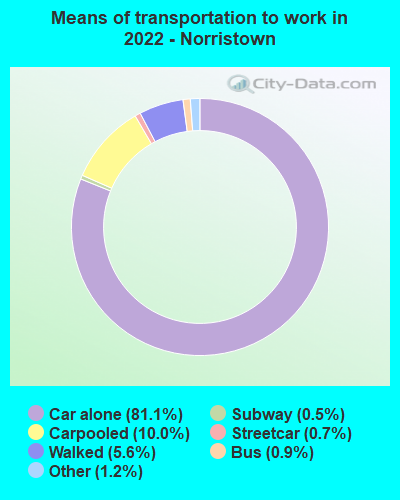
Workers who live and work in this borough: 5,084 (28.7%)
Property values in Norristown, PA
Norristown tourist attractions:
Norristown, Pennsylvania accommodation & food services, waste management - Economy and Business Data
| Here: | 2.4% |
| Pennsylvania: | 2.9% |
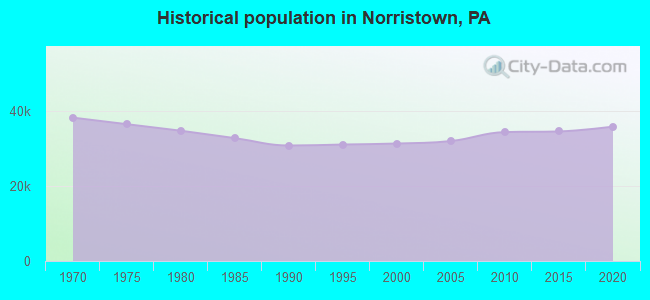
Population change in the 1990s: +727 (+2.4%).
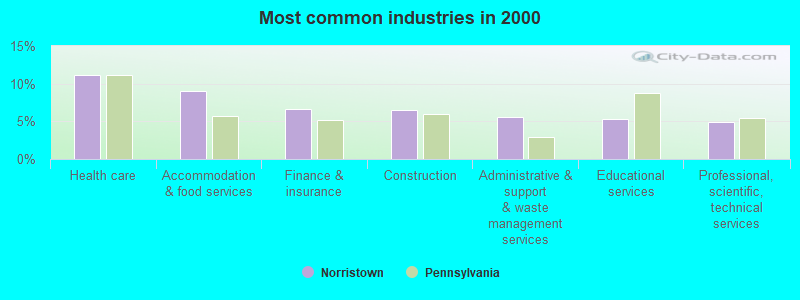
- Health care (11.1%)
- Accommodation & food services (9.0%)
- Finance & insurance (6.7%)
- Construction (6.5%)
- Administrative & support & waste management services (5.6%)
- Educational services (5.3%)
- Professional, scientific, technical services (4.9%)
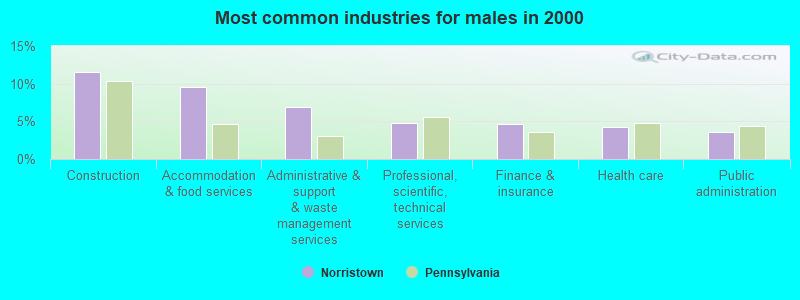
- Construction (11.6%)
- Accommodation & food services (9.5%)
- Administrative & support & waste management services (6.9%)
- Professional, scientific, technical services (4.8%)
- Finance & insurance (4.7%)
- Health care (4.2%)
- Public administration (3.6%)

- Health care (18.8%)
- Finance & insurance (8.9%)
- Accommodation & food services (8.5%)
- Educational services (7.6%)
- Professional, scientific, technical services (5.0%)
- Administrative & support & waste management services (4.2%)
- Social assistance (4.2%)
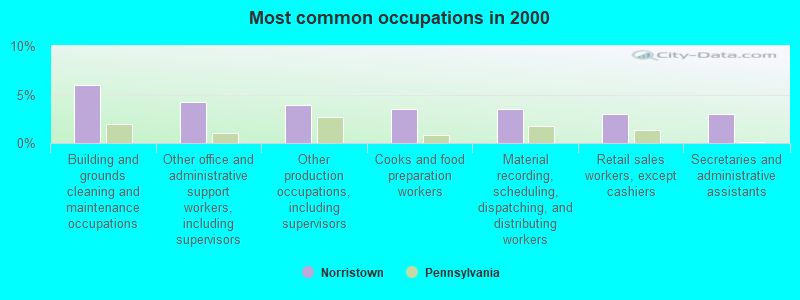
- Building and grounds cleaning and maintenance occupations (6.0%)
- Other office and administrative support workers, including supervisors (4.3%)
- Other production occupations, including supervisors (3.9%)
- Cooks and food preparation workers (3.5%)
- Material recording, scheduling, dispatching, and distributing workers (3.5%)
- Retail sales workers, except cashiers (3.0%)
- Secretaries and administrative assistants (3.0%)

- Building and grounds cleaning and maintenance occupations (7.8%)
- Cooks and food preparation workers (4.7%)
- Material recording, scheduling, dispatching, and distributing workers (4.6%)
- Other production occupations, including supervisors (4.5%)
- Computer specialists (4.2%)
- Driver/sales workers and truck drivers (4.1%)
- Construction traders workers except carpenters, electricians, painters, plumbers, and construction laborers (3.6%)

- Other office and administrative support workers, including supervisors (7.0%)
- Secretaries and administrative assistants (6.3%)
- Nursing, psychiatric, and home health aides (5.4%)
- Cashiers (4.5%)
- Information and record clerks, except customer service representatives (4.1%)
- Building and grounds cleaning and maintenance occupations (4.0%)
- Retail sales workers, except cashiers (3.3%)
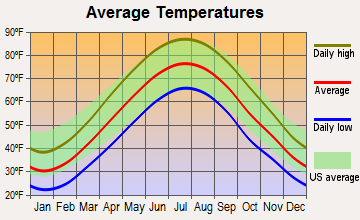
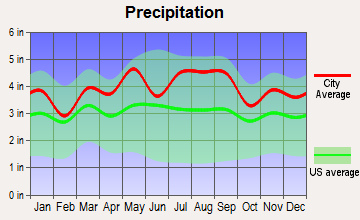
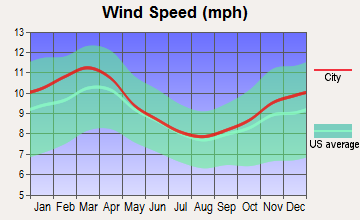
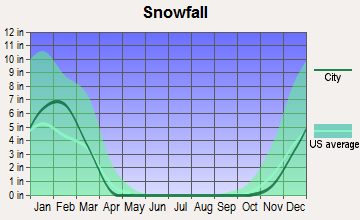
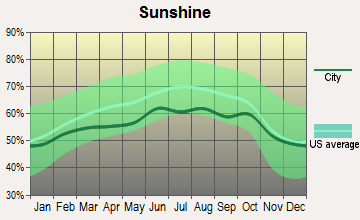
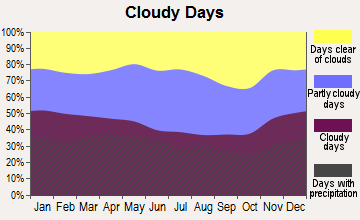
Average climate in Norristown, Pennsylvania
Based on data reported by over 4,000 weather stations

|
|

(lower is better)
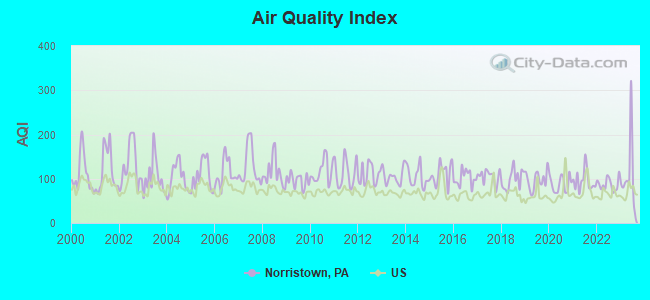
Air Quality Index (AQI) level in 2023 was 109. This is significantly worse than average.
| City: | 109 |
| U.S.: | 73 |
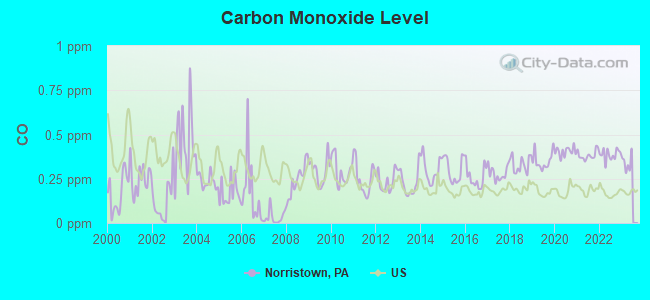
Carbon Monoxide (CO) [ppm] level in 2022 was 0.386. This is significantly worse than average. Closest monitor was 1.8 miles away from the city center.
| City: | 0.386 |
| U.S.: | 0.251 |
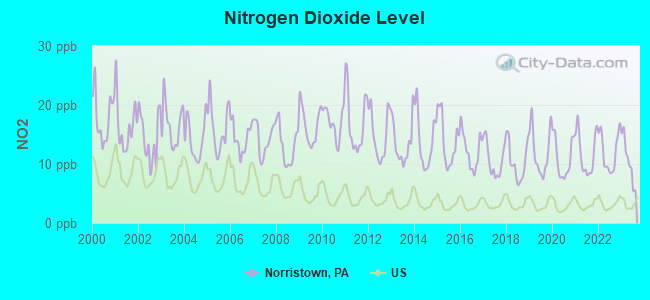
Nitrogen Dioxide (NO2) [ppb] level in 2023 was 10.6. This is significantly worse than average. Closest monitor was 1.8 miles away from the city center.
| City: | 10.6 |
| U.S.: | 5.1 |
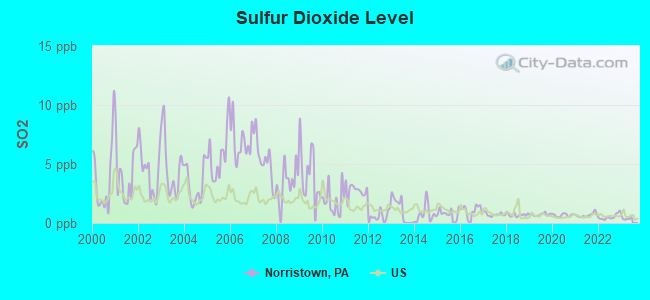
Sulfur Dioxide (SO2) [ppb] level in 2022 was 0.522. This is significantly better than average. Closest monitor was 1.8 miles away from the city center.
| City: | 0.522 |
| U.S.: | 1.515 |
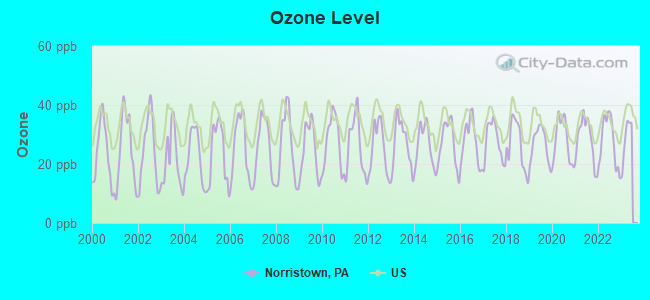
Ozone [ppb] level in 2022 was 27.7. This is about average. Closest monitor was 1.8 miles away from the city center.
| City: | 27.7 |
| U.S.: | 33.3 |
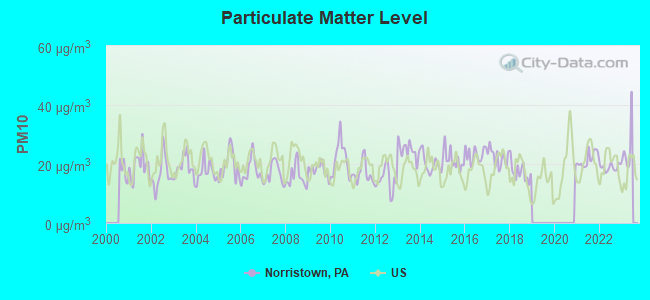
Particulate Matter (PM10) [µg/m3] level in 2022 was 18.9. This is about average. Closest monitor was 1.8 miles away from the city center.
| City: | 18.9 |
| U.S.: | 19.2 |
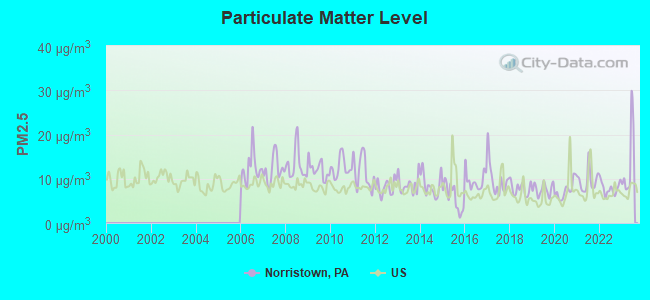
Particulate Matter (PM2.5) [µg/m3] level in 2023 was 13.6. This is significantly worse than average. Closest monitor was 1.8 miles away from the city center.
| City: | 13.6 |
| U.S.: | 8.1 |
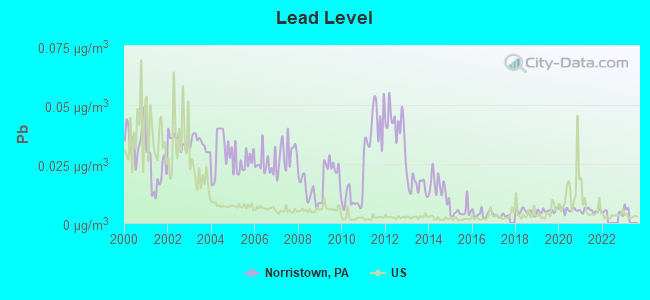
Lead (Pb) [µg/m3] level in 2021 was 0.00522. This is significantly better than average. Closest monitor was 2.0 miles away from the city center.
| City: | 0.00522 |
| U.S.: | 0.00931 |
Tornado activity:
Norristown-area historical tornado activity is slightly above Pennsylvania state average. It is 6% greater than the overall U.S. average.
On 3/22/1955, a category F3 (max. wind speeds 158-206 mph) tornado 8.3 miles away from the Norristown borough center killed one person and caused between $50,000 and $500,000 in damages.
On 7/27/1994, a category F3 tornado 12.1 miles away from the borough center killed 3 people and injured 25 people and caused between $5,000,000 and $50,000,000 in damages.
Earthquake activity:
Norristown-area historical earthquake activity is significantly above Pennsylvania state average. It is 67% smaller than the overall U.S. average.On 8/23/2011 at 17:51:04, a magnitude 5.8 (5.8 MW, Depth: 3.7 mi, Class: Moderate, Intensity: VI - VII) earthquake occurred 206.9 miles away from the city center
On 1/16/1994 at 01:49:16, a magnitude 4.6 (4.6 MB, 4.6 LG, Depth: 3.1 mi, Class: Light, Intensity: IV - V) earthquake occurred 39.5 miles away from Norristown center
On 1/16/1994 at 00:42:43, a magnitude 4.2 (4.2 MB, 4.0 LG, Depth: 3.1 mi) earthquake occurred 37.9 miles away from the city center
On 10/7/1983 at 10:18:46, a magnitude 5.3 (5.1 MB, 5.3 LG, 5.1 ML) earthquake occurred 270.0 miles away from Norristown center
On 11/30/2017 at 21:47:31, a magnitude 4.1 (4.1 MW, Depth: 6.1 mi) earthquake occurred 64.0 miles away from the city center
On 9/25/1998 at 19:52:52, a magnitude 5.2 (4.8 MB, 4.3 MS, 5.2 LG, 4.5 MW, Depth: 3.1 mi) earthquake occurred 281.0 miles away from Norristown center
Magnitude types: regional Lg-wave magnitude (LG), body-wave magnitude (MB), local magnitude (ML), surface-wave magnitude (MS), moment magnitude (MW)
Natural disasters:
The number of natural disasters in Montgomery County (26) is a lot greater than the US average (15).Major Disasters (Presidential) Declared: 20
Emergencies Declared: 6
Causes of natural disasters: Hurricanes: 7, Floods: 5, Winter Storms: 5, Storms: 4, Tropical Storms: 4, Snowstorms: 3, Blizzard: 1, Mudslide: 1, Snowfall: 1, Tropical Depression: 1, Water Shortage: 1, Other: 1 (Note: some incidents may be assigned to more than one category).

Main business address for: AUXILIUM PHARMACEUTICALS INC (PHARMACEUTICAL PREPARATIONS), HEALTHAXIS INC (SERVICES-COMPUTER PROGRAMMING SERVICES), INTEGRATED CIRCUIT SYSTEMS INC (SEMICONDUCTORS & RELATED DEVICES).
Hospitals in Norristown:
- MERCY SUBURBAN HOSPITAL (Voluntary non-profit - Church, 2701 DEKALB PIKE)
- MONTGOMERY COUNTY EMERGENCY SERVICE, INC (50 BEECH DRIVE)
- MONTGOMERY HOSPITAL (POWELL & FORNANCE STREETS)
- NORRISTOWN STATE HOSPITAL (1001 STERIGERE STREET)
- SACRED HEART HOSPITAL AND REHAB CENTER (1430 DEKALB ST)
- VALLEY FORGE MEDICAL CENTER AND HOSPITAL (Proprietary, 1033 W GERMANTOWN PIKE)
Nursing Homes in Norristown:
- FAIR VILLA NSG HOME (1240 W MAIN ST)
- LEADER NSG REHAB (JOHNSON HIGHWAY OLD ARCH RD)
- MONTGOMERY HOSPITAL SKILLED NRSNG UNIT (POWELL AND FORNANCE STREET)
- NORRISTOWN STATE HOSPITAL BLDG 9 (STANBRIDGE STERIGERE ST)
- PLYMOUTH HOUSE HCC (900 E GERMANTOWN PIKE)
- REGINA COMMUNITY NURSING CENTE (550 EAST FURNANCE STREET)
- RITTENHOUSE PINE CENTER (1700 PINE STREET)
- SUBURBAN WOODS HEALTH AND REHA (2751 DEKALB PIKE)
- TOWNE MANOR EAST (2004 OLD ARCH ROAD)
Dialysis Facilities in Norristown:
- FRESENIUS MEDICAL CARE EAST NORRITON (2925 DEKALB PIKE)
- FRESENIUS MEDICAL CARE MONTGOMERY EAST (1350 POWELL STREET)
Home Health Centers in Norristown:
Heliports located in Norristown:
See details about Heliports located in Norristown, PAAmtrak stations near Norristown:
- 9 miles: ARDMORE (STATION RD. & LANCASTER AVE.) . Services: enclosed waiting area, public restrooms, public payphones, paid short-term parking, call for car rental service, call for taxi service, public transit connection.
- 10 miles: PAOLI (LANCASTER PIKE & S. VALLEY RD.) . Services: ticket office, enclosed waiting area, public restrooms, public payphones, ATM, paid short-term parking, paid long-term parking, call for car rental service, call for taxi service, public transit connection.
- 14 miles: NORTH PHILADELPHIA (PHILADELPHIA, 2900 N. BROAD ST.) . Services: ticket office, fully wheelchair accessible, enclosed waiting area, public restrooms, public payphones, paid short-term parking, paid long-term parking, call for taxi service, public transit connection.
Operable nuclear power plants near Norristown:
- 19 miles: Limerick 1 and 2 in Pottstown, PA.
Colleges/universities with over 2000 students nearest to Norristown:
- Cabrini College (about 5 miles; Radnor, PA; Full-time enrollment: 2,304)
- Eastern University (about 5 miles; Saint Davids, PA; FT enrollment: 3,220)
- Montgomery County Community College (about 6 miles; Blue Bell, PA; FT enrollment: 8,723)
- Villanova University (about 6 miles; Villanova, PA; FT enrollment: 9,350)
- Gwynedd Mercy University (about 8 miles; Gwynedd Valley, PA; FT enrollment: 2,125)
- Arcadia University (about 10 miles; Glenside, PA; FT enrollment: 3,542)
- Saint Joseph's University (about 11 miles; Philadelphia, PA; FT enrollment: 7,329)
Public high schools in Norristown:
- NORRISTOWN AREA HS (Students: 1,852, Location: 1900 EAGLE DR, Grades: 9-12)
- ROOSEVELT ALTERN SCH (Students: 182, Location: 1161 MARKLEY ST, Grades: 9-12)
Private high school in Norristown:
Biggest public elementary/middle schools in Norristown:
- EAST NORRITON MS (Students: 840, Location: 330 ROLAND DR, Grades: 5-8)
- EISENHOWER MS (Students: 641, Location: 1601 MARKLEY ST, Grades: 5-8)
- STEWART MS (Students: 552, Location: 1315 W MARSHALL ST, Grades: 5-8)
- PAUL V FLY EL SCH (Students: 525, Location: 2920 POTSHOP RD, Grades: KG-4)
- MARSHALL STREET EL SCH (Students: 515, Location: 1525 W MARSHALL ST, Grades: KG-4)
- COLE MANOR EL SCH (Students: 402, Location: 2350 SPRINGVIEW RD, Grades: KG-4)
- HANCOCK EL SCH (Students: 366, Location: ARCH & SUMMIT STREETS, Grades: 1-4)
- GOTWALS EL SCH (Students: 320, Location: 1 E OAK ST, Grades: 1-4)
- WOODLAND EL SCH (Location: 2700 WOODLAND AVE, Grades: KG-4)
- WHITEHALL EL SCH (Location: 399 N WHITEHALL RD, Grades: KG-4)
Private elementary/middle school in Norristown:
User-submitted facts and corrections:
- Beaver College is now called Arcadia College added by JCK
Points of interest:
Notable locations in Norristown: Mill Street Station (A), Earnest Street Yard Station (B), Elm Street Station (C), Main Street Station (D), Dekaub Street Station (E), Saint Patrick School (F), Commonwealth Office Camp (G), Norristown County Prison (H), Norristown Transportation Center (I), Norristown Fire Department - Hancock Fire Company (J), Hancock-Norristown Station 27-E Fire Station (K), Norristown Fire Department - Humane Fire Engine Company 1 (L), Norristown Fire Department - Fairmount Engine Company 2 (M), Norristown Borough Hall (N), Norristown Fire Department - Norristown Hose Company (O), Norristown Police Station (P), Montgomery County Health Department (Q), Montgomery County-Norristown Library (R), Norristown Fire Department - Montgomery Hose Company (S). Display/hide their locations on the map
Shopping Centers: Astor Shopping Center (1), Logan Square Shopping Center (2). Display/hide their locations on the map
Church in Norristown: Saint Josephs Protectorate (A). Display/hide its location on the map
Cemetery: Treemont Cemetery (1). Display/hide its location on the map
Streams, rivers, and creeks: Stony Creek (A), Sawmill Run (B). Display/hide their locations on the map
Parks in Norristown include: Elmwood Park (1), Elmwood Park Zoo (2), Bartasch Park (3). Display/hide their locations on the map
Hotel: Colonial Motel (830 West Main Street).
Courts: Pennsylvania Commonwealth - Commonwealth Court- Administrative Office (1 South), Pennsylvania Commonwealth - Norristown- Disciplinary Board Supreme Court- Liquor Control B (2014 Old Arch Road), Montgomery County - Row Officers- Court Reporter (Airy SWede Sts), Montgomery County - Row Officers- Court Administrator (Airy SWede Sts), Montgomery County - Court House (Airy Swede), Pennsylvania Commonwealth - Commonwealth Court- Judge Alexander Barb (1 South), Pennsylvania Commonwealth - Commonwealth Court- Judge James Gardner Co (1 South), Pennsylvania Commonwealth - Commonwealth Court- Judge Doris A Smith (1 South), Pennsylvania Commonwealth - Commonwealth Court- Judge Charles Lorde (1 South).
Birthplace of: Jaco Pastorius - Musician, John F. Street - Mayor, Martha Settle Putney - Writer, Peter Boyle - Film actor, Bill Schonely - Sports announcer, Jimmy Smith (musician) - Jazz musician, Mike Piazza - (born 1968), baseball player, Richard Schweiker - Politician, Tommy Lasorda - (born 1927), baseball manager, William Shainline Middleton - Physician.
Drinking water stations with addresses in Norristown and their reported violations in the past:
AUDUBON WATER COMPANY (Population served: 9,850, Purch surface water):Past health violations:PENNYPACKER MILLS HISTORIC STE (Population served: 50, Groundwater):Past monitoring violations:
- MCL, Monthly (TCR) - In JUL-2014, Contaminant: Coliform. Follow-up actions: St Public Notif received (AUG-25-2014), St Compliance achieved (AUG-25-2014), St Public Notif requested (AUG-25-2014)
- MCL, Monthly (TCR) - In JUN-2014, Contaminant: Coliform. Follow-up actions: St Public Notif received (AUG-25-2014), St Compliance achieved (AUG-25-2014), St Public Notif requested (AUG-25-2014)
- Monitoring of Treatment (SWTR-Unfilt/GWR) - In DEC-2013, Contaminant: GROUNDWATER RULE. Follow-up actions: St Violation/Reminder Notice (JAN-28-2014), St Compliance achieved (FEB-20-2014)
- Monitoring of Treatment (SWTR-Unfilt/GWR) - In JAN-2013, Contaminant: GROUNDWATER RULE. Follow-up actions: St Violation/Reminder Notice (FEB-25-2013), St Compliance achieved (MAR-12-2013)
- Monitoring of Treatment (SWTR-Unfilt/GWR) - In NOV-2012, Contaminant: GROUNDWATER RULE. Follow-up actions: St Violation/Reminder Notice (JAN-03-2013), St Compliance achieved (FEB-22-2013)
- Monitoring of Treatment (SWTR-Unfilt/GWR) - In OCT-2012, Contaminant: GROUNDWATER RULE. Follow-up actions: St Violation/Reminder Notice (NOV-26-2012), St Compliance achieved (FEB-22-2013)
- Monitoring and Reporting (DBP) - Between JUL-2012 and SEP-2012, Contaminant: Total Haloacetic Acids (HAA5). Follow-up actions: St Public Notif requested (NOV-26-2012), St Violation/Reminder Notice (NOV-26-2012), St Compliance achieved (NOV-21-2013), St Public Notif received (NOV-21-2013)
- One minor monitoring violation
- 309 regular monitoring violations
- 8 other older monitoring violations
Past health violations:GREEN LANE PARK SOUTH (Population served: 50, Groundwater):
- MCL, Monthly (TCR) - Between JUL-2013 and SEP-2013, Contaminant: Coliform. Follow-up actions: St Public Notif received (OCT-22-2013), St Compliance achieved (OCT-22-2013), St Public Notif requested (OCT-22-2013)
- MCL, Acute (TCR) - Between JUL-2013 and SEP-2013, Contaminant: Coliform. Follow-up actions: St Compliance achieved (DEC-24-2013)
Past health violations:Past monitoring violations:
- MCL, Monthly (TCR) - Between OCT-2005 and DEC-2005, Contaminant: Coliform. Follow-up actions: St Violation/Reminder Notice (DEC-20-2005), St Compliance achieved (DEC-20-2005)
- MCL, Acute (TCR) - Between OCT-2005 and DEC-2005, Contaminant: Coliform. Follow-up actions: St Violation/Reminder Notice (DEC-20-2005), St Compliance achieved (DEC-20-2005)
- One routine major monitoring violation
| This borough: | 2.8 people |
| Pennsylvania: | 2.5 people |
| This borough: | 62.7% |
| Whole state: | 65.0% |
| This borough: | 8.9% |
| Whole state: | 6.6% |
Likely homosexual households (counted as self-reported same-sex unmarried-partner households)
- Lesbian couples: 0.4% of all households
- Gay men: 0.4% of all households
People in group quarters in Norristown in 2010:
- 293 people in residential treatment centers for adults
- 268 people in other noninstitutional facilities
- 224 people in nursing facilities/skilled-nursing facilities
- 119 people in emergency and transitional shelters (with sleeping facilities) for people experiencing homelessness
- 43 people in group homes intended for adults
People in group quarters in Norristown in 2000:
- 611 people in mental (psychiatric) hospitals or wards
- 231 people in nursing homes
- 74 people in other noninstitutional group quarters
- 26 people in homes for the mentally ill
- 17 people in other group homes
- 17 people in religious group quarters
- 11 people in other nonhousehold living situations
- 6 people in other types of correctional institutions
- 2 people in homes for the mentally retarded
Banks with most branches in Norristown (2011 data):
- Citizens Bank of Pennsylvania: Audubon Shopping Center Branch, Trooper Giant Branch, Trooper Acme Branch, Audubon Drive-Up Branch, Norristown Branch. Info updated 2010/09/24: Bank assets: $32,316.9 mil, Deposits: $25,297.1 mil, headquarters in Philadelphia, PA, positive income, 396 total offices, Holding Company: Uk Financial Investments Limited
- Wells Fargo Bank, National Association: Trooper Branch, Northtowne Plaza, Audobon, Norristown. Info updated 2011/04/05: Bank assets: $1,161,490.0 mil, Deposits: $905,653.0 mil, headquarters in Sioux Falls, SD, positive income, 6395 total offices, Holding Company: Wells Fargo & Company
- PNC Bank, National Association: Logan Square Branch at 1770 Markley Street, branch established on 1955/05/09; Hamilton Branch at 1200 West Main Street, branch established on 1973/11/07. Info updated 2012/03/20: Bank assets: $263,309.6 mil, Deposits: $197,343.0 mil, headquarters in Wilmington, DE, positive income, Commercial Lending Specialization, 3085 total offices, Holding Company: Pnc Financial Services Group, Inc., The
- Bank of America, National Association: East Norriton Branch at 20 E Germantown Pike, branch established on 1998/02/11; East Norriton - Genuardi's at 25 West Germantown Pike, branch established on 1999/02/18. Info updated 2009/11/18: Bank assets: $1,451,969.3 mil, Deposits: $1,077,176.8 mil, headquarters in Charlotte, NC, positive income, 5782 total offices, Holding Company: Bank Of America Corporation
- TD Bank, National Association: Trooper Branch at 2623 Ridge Pike, branch established on 1995/05/18. Info updated 2010/10/04: Bank assets: $188,912.6 mil, Deposits: $153,149.8 mil, headquarters in Wilmington, DE, positive income, 1314 total offices, Holding Company: Toronto-Dominion Bank, The
- First Niagara Bank, National Association: Audubon Branch at 2624 Egypt Road, branch established on 1996/10/15. Info updated 2011/06/09: Bank assets: $32,750.6 mil, Deposits: $19,595.4 mil, headquarters in Buffalo, NY, positive income, Commercial Lending Specialization, 351 total offices, Holding Company: First Niagara Financial Group, Inc.
- Harleysville Savings Bank: Norristown Branch at 2301 West Main Street, branch established on 1915/01/01. Info updated 2007/02/05: Bank assets: $840.4 mil, Deposits: $539.0 mil, headquarters in Harleysville, PA, positive income, Mortgage Lending Specialization, 8 total offices, Holding Company: Harleysville Savings Financial Corporation
- National Penn Bank: Norristown Branch at 451 West Johnson Highway, branch established on 1904/01/01. Info updated 2008/03/03: Bank assets: $8,395.9 mil, Deposits: $5,879.6 mil, headquarters in Boyertown, PA, positive income, Commercial Lending Specialization, 131 total offices, Holding Company: National Penn Bancshares, Inc.
- Beneficial Mutual Savings Bank: East Norriton Branch at 2905 Whitehall Road, branch established on 2004/08/02. Info updated 2011/07/08: Bank assets: $4,590.2 mil, Deposits: $3,659.5 mil, headquarters in Philadelphia, PA, positive income, 60 total offices
For population 15 years and over in Norristown:
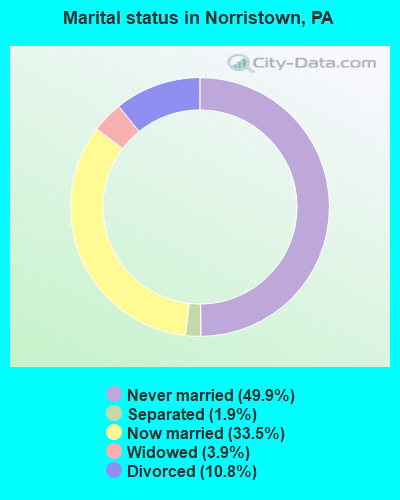
- Never married: 49.9%
- Now married: 33.5%
- Separated: 1.9%
- Widowed: 3.9%
- Divorced: 10.8%
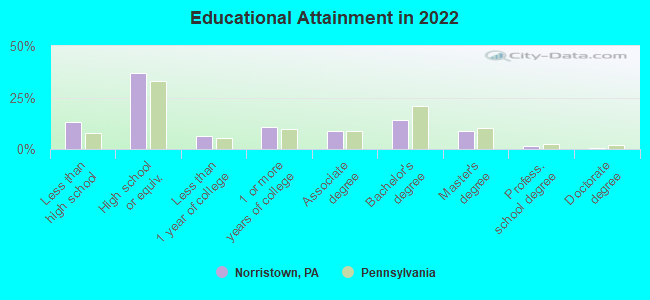
For population 25 years and over in Norristown:
- High school or higher: 85.1%
- Bachelor's degree or higher: 23.2%
- Graduate or professional degree: 9.7%
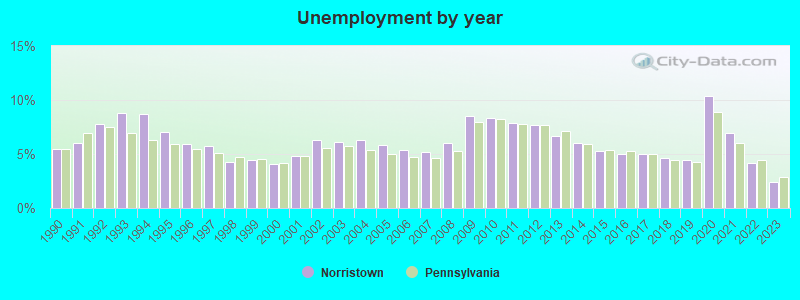
- Unemployed: 7.1%
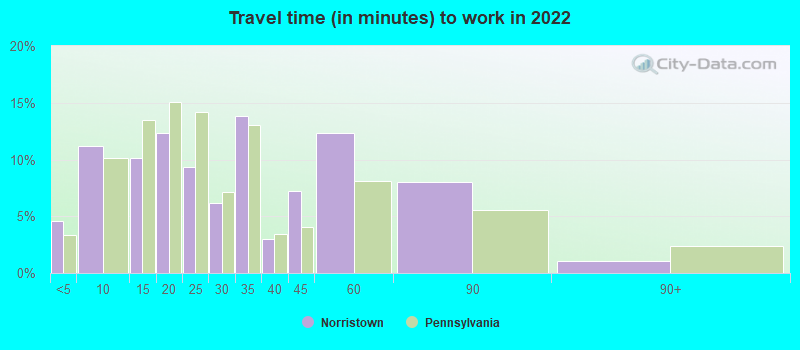
- Mean travel time to work (commute): 21.8 minutes
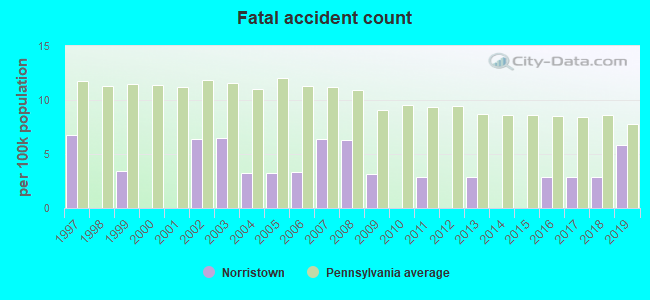
| Here: | 12.6 |
| Pennsylvania average: | 11.4 |
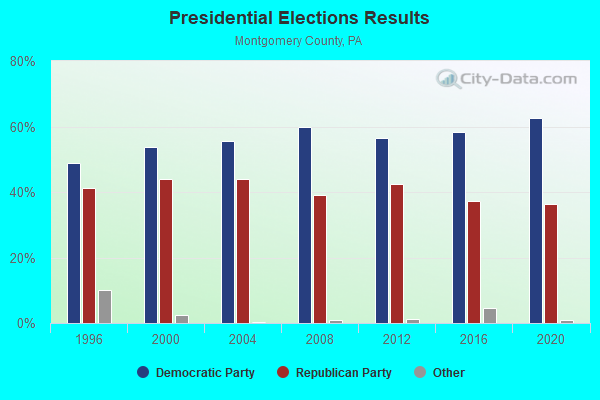
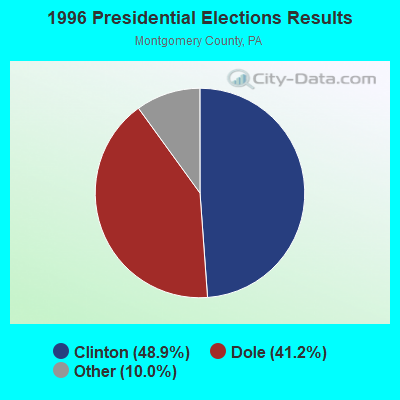
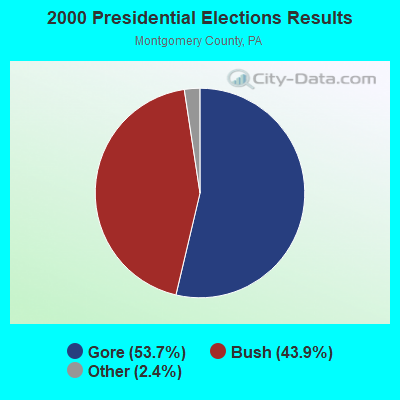

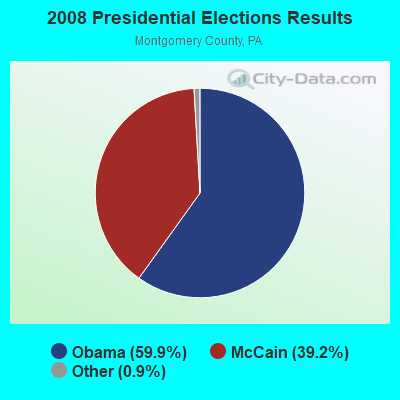
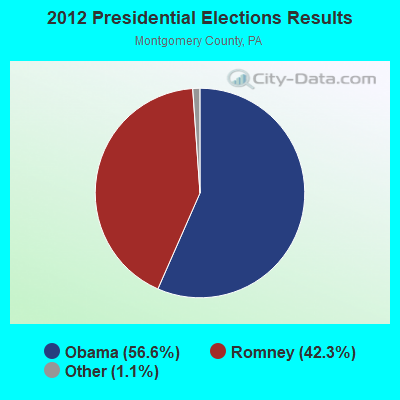


Graphs represent county-level data. Detailed 2008 Election Results
Neighborhoods in Norristown:
(Norristown, Pennsylvania Neighborhood Map)Religion statistics for Norristown, PA (based on Montgomery County data)
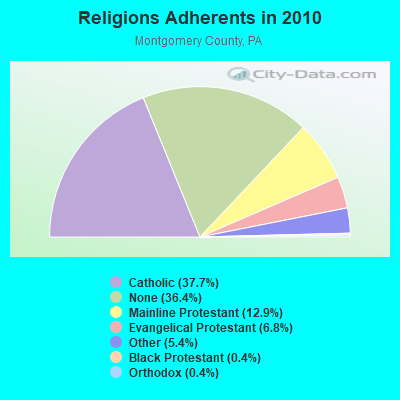
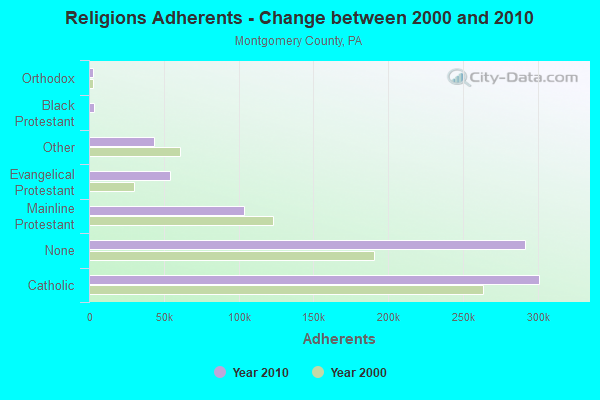
| Religion | Adherents | Congregations |
|---|---|---|
| Catholic | 301,220 | 55 |
| Mainline Protestant | 103,475 | 221 |
| Evangelical Protestant | 54,215 | 269 |
| Other | 43,532 | 68 |
| Black Protestant | 3,190 | 11 |
| Orthodox | 2,945 | 9 |
| None | 291,297 | - |
Food Environment Statistics:
| Montgomery County: | 1.63 / 10,000 pop. |
| Pennsylvania: | 2.04 / 10,000 pop. |
| This county: | 0.05 / 10,000 pop. |
| State: | 0.09 / 10,000 pop. |
| This county: | 1.16 / 10,000 pop. |
| State: | 0.88 / 10,000 pop. |
| Here: | 1.77 / 10,000 pop. |
| State: | 2.52 / 10,000 pop. |
| This county: | 7.61 / 10,000 pop. |
| Pennsylvania: | 7.12 / 10,000 pop. |
| This county: | 8.3% |
| State: | 9.1% |
| This county: | 23.4% |
| Pennsylvania: | 27.2% |
| Here: | 10.8% |
| Pennsylvania: | 11.5% |
Health and Nutrition:
| Norristown: | 47.6% |
| State: | 50.2% |
| Norristown: | 44.5% |
| Pennsylvania: | 47.1% |
| This city: | 28.9 |
| State: | 28.7 |
| Norristown: | 20.6% |
| Pennsylvania: | 20.8% |
| Norristown: | 12.0% |
| Pennsylvania: | 10.9% |
| Norristown: | 6.7 |
| State: | 6.8 |
| Here: | 33.0% |
| Pennsylvania: | 34.3% |
| Here: | 54.4% |
| State: | 56.2% |
| Norristown: | 80.2% |
| Pennsylvania: | 78.3% |
More about Health and Nutrition of Norristown, PA Residents
| Local government employment and payroll (March 2022) | |||||
| Function | Full-time employees | Monthly full-time payroll | Average yearly full-time wage | Part-time employees | Monthly part-time payroll |
|---|---|---|---|---|---|
| Police Protection - Officers | 67 | $646,514 | $115,794 | 0 | $0 |
| Firefighters | 23 | $211,132 | $110,156 | 0 | $0 |
| Other Government Administration | 20 | $99,078 | $59,447 | 0 | $0 |
| Streets and Highways | 13 | $56,305 | $51,974 | 0 | $0 |
| Police - Other | 13 | $60,457 | $55,806 | 19 | $27,654 |
| Other and Unallocable | 10 | $49,757 | $59,708 | 0 | $0 |
| Financial Administration | 6 | $37,390 | $74,780 | 0 | $0 |
| Solid Waste Management | 2 | $8,793 | $52,758 | 0 | $0 |
| Parks and Recreation | 2 | $10,022 | $60,132 | 8 | $2,612 |
| Totals for Government | 156 | $1,179,448 | $90,727 | 27 | $30,266 |
Norristown government finances - Expenditure in 2018 (per resident):
- Construction - Regular Highways: $542,000 ($15.14)
Parks and Recreation: $19,000 ($0.53)
General Public Buildings: $9,000 ($0.25)
- Current Operations - Police Protection: $7,891,000 ($220.45)
Central Staff Services: $4,996,000 ($139.57)
Solid Waste Management: $2,889,000 ($80.71)
General - Other: $2,574,000 ($71.91)
Local Fire Protection: $2,517,000 ($70.32)
Regular Highways: $1,666,000 ($46.54)
Health - Other: $907,000 ($25.34)
Housing and Community Development: $900,000 ($25.14)
Financial Administration: $730,000 ($20.39)
Judicial and Legal Services: $528,000 ($14.75)
Parks and Recreation: $450,000 ($12.57)
General Public Buildings: $436,000 ($12.18)
- General - Interest on Debt: $777,000 ($21.71)
- Other Capital Outlay - Local Fire Protection: $1,017,000 ($28.41)
Regular Highways: $379,000 ($10.59)
Police Protection: $243,000 ($6.79)
Central Staff Services: $167,000 ($4.67)
Parks and Recreation: $46,000 ($1.29)
- Total Salaries and Wages: $12,460,000 ($348.09)
Norristown government finances - Revenue in 2018 (per resident):
- Charges - Solid Waste Management: $2,796,000 ($78.11)
Other: $866,000 ($24.19)
Parking Facilities: $413,000 ($11.54)
Parks and Recreation: $40,000 ($1.12)
- Federal Intergovernmental - Housing and Community Development: $793,000 ($22.15)
Other: $50,000 ($1.40)
- Local Intergovernmental - Other: $157,000 ($4.39)
General Local Government Support: $32,000 ($0.89)
- Miscellaneous - Fines and Forfeits: $815,000 ($22.77)
Interest Earnings: $110,000 ($3.07)
Sale of Property: $85,000 ($2.37)
Donations From Private Sources: $68,000 ($1.90)
General Revenue - Other: $28,000 ($0.78)
Rents: $19,000 ($0.53)
- State Intergovernmental - Other: $1,387,000 ($38.75)
Highways: $807,000 ($22.55)
General Local Government Support: $30,000 ($0.84)
- Tax - Property: $11,199,000 ($312.86)
Individual Income: $9,672,000 ($270.21)
Occupation and Business License - Other: $2,535,000 ($70.82)
Public Utility License: $438,000 ($12.24)
Documentary and Stock Transfer: $372,000 ($10.39)
Norristown government finances - Debt in 2018 (per resident):
- Long Term Debt - Outstanding Unspecified Public Purpose: $25,675,000 ($717.28)
Issue, Unspecified Public Purpose: $21,630,000 ($604.27)
Beginning Outstanding - Unspecified Public Purpose: $14,449,000 ($403.66)
Retired Unspecified Public Purpose: $10,404,000 ($290.66)
Norristown government finances - Cash and Securities in 2018 (per resident):
- Bond Funds - Cash and Securities: $8,804,000 ($245.96)
- Other Funds - Cash and Securities: $11,143,000 ($311.30)
- Sinking Funds - Cash and Securities: $54,000 ($1.51)
6.73% of this county's 2021 resident taxpayers lived in other counties in 2020 ($101,242 average adjusted gross income)
| Here: | 6.73% |
| Pennsylvania average: | 5.27% |
0.01% of residents moved from foreign countries ($62 average AGI)
Montgomery County: 0.01% Pennsylvania average: 0.01%
Top counties from which taxpayers relocated into this county between 2020 and 2021:
| from Philadelphia County, PA | |
| from Bucks County, PA | |
| from Chester County, PA |
6.38% of this county's 2020 resident taxpayers moved to other counties in 2021 ($104,034 average adjusted gross income)
| Here: | 6.38% |
| Pennsylvania average: | 5.44% |
0.01% of residents moved to foreign countries ($121 average AGI)
Montgomery County: 0.01% Pennsylvania average: 0.01%
Top counties to which taxpayers relocated from this county between 2020 and 2021:
| to Philadelphia County, PA | |
| to Bucks County, PA | |
| to Chester County, PA |
| Businesses in Norristown, PA | ||||
| Name | Count | Name | Count | |
|---|---|---|---|---|
| 7-Eleven | 3 | Little Caesars Pizza | 1 | |
| AT&T | 1 | MasterBrand Cabinets | 4 | |
| Advance Auto Parts | 1 | McDonald's | 1 | |
| Applebee's | 2 | New Balance | 1 | |
| Arby's | 1 | Nike | 6 | |
| AutoZone | 2 | Old Country Buffet | 1 | |
| Blockbuster | 1 | Panera Bread | 2 | |
| Burger King | 1 | Papa John's Pizza | 1 | |
| CVS | 2 | Payless | 1 | |
| Chick-Fil-A | 1 | Pizza Hut | 1 | |
| Church's Chicken | 1 | RadioShack | 1 | |
| Cricket Wireless | 3 | Rite Aid | 2 | |
| Dairy Queen | 1 | Safeway | 1 | |
| Decora Cabinetry | 2 | Sears | 1 | |
| Domino's Pizza | 1 | Staples | 1 | |
| DressBarn | 1 | Starbucks | 2 | |
| Dunkin Donuts | 6 | Subway | 1 | |
| Fashion Bug | 1 | T-Mobile | 2 | |
| FedEx | 13 | T.J.Maxx | 1 | |
| Firestone Complete Auto Care | 2 | Taco Bell | 1 | |
| GNC | 2 | U-Haul | 2 | |
| GameStop | 2 | UPS | 12 | |
| Giant | 1 | Volkswagen | 1 | |
| H&R Block | 2 | Vons | 1 | |
| Home Depot | 1 | Walgreens | 2 | |
| Just Tires | 1 | Walmart | 2 | |
| KFC | 1 | Wendy's | 2 | |
| Lane Furniture | 1 | |||
Strongest AM radio stations in Norristown:
- WZZD (990 AM; 50 kW; PHILADELPHIA, PA; Owner: PENNSYLVANIA MEDIA ASSOCIATES, INC.)
- KYW (1060 AM; 50 kW; PHILADELPHIA, PA; Owner: INFINITY BROADCASTING OPERATIONS, INC.)
- WWDB (860 AM; daytime; 10 kW; PHILADELPHIA, PA)
- WNAP (1110 AM; daytime; 5 kW; NORRISTOWN, PA; Owner: WNAP, INC)
- WNWR (1540 AM; 50 kW; PHILADELPHIA, PA)
- WFIL (560 AM; 5 kW; PHILADELPHIA, PA; Owner: PENNSYLVANIA MEDIA ASSOCIATES, INC.)
- WPEN (950 AM; 50 kW; PHILADELPHIA, PA; Owner: GREATER PHILADELPHIA RADIO, INC.)
- WVCH (740 AM; 50 kW; CHESTER, PA; Owner: WVCH COMMUNICATIONS, INC.)
- WWJZ (640 AM; 50 kW; MOUNT HOLLY, NJ; Owner: ABC, INC.)
- WPHT (1210 AM; 50 kW; PHILADELPHIA, PA; Owner: INFINITY BROADCASTING OPERATIONS, INC.)
- WDAS (1480 AM; 5 kW; PHILADELPHIA, PA; Owner: AMFM RADIO LICENSES, L.L.C.)
- WNPV (1440 AM; 2 kW; LANSDALE, PA; Owner: WNPV INC.)
- WIP (610 AM; 5 kW; PHILADELPHIA, PA; Owner: INFINITY BROADCASTING CORPORATION OF PHILADELPHIA)
Strongest FM radio stations in Norristown:
- WMWX (95.7 FM; PHILADELPHIA, PA; Owner: GREATER PHILADELPHIA RADIO, INC.)
- WMGK (102.9 FM; PHILADELPHIA, PA; Owner: GREATER PHILADELPHIA RADIO, INC.)
- WOGL (98.1 FM; PHILADELPHIA, PA; Owner: INFINITY BROADCASTING OPERATIONS, INC.)
- WYSP (94.1 FM; PHILADELPHIA, PA; Owner: INFINITY BROADCASTING OPERATIONS, INC.)
- WSNI-FM (104.5 FM; PHILADELPHIA, PA; Owner: AMFM RADIO LICENSES, L.L.C.)
- WPHI-FM (103.9 FM; JENKINTOWN, PA; Owner: RADIO ONE LICENSES, LLC)
- WBEB (101.1 FM; PHILADELPHIA, PA; Owner: WEAZ-FM RADIO, INC.)
- WRTI (90.1 FM; PHILADELPHIA, PA; Owner: TEMPLE UNIV. OF THE COMMONWEALTH, ET)
- WXPN (88.5 FM; PHILADELPHIA, PA; Owner: TRUSTEES OF THE UNIVERSITY OF PENNA.)
- WHYY-FM (90.9 FM; PHILADELPHIA, PA; Owner: WHYY, INC.)
- WDAS-FM (105.3 FM; PHILADELPHIA, PA; Owner: AMFM RADIO LICENSES, L.L.C.)
- WXTU (92.5 FM; PHILADELPHIA, PA; Owner: WXTU LICENSE LIMITED PARTNERSHIP)
- WUSL (98.9 FM; PHILADELPHIA, PA; Owner: AMFM RADIO LICENSES, L.L.C.)
- WPTP (96.5 FM; PHILADELPHIA, PA; Owner: WDAS LICENSE LIMITED PARTNERSHIP)
- WPLY (100.3 FM; MEDIA, PA; Owner: RADIO ONE LICENSES, LLC)
- WIOQ (102.1 FM; PHILADELPHIA, PA; Owner: AMFM RADIO LICENSES, L.L.C.)
- WJJZ (106.1 FM; PHILADELPHIA, PA; Owner: AMFM RADIO LICENSES, L.L.C.)
- WYBF (89.1 FM; RADNOR TOWNSHIP, PA; Owner: CABRINI COLLEGE)
- WXVU (89.1 FM; VILLANOVA, PA; Owner: VILLANOVA UNIVERSITY)
- WMMR (93.3 FM; PHILADELPHIA, PA; Owner: GREATER BOSTON RADIO, INC.)
TV broadcast stations around Norristown:
- KYW-TV (Channel 3; PHILADELPHIA, PA; Owner: CBS BROADCASTING INC.)
- WPHL-TV (Channel 17; PHILADELPHIA, PA; Owner: TRIBUNE TELEVISION COMPANY)
- WPPX (Channel 61; WILMINGTON, DE; Owner: PAXSON PHILADELPHIA LICENSE, INC.)
- WPVI-TV (Channel 6; PHILADELPHIA, PA; Owner: ABC, INC.)
- WPSG (Channel 57; PHILADELPHIA, PA; Owner: VIACOM STATIONS GROUP OF PHILADELPHIA INC.)
- WCAU (Channel 10; PHILADELPHIA, PA; Owner: NBC SUBSIDIARY (WCAU-TV), L.P.)
- WGTW (Channel 48; BURLINGTON, NJ; Owner: BRUNSON COMMUNICATIONS, INC.)
- WTXF-TV (Channel 29; PHILADELPHIA, PA; Owner: FOX TV STATIONS OF PHILADELPHIA)
- WYBE (Channel 35; PHILADELPHIA, PA; Owner: INDEPENDENCE PUBLIC MEDIA OF PHILADELPHIA, INC.)
- WHYY-TV (Channel 12; WILMINGTON, DE; Owner: WHYY, INC.)
- WELL-LP (Channel 8; WILLOW GROVE, ETC., PA; Owner: WORD OF GOD FELLOWSHIP, INC.)
- WPHA-LP (Channel 63; PHILADELPHIA, PA; Owner: COMMERCIAL BROADCASTING CORP.)
- WFPA-CA (Channel 28; PHILADELPHIA, PA; Owner: WXTV LICENSE PARTNERSHIP, G.P.)
- WWJT-LP (Channel 7; PHILADELPHIA, PA; Owner: PHILADELPHIA TELEVISION NETWORK, INC)
- WUVP (Channel 65; VINELAND, NJ; Owner: UNIVISION PHILADELPHIA LLC)
- WNJT (Channel 52; TRENTON, NJ; Owner: NEW JERSEY PUBLIC BROADCASTING AUTHORITY)
- WTSD-CA (Channel 14; WILMINGTON, DE; Owner: PRIORITY COMMUNICATIONS MINISTRIES, INC.)
- WNJS (Channel 23; CAMDEN, NJ; Owner: NEW JERSEY PUBLIC BROADCASTING AUTHORITY)
- WFMZ-TV (Channel 69; ALLENTOWN, PA; Owner: MARANATHA BROADCASTING COMPANY, INC.)
- WMCN-TV (Channel 53; ATLANTIC CITY, NJ; Owner: LENFEST BROADCASTING, LLC)
- WTVE (Channel 51; READING, PA; Owner: READING BROADCASTING, INC.)
- WPSJ-LP (Channel 8; HAMMONTON, ETC., NJ; Owner: ENGLE BROADCASTING)
- WLVT-TV (Channel 39; ALLENTOWN, PA; Owner: LEHIGH VALLEY PUBLIC TELECOMMUNICATIONS CORP.)
- W40AZ (Channel 40; WILMINGTON, DE; Owner: NATIONAL MINORITY T.V., INC.)
- W55BT (Channel 55; TALLEYVILLE, DE; Owner: MEDIACASTING LLC)
Medal of Honor Recipients
Medal of Honor Recipients born in Norristown: David Charles Dolby, Walter H. Cooke.
- National Bridge Inventory (NBI) Statistics
- 50Number of bridges
- 876ft / 267mTotal length
- $28,763,000Total costs
- 1,087,437Total average daily traffic
- 112,846Total average daily truck traffic
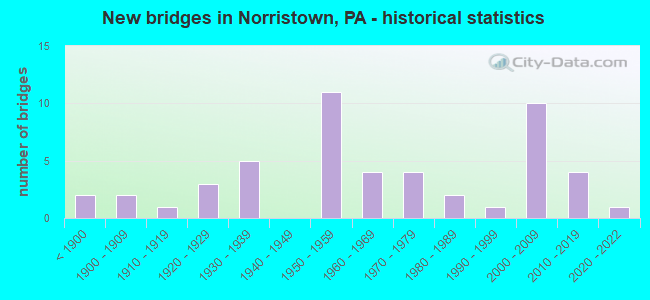
- New bridges - historical statistics
- 2Before 1900
- 21900-1909
- 11910-1919
- 31920-1929
- 51930-1939
- 111950-1959
- 41960-1969
- 41970-1979
- 21980-1989
- 11990-1999
- 102000-2009
- 42010-2019
- 12020-2022
FCC Registered Antenna Towers: 46 (See the full list of FCC Registered Antenna Towers)
FCC Registered Commercial Land Mobile Towers: 1 (See the full list of FCC Registered Commercial Land Mobile Towers in Norristown, PA)
FCC Registered Private Land Mobile Towers: 2 (See the full list of FCC Registered Private Land Mobile Towers)
FCC Registered Broadcast Land Mobile Towers: 28 (See the full list of FCC Registered Broadcast Land Mobile Towers)
FCC Registered Microwave Towers: 15 (See the full list of FCC Registered Microwave Towers in this town)
FCC Registered Paging Towers: 3 (See the full list of FCC Registered Paging Towers)
FCC Registered Amateur Radio Licenses: 177 (See the full list of FCC Registered Amateur Radio Licenses in Norristown)
FAA Registered Aircraft: 14 (See the full list of FAA Registered Aircraft in Norristown)
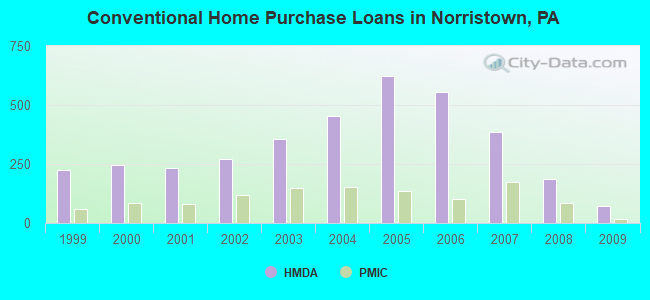
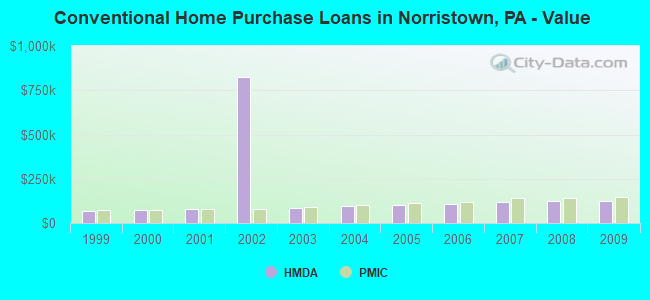
| Home Mortgage Disclosure Act Aggregated Statistics For Year 2009 (Based on 8 full and 1 partial tracts) | ||||||||||||||
| A) FHA, FSA/RHS & VA Home Purchase Loans | B) Conventional Home Purchase Loans | C) Refinancings | D) Home Improvement Loans | E) Loans on Dwellings For 5+ Families | F) Non-occupant Loans on < 5 Family Dwellings (A B C & D) | G) Loans On Manufactured Home Dwelling (A B C & D) | ||||||||
|---|---|---|---|---|---|---|---|---|---|---|---|---|---|---|
| Number | Average Value | Number | Average Value | Number | Average Value | Number | Average Value | Number | Average Value | Number | Average Value | Number | Average Value | |
| LOANS ORIGINATED | 109 | $145,058 | 74 | $124,535 | 271 | $134,512 | 27 | $21,117 | 8 | $161,625 | 73 | $99,151 | 0 | $0 |
| APPLICATIONS APPROVED, NOT ACCEPTED | 6 | $112,167 | 10 | $81,693 | 39 | $126,882 | 9 | $30,333 | 0 | $0 | 11 | $85,924 | 0 | $0 |
| APPLICATIONS DENIED | 27 | $151,000 | 16 | $93,500 | 210 | $123,968 | 43 | $38,098 | 1 | $60,000 | 45 | $90,622 | 0 | $0 |
| APPLICATIONS WITHDRAWN | 10 | $126,700 | 16 | $112,188 | 138 | $133,778 | 5 | $22,200 | 0 | $0 | 24 | $100,458 | 1 | $85,000 |
| FILES CLOSED FOR INCOMPLETENESS | 3 | $150,400 | 3 | $105,160 | 24 | $128,542 | 2 | $47,500 | 0 | $0 | 3 | $59,000 | 0 | $0 |
Detailed mortgage data for all 9 tracts in Norristown, PA
| Private Mortgage Insurance Companies Aggregated Statistics For Year 2009 (Based on 8 full and 1 partial tracts) | ||||||
| A) Conventional Home Purchase Loans | B) Refinancings | C) Non-occupant Loans on < 5 Family Dwellings (A & B) | ||||
|---|---|---|---|---|---|---|
| Number | Average Value | Number | Average Value | Number | Average Value | |
| LOANS ORIGINATED | 17 | $146,810 | 7 | $162,766 | 1 | $94,000 |
| APPLICATIONS APPROVED, NOT ACCEPTED | 3 | $169,683 | 8 | $180,375 | 2 | $110,000 |
| APPLICATIONS DENIED | 0 | $0 | 1 | $142,000 | 0 | $0 |
| APPLICATIONS WITHDRAWN | 1 | $140,000 | 0 | $0 | 0 | $0 |
| FILES CLOSED FOR INCOMPLETENESS | 0 | $0 | 0 | $0 | 0 | $0 |
2003 - 2018 National Fire Incident Reporting System (NFIRS) incidents
- Fire incident types reported to NFIRS in Norristown, PA
- 1,74169.4%Structure Fires
- 46218.4%Outside Fires
- 1546.1%Mobile Property/Vehicle Fires
- 1536.1%Other
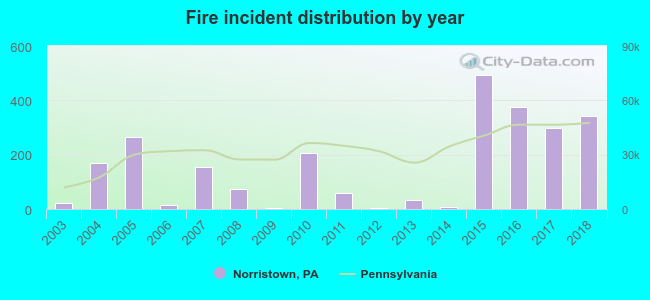 Based on the data from the years 2003 - 2018 the average number of fire incidents per year is 157. The highest number of reported fire incidents - 492 took place in 2015, and the least - 2 in 2009. The data has a growing trend.
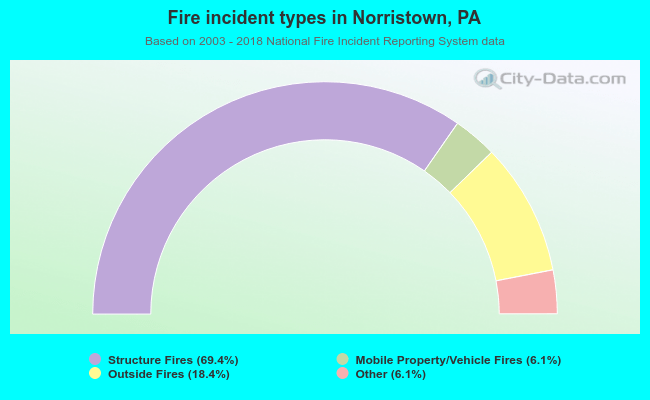 When looking into fire subcategories, the most incidents belonged to: Structure Fires (69.4%), and Outside Fires (18.4%).
| Most common first names in Norristown, PA among deceased individuals | ||
| Name | Count | Lived (average) |
|---|---|---|
| Mary | 989 | 80.4 years |
| John | 961 | 72.1 years |
| William | 732 | 73.3 years |
| Joseph | 706 | 72.7 years |
| Charles | 512 | 73.0 years |
| James | 504 | 71.5 years |
| Anna | 415 | 81.1 years |
| George | 398 | 73.7 years |
| Robert | 397 | 68.4 years |
| Margaret | 387 | 78.8 years |
| Most common last names in Norristown, PA among deceased individuals | ||
| Last name | Count | Lived (average) |
|---|---|---|
| Smith | 268 | 74.1 years |
| Johnson | 129 | 72.2 years |
| Miller | 118 | 73.5 years |
| Brown | 109 | 74.5 years |
| Jones | 104 | 71.9 years |
| Williams | 101 | 70.7 years |
| Davis | 83 | 71.5 years |
| Santangelo | 73 | 82.1 years |
| Wilson | 68 | 73.4 years |
| Young | 67 | 76.9 years |
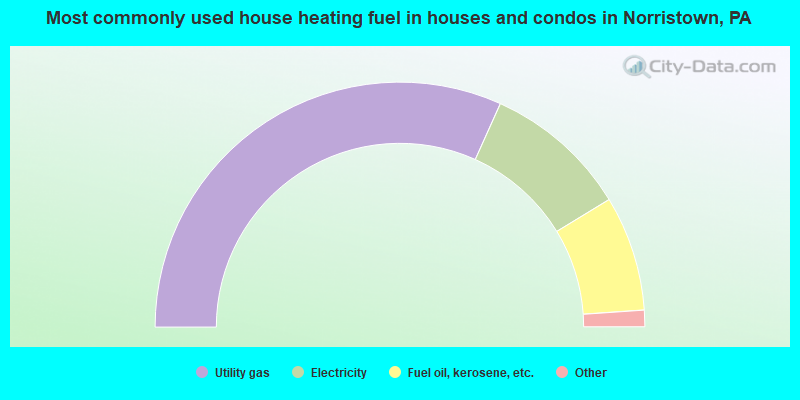
- 63.4%Utility gas
- 19.1%Electricity
- 15.2%Fuel oil, kerosene, etc.
- 1.3%Bottled, tank, or LP gas
- 0.8%Coal or coke
- 0.2%Wood
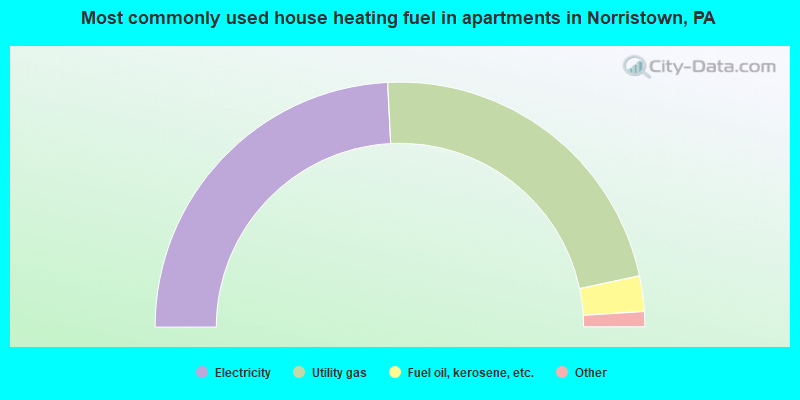
- 48.4%Electricity
- 44.9%Utility gas
- 4.7%Fuel oil, kerosene, etc.
- 1.5%Bottled, tank, or LP gas
- 0.3%Other fuel
- 0.2%No fuel used
Norristown compared to Pennsylvania state average:
- Unemployed percentage below state average.
- Black race population percentage significantly above state average.
- Hispanic race population percentage significantly above state average.
- Median age significantly below state average.
- Foreign-born population percentage significantly above state average.
- Renting percentage above state average.
Norristown on our top lists:
- #35 on the list of "Top 101 cities with the largest percentage of people in mental (psychiatric) hospitals or wards (population 1,000+)"
- #52 on the list of "Top 100 cities with old houses but young residents (pop. 5,000+)"
- #58 on the list of "Top 101 cities with the highest number of robberies per 100,000 residents, excludes tourist destinations and others with a lot of outsiders visiting based on city industries data (population 5,000+)"
- #79 on the list of "Top 101 cities with the smallest percentage of one, detached housing units in structures (2,000+ housing units)"
- #13 on the list of "Top 101 counties with the most Mainline Protestant adherents"
- #15 on the list of "Top 101 counties with the most Mainline Protestant congregations"
- #28 on the list of "Top 101 counties with the lowest average weight of females"
- #30 on the list of "Top 101 counties with the largest number of people without health insurance coverage in 2000 (pop. 50,000+)"
- #37 on the list of "Top 101 counties with the most Catholic adherents"

|
|
Total of 517 patent applications in 2008-2024.