King of Prussia, Pennsylvania Submit your own pictures of this place and show them to the world
OSM Map
General Map
Google Map
MSN Map
OSM Map
General Map
Google Map
MSN Map
OSM Map
General Map
Google Map
MSN Map
OSM Map
General Map
Google Map
MSN Map
Please wait while loading the map...
Population in 2010: 19,936. Population change since 2000: +7.7%Males: 9,994 Females: 9,942
March 2022 cost of living index in King of Prussia: 107.0 (more than average, U.S. average is 100) Percentage of residents living in poverty in 2022: 3.9%for White Non-Hispanic residents , 2.2% for Black residents , 1.3% for Hispanic or Latino residents , 100.0% for American Indian residents , 1.7% for two or more races residents )
Profiles of local businesses
Business Search - 14 Million verified businesses
Data:
Median household income ($)
Median household income (% change since 2000)
Household income diversity
Ratio of average income to average house value (%)
Ratio of average income to average rent
Median household income ($) - White
Median household income ($) - Black or African American
Median household income ($) - Asian
Median household income ($) - Hispanic or Latino
Median household income ($) - American Indian and Alaska Native
Median household income ($) - Multirace
Median household income ($) - Other Race
Median household income for houses/condos with a mortgage ($)
Median household income for apartments without a mortgage ($)
Races - White alone (%)
Races - White alone (% change since 2000)
Races - Black alone (%)
Races - Black alone (% change since 2000)
Races - American Indian alone (%)
Races - American Indian alone (% change since 2000)
Races - Asian alone (%)
Races - Asian alone (% change since 2000)
Races - Hispanic (%)
Races - Hispanic (% change since 2000)
Races - Native Hawaiian and Other Pacific Islander alone (%)
Races - Native Hawaiian and Other Pacific Islander alone (% change since 2000)
Races - Two or more races (%)
Races - Two or more races (% change since 2000)
Races - Other race alone (%)
Races - Other race alone (% change since 2000)
Racial diversity
Unemployment (%)
Unemployment (% change since 2000)
Unemployment (%) - White
Unemployment (%) - Black or African American
Unemployment (%) - Asian
Unemployment (%) - Hispanic or Latino
Unemployment (%) - American Indian and Alaska Native
Unemployment (%) - Multirace
Unemployment (%) - Other Race
Population density (people per square mile)
Population - Males (%)
Population - Females (%)
Population - Males (%) - White
Population - Males (%) - Black or African American
Population - Males (%) - Asian
Population - Males (%) - Hispanic or Latino
Population - Males (%) - American Indian and Alaska Native
Population - Males (%) - Multirace
Population - Males (%) - Other Race
Population - Females (%) - White
Population - Females (%) - Black or African American
Population - Females (%) - Asian
Population - Females (%) - Hispanic or Latino
Population - Females (%) - American Indian and Alaska Native
Population - Females (%) - Multirace
Population - Females (%) - Other Race
Coronavirus confirmed cases (Apr 27, 2024)
Deaths caused by coronavirus (Apr 27, 2024)
Coronavirus confirmed cases (per 100k population) (Apr 27, 2024)
Deaths caused by coronavirus (per 100k population) (Apr 27, 2024)
Daily increase in number of cases (Apr 27, 2024)
Weekly increase in number of cases (Apr 27, 2024)
Cases doubled (in days) (Apr 27, 2024)
Hospitalized patients (Apr 18, 2022)
Negative test results (Apr 18, 2022)
Total test results (Apr 18, 2022)
COVID Vaccine doses distributed (per 100k population) (Sep 19, 2023)
COVID Vaccine doses administered (per 100k population) (Sep 19, 2023)
COVID Vaccine doses distributed (Sep 19, 2023)
COVID Vaccine doses administered (Sep 19, 2023)
Likely homosexual households (%)
Likely homosexual households (% change since 2000)
Likely homosexual households - Lesbian couples (%)
Likely homosexual households - Lesbian couples (% change since 2000)
Likely homosexual households - Gay men (%)
Likely homosexual households - Gay men (% change since 2000)
Cost of living index
Median gross rent ($)
Median contract rent ($)
Median monthly housing costs ($)
Median house or condo value ($)
Median house or condo value ($ change since 2000)
Mean house or condo value by units in structure - 1, detached ($)
Mean house or condo value by units in structure - 1, attached ($)
Mean house or condo value by units in structure - 2 ($)
Mean house or condo value by units in structure by units in structure - 3 or 4 ($)
Mean house or condo value by units in structure - 5 or more ($)
Mean house or condo value by units in structure - Boat, RV, van, etc. ($)
Mean house or condo value by units in structure - Mobile home ($)
Median house or condo value ($) - White
Median house or condo value ($) - Black or African American
Median house or condo value ($) - Asian
Median house or condo value ($) - Hispanic or Latino
Median house or condo value ($) - American Indian and Alaska Native
Median house or condo value ($) - Multirace
Median house or condo value ($) - Other Race
Median resident age
Resident age diversity
Median resident age - Males
Median resident age - Females
Median resident age - White
Median resident age - Black or African American
Median resident age - Asian
Median resident age - Hispanic or Latino
Median resident age - American Indian and Alaska Native
Median resident age - Multirace
Median resident age - Other Race
Median resident age - Males - White
Median resident age - Males - Black or African American
Median resident age - Males - Asian
Median resident age - Males - Hispanic or Latino
Median resident age - Males - American Indian and Alaska Native
Median resident age - Males - Multirace
Median resident age - Males - Other Race
Median resident age - Females - White
Median resident age - Females - Black or African American
Median resident age - Females - Asian
Median resident age - Females - Hispanic or Latino
Median resident age - Females - American Indian and Alaska Native
Median resident age - Females - Multirace
Median resident age - Females - Other Race
Commute - mean travel time to work (minutes)
Travel time to work - Less than 5 minutes (%)
Travel time to work - Less than 5 minutes (% change since 2000)
Travel time to work - 5 to 9 minutes (%)
Travel time to work - 5 to 9 minutes (% change since 2000)
Travel time to work - 10 to 19 minutes (%)
Travel time to work - 10 to 19 minutes (% change since 2000)
Travel time to work - 20 to 29 minutes (%)
Travel time to work - 20 to 29 minutes (% change since 2000)
Travel time to work - 30 to 39 minutes (%)
Travel time to work - 30 to 39 minutes (% change since 2000)
Travel time to work - 40 to 59 minutes (%)
Travel time to work - 40 to 59 minutes (% change since 2000)
Travel time to work - 60 to 89 minutes (%)
Travel time to work - 60 to 89 minutes (% change since 2000)
Travel time to work - 90 or more minutes (%)
Travel time to work - 90 or more minutes (% change since 2000)
Marital status - Never married (%)
Marital status - Now married (%)
Marital status - Separated (%)
Marital status - Widowed (%)
Marital status - Divorced (%)
Median family income ($)
Median family income (% change since 2000)
Median non-family income ($)
Median non-family income (% change since 2000)
Median per capita income ($)
Median per capita income (% change since 2000)
Median family income ($) - White
Median family income ($) - Black or African American
Median family income ($) - Asian
Median family income ($) - Hispanic or Latino
Median family income ($) - American Indian and Alaska Native
Median family income ($) - Multirace
Median family income ($) - Other Race
Median year house/condo built
Median year apartment built
Year house built - Built 2005 or later (%)
Year house built - Built 2000 to 2004 (%)
Year house built - Built 1990 to 1999 (%)
Year house built - Built 1980 to 1989 (%)
Year house built - Built 1970 to 1979 (%)
Year house built - Built 1960 to 1969 (%)
Year house built - Built 1950 to 1959 (%)
Year house built - Built 1940 to 1949 (%)
Year house built - Built 1939 or earlier (%)
Average household size
Household density (households per square mile)
Average household size - White
Average household size - Black or African American
Average household size - Asian
Average household size - Hispanic or Latino
Average household size - American Indian and Alaska Native
Average household size - Multirace
Average household size - Other Race
Occupied housing units (%)
Vacant housing units (%)
Owner occupied housing units (%)
Renter occupied housing units (%)
Vacancy status - For rent (%)
Vacancy status - For sale only (%)
Vacancy status - Rented or sold, not occupied (%)
Vacancy status - For seasonal, recreational, or occasional use (%)
Vacancy status - For migrant workers (%)
Vacancy status - Other vacant (%)
Residents with income below the poverty level (%)
Residents with income below 50% of the poverty level (%)
Children below poverty level (%)
Poor families by family type - Married-couple family (%)
Poor families by family type - Male, no wife present (%)
Poor families by family type - Female, no husband present (%)
Poverty status for native-born residents (%)
Poverty status for foreign-born residents (%)
Poverty among high school graduates not in families (%)
Poverty among people who did not graduate high school not in families (%)
Residents with income below the poverty level (%) - White
Residents with income below the poverty level (%) - Black or African American
Residents with income below the poverty level (%) - Asian
Residents with income below the poverty level (%) - Hispanic or Latino
Residents with income below the poverty level (%) - American Indian and Alaska Native
Residents with income below the poverty level (%) - Multirace
Residents with income below the poverty level (%) - Other Race
Air pollution - Air Quality Index (AQI)
Air pollution - CO
Air pollution - NO2
Air pollution - SO2
Air pollution - Ozone
Air pollution - PM10
Air pollution - PM25
Air pollution - Pb
Crime - Murders per 100,000 population
Crime - Rapes per 100,000 population
Crime - Robberies per 100,000 population
Crime - Assaults per 100,000 population
Crime - Burglaries per 100,000 population
Crime - Thefts per 100,000 population
Crime - Auto thefts per 100,000 population
Crime - Arson per 100,000 population
Crime - City-data.com crime index
Crime - Violent crime index
Crime - Property crime index
Crime - Murders per 100,000 population (5 year average)
Crime - Rapes per 100,000 population (5 year average)
Crime - Robberies per 100,000 population (5 year average)
Crime - Assaults per 100,000 population (5 year average)
Crime - Burglaries per 100,000 population (5 year average)
Crime - Thefts per 100,000 population (5 year average)
Crime - Auto thefts per 100,000 population (5 year average)
Crime - Arson per 100,000 population (5 year average)
Crime - City-data.com crime index (5 year average)
Crime - Violent crime index (5 year average)
Crime - Property crime index (5 year average)
1996 Presidential Elections Results (%) - Democratic Party (Clinton)
1996 Presidential Elections Results (%) - Republican Party (Dole)
1996 Presidential Elections Results (%) - Other
2000 Presidential Elections Results (%) - Democratic Party (Gore)
2000 Presidential Elections Results (%) - Republican Party (Bush)
2000 Presidential Elections Results (%) - Other
2004 Presidential Elections Results (%) - Democratic Party (Kerry)
2004 Presidential Elections Results (%) - Republican Party (Bush)
2004 Presidential Elections Results (%) - Other
2008 Presidential Elections Results (%) - Democratic Party (Obama)
2008 Presidential Elections Results (%) - Republican Party (McCain)
2008 Presidential Elections Results (%) - Other
2012 Presidential Elections Results (%) - Democratic Party (Obama)
2012 Presidential Elections Results (%) - Republican Party (Romney)
2012 Presidential Elections Results (%) - Other
2016 Presidential Elections Results (%) - Democratic Party (Clinton)
2016 Presidential Elections Results (%) - Republican Party (Trump)
2016 Presidential Elections Results (%) - Other
2020 Presidential Elections Results (%) - Democratic Party (Biden)
2020 Presidential Elections Results (%) - Republican Party (Trump)
2020 Presidential Elections Results (%) - Other
Ancestries Reported - Arab (%)
Ancestries Reported - Czech (%)
Ancestries Reported - Danish (%)
Ancestries Reported - Dutch (%)
Ancestries Reported - English (%)
Ancestries Reported - French (%)
Ancestries Reported - French Canadian (%)
Ancestries Reported - German (%)
Ancestries Reported - Greek (%)
Ancestries Reported - Hungarian (%)
Ancestries Reported - Irish (%)
Ancestries Reported - Italian (%)
Ancestries Reported - Lithuanian (%)
Ancestries Reported - Norwegian (%)
Ancestries Reported - Polish (%)
Ancestries Reported - Portuguese (%)
Ancestries Reported - Russian (%)
Ancestries Reported - Scotch-Irish (%)
Ancestries Reported - Scottish (%)
Ancestries Reported - Slovak (%)
Ancestries Reported - Subsaharan African (%)
Ancestries Reported - Swedish (%)
Ancestries Reported - Swiss (%)
Ancestries Reported - Ukrainian (%)
Ancestries Reported - United States (%)
Ancestries Reported - Welsh (%)
Ancestries Reported - West Indian (%)
Ancestries Reported - Other (%)
Educational Attainment - No schooling completed (%)
Educational Attainment - Less than high school (%)
Educational Attainment - High school or equivalent (%)
Educational Attainment - Less than 1 year of college (%)
Educational Attainment - 1 or more years of college (%)
Educational Attainment - Associate degree (%)
Educational Attainment - Bachelor's degree (%)
Educational Attainment - Master's degree (%)
Educational Attainment - Professional school degree (%)
Educational Attainment - Doctorate degree (%)
School Enrollment - Nursery, preschool (%)
School Enrollment - Kindergarten (%)
School Enrollment - Grade 1 to 4 (%)
School Enrollment - Grade 5 to 8 (%)
School Enrollment - Grade 9 to 12 (%)
School Enrollment - College undergrad (%)
School Enrollment - Graduate or professional (%)
School Enrollment - Not enrolled in school (%)
School enrollment - Public schools (%)
School enrollment - Private schools (%)
School enrollment - Not enrolled (%)
Median number of rooms in houses and condos
Median number of rooms in apartments
Housing units lacking complete plumbing facilities (%)
Housing units lacking complete kitchen facilities (%)
Density of houses
Urban houses (%)
Rural houses (%)
Households with people 60 years and over (%)
Households with people 65 years and over (%)
Households with people 75 years and over (%)
Households with one or more nonrelatives (%)
Households with no nonrelatives (%)
Population in households (%)
Family households (%)
Nonfamily households (%)
Population in families (%)
Family households with own children (%)
Median number of bedrooms in owner occupied houses
Mean number of bedrooms in owner occupied houses
Median number of bedrooms in renter occupied houses
Mean number of bedrooms in renter occupied houses
Median number of vehichles in owner occupied houses
Mean number of vehichles in owner occupied houses
Median number of vehichles in renter occupied houses
Mean number of vehichles in renter occupied houses
Mortgage status - with mortgage (%)
Mortgage status - with second mortgage (%)
Mortgage status - with home equity loan (%)
Mortgage status - with both second mortgage and home equity loan (%)
Mortgage status - without a mortgage (%)
Average family size
Average family size - White
Average family size - Black or African American
Average family size - Asian
Average family size - Hispanic or Latino
Average family size - American Indian and Alaska Native
Average family size - Multirace
Average family size - Other Race
Geographical mobility - Same house 1 year ago (%)
Geographical mobility - Moved within same county (%)
Geographical mobility - Moved from different county within same state (%)
Geographical mobility - Moved from different state (%)
Geographical mobility - Moved from abroad (%)
Place of birth - Born in state of residence (%)
Place of birth - Born in other state (%)
Place of birth - Native, outside of US (%)
Place of birth - Foreign born (%)
Housing units in structures - 1, detached (%)
Housing units in structures - 1, attached (%)
Housing units in structures - 2 (%)
Housing units in structures - 3 or 4 (%)
Housing units in structures - 5 to 9 (%)
Housing units in structures - 10 to 19 (%)
Housing units in structures - 20 to 49 (%)
Housing units in structures - 50 or more (%)
Housing units in structures - Mobile home (%)
Housing units in structures - Boat, RV, van, etc. (%)
House/condo owner moved in on average (years ago)
Renter moved in on average (years ago)
Year householder moved into unit - Moved in 1999 to March 2000 (%)
Year householder moved into unit - Moved in 1995 to 1998 (%)
Year householder moved into unit - Moved in 1990 to 1994 (%)
Year householder moved into unit - Moved in 1980 to 1989 (%)
Year householder moved into unit - Moved in 1970 to 1979 (%)
Year householder moved into unit - Moved in 1969 or earlier (%)
Means of transportation to work - Drove car alone (%)
Means of transportation to work - Carpooled (%)
Means of transportation to work - Public transportation (%)
Means of transportation to work - Bus or trolley bus (%)
Means of transportation to work - Streetcar or trolley car (%)
Means of transportation to work - Subway or elevated (%)
Means of transportation to work - Railroad (%)
Means of transportation to work - Ferryboat (%)
Means of transportation to work - Taxicab (%)
Means of transportation to work - Motorcycle (%)
Means of transportation to work - Bicycle (%)
Means of transportation to work - Walked (%)
Means of transportation to work - Other means (%)
Working at home (%)
Industry diversity
Most Common Industries - Agriculture, forestry, fishing and hunting, and mining (%)
Most Common Industries - Agriculture, forestry, fishing and hunting (%)
Most Common Industries - Mining, quarrying, and oil and gas extraction (%)
Most Common Industries - Construction (%)
Most Common Industries - Manufacturing (%)
Most Common Industries - Wholesale trade (%)
Most Common Industries - Retail trade (%)
Most Common Industries - Transportation and warehousing, and utilities (%)
Most Common Industries - Transportation and warehousing (%)
Most Common Industries - Utilities (%)
Most Common Industries - Information (%)
Most Common Industries - Finance and insurance, and real estate and rental and leasing (%)
Most Common Industries - Finance and insurance (%)
Most Common Industries - Real estate and rental and leasing (%)
Most Common Industries - Professional, scientific, and management, and administrative and waste management services (%)
Most Common Industries - Professional, scientific, and technical services (%)
Most Common Industries - Management of companies and enterprises (%)
Most Common Industries - Administrative and support and waste management services (%)
Most Common Industries - Educational services, and health care and social assistance (%)
Most Common Industries - Educational services (%)
Most Common Industries - Health care and social assistance (%)
Most Common Industries - Arts, entertainment, and recreation, and accommodation and food services (%)
Most Common Industries - Arts, entertainment, and recreation (%)
Most Common Industries - Accommodation and food services (%)
Most Common Industries - Other services, except public administration (%)
Most Common Industries - Public administration (%)
Occupation diversity
Most Common Occupations - Management, business, science, and arts occupations (%)
Most Common Occupations - Management, business, and financial occupations (%)
Most Common Occupations - Management occupations (%)
Most Common Occupations - Business and financial operations occupations (%)
Most Common Occupations - Computer, engineering, and science occupations (%)
Most Common Occupations - Computer and mathematical occupations (%)
Most Common Occupations - Architecture and engineering occupations (%)
Most Common Occupations - Life, physical, and social science occupations (%)
Most Common Occupations - Education, legal, community service, arts, and media occupations (%)
Most Common Occupations - Community and social service occupations (%)
Most Common Occupations - Legal occupations (%)
Most Common Occupations - Education, training, and library occupations (%)
Most Common Occupations - Arts, design, entertainment, sports, and media occupations (%)
Most Common Occupations - Healthcare practitioners and technical occupations (%)
Most Common Occupations - Health diagnosing and treating practitioners and other technical occupations (%)
Most Common Occupations - Health technologists and technicians (%)
Most Common Occupations - Service occupations (%)
Most Common Occupations - Healthcare support occupations (%)
Most Common Occupations - Protective service occupations (%)
Most Common Occupations - Fire fighting and prevention, and other protective service workers including supervisors (%)
Most Common Occupations - Law enforcement workers including supervisors (%)
Most Common Occupations - Food preparation and serving related occupations (%)
Most Common Occupations - Building and grounds cleaning and maintenance occupations (%)
Most Common Occupations - Personal care and service occupations (%)
Most Common Occupations - Sales and office occupations (%)
Most Common Occupations - Sales and related occupations (%)
Most Common Occupations - Office and administrative support occupations (%)
Most Common Occupations - Natural resources, construction, and maintenance occupations (%)
Most Common Occupations - Farming, fishing, and forestry occupations (%)
Most Common Occupations - Construction and extraction occupations (%)
Most Common Occupations - Installation, maintenance, and repair occupations (%)
Most Common Occupations - Production, transportation, and material moving occupations (%)
Most Common Occupations - Production occupations (%)
Most Common Occupations - Transportation occupations (%)
Most Common Occupations - Material moving occupations (%)
People in Group quarters - Institutionalized population (%)
People in Group quarters - Correctional institutions (%)
People in Group quarters - Federal prisons and detention centers (%)
People in Group quarters - Halfway houses (%)
People in Group quarters - Local jails and other confinement facilities (including police lockups) (%)
People in Group quarters - Military disciplinary barracks (%)
People in Group quarters - State prisons (%)
People in Group quarters - Other types of correctional institutions (%)
People in Group quarters - Nursing homes (%)
People in Group quarters - Hospitals/wards, hospices, and schools for the handicapped (%)
People in Group quarters - Hospitals/wards and hospices for chronically ill (%)
People in Group quarters - Hospices or homes for chronically ill (%)
People in Group quarters - Military hospitals or wards for chronically ill (%)
People in Group quarters - Other hospitals or wards for chronically ill (%)
People in Group quarters - Hospitals or wards for drug/alcohol abuse (%)
People in Group quarters - Mental (Psychiatric) hospitals or wards (%)
People in Group quarters - Schools, hospitals, or wards for the mentally retarded (%)
People in Group quarters - Schools, hospitals, or wards for the physically handicapped (%)
People in Group quarters - Institutions for the deaf (%)
People in Group quarters - Institutions for the blind (%)
People in Group quarters - Orthopedic wards and institutions for the physically handicapped (%)
People in Group quarters - Wards in general hospitals for patients who have no usual home elsewhere (%)
People in Group quarters - Wards in military hospitals for patients who have no usual home elsewhere (%)
People in Group quarters - Juvenile institutions (%)
People in Group quarters - Long-term care (%)
People in Group quarters - Homes for abused, dependent, and neglected children (%)
People in Group quarters - Residential treatment centers for emotionally disturbed children (%)
People in Group quarters - Training schools for juvenile delinquents (%)
People in Group quarters - Short-term care, detention or diagnostic centers for delinquent children (%)
People in Group quarters - Type of juvenile institution unknown (%)
People in Group quarters - Noninstitutionalized population (%)
People in Group quarters - College dormitories (includes college quarters off campus) (%)
People in Group quarters - Military quarters (%)
People in Group quarters - On base (%)
People in Group quarters - Barracks, unaccompanied personnel housing (UPH), (Enlisted/Officer), ;and similar group living quarters for military personnel (%)
People in Group quarters - Transient quarters for temporary residents (%)
People in Group quarters - Military ships (%)
People in Group quarters - Group homes (%)
People in Group quarters - Homes or halfway houses for drug/alcohol abuse (%)
People in Group quarters - Homes for the mentally ill (%)
People in Group quarters - Homes for the mentally retarded (%)
People in Group quarters - Homes for the physically handicapped (%)
People in Group quarters - Other group homes (%)
People in Group quarters - Religious group quarters (%)
People in Group quarters - Dormitories (%)
People in Group quarters - Agriculture workers' dormitories on farms (%)
People in Group quarters - Job Corps and vocational training facilities (%)
People in Group quarters - Other workers' dormitories (%)
People in Group quarters - Crews of maritime vessels (%)
People in Group quarters - Other nonhousehold living situations (%)
People in Group quarters - Other noninstitutional group quarters (%)
Residents speaking English at home (%)
Residents speaking English at home - Born in the United States (%)
Residents speaking English at home - Native, born elsewhere (%)
Residents speaking English at home - Foreign born (%)
Residents speaking Spanish at home (%)
Residents speaking Spanish at home - Born in the United States (%)
Residents speaking Spanish at home - Native, born elsewhere (%)
Residents speaking Spanish at home - Foreign born (%)
Residents speaking other language at home (%)
Residents speaking other language at home - Born in the United States (%)
Residents speaking other language at home - Native, born elsewhere (%)
Residents speaking other language at home - Foreign born (%)
Class of Workers - Employee of private company (%)
Class of Workers - Self-employed in own incorporated business (%)
Class of Workers - Private not-for-profit wage and salary workers (%)
Class of Workers - Local government workers (%)
Class of Workers - State government workers (%)
Class of Workers - Federal government workers (%)
Class of Workers - Self-employed workers in own not incorporated business and Unpaid family workers (%)
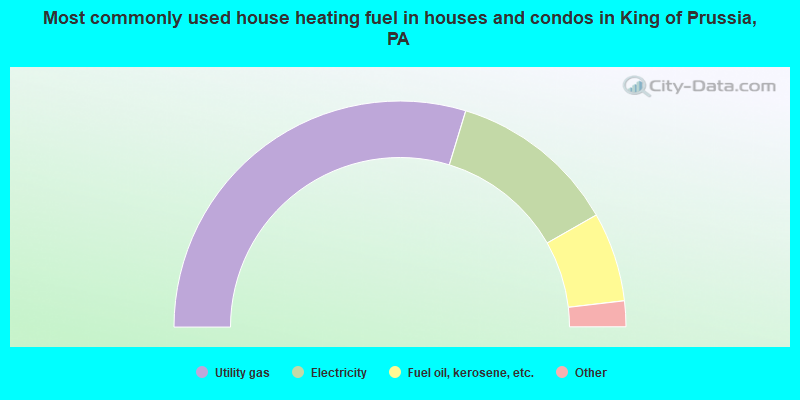
House heating fuel used in houses and condos - Utility gas (%)
House heating fuel used in houses and condos - Bottled, tank, or LP gas (%)
House heating fuel used in houses and condos - Electricity (%)
House heating fuel used in houses and condos - Fuel oil, kerosene, etc. (%)
House heating fuel used in houses and condos - Coal or coke (%)
House heating fuel used in houses and condos - Wood (%)
House heating fuel used in houses and condos - Solar energy (%)
House heating fuel used in houses and condos - Other fuel (%)
House heating fuel used in houses and condos - No fuel used (%)
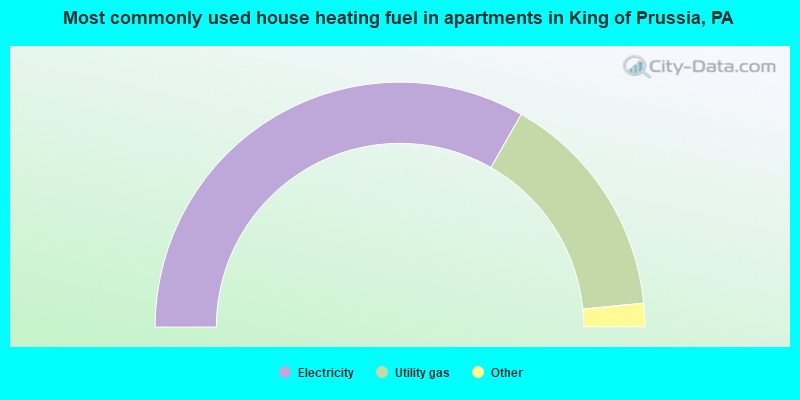
House heating fuel used in apartments - Utility gas (%)
House heating fuel used in apartments - Bottled, tank, or LP gas (%)
House heating fuel used in apartments - Electricity (%)
House heating fuel used in apartments - Fuel oil, kerosene, etc. (%)
House heating fuel used in apartments - Coal or coke (%)
House heating fuel used in apartments - Wood (%)
House heating fuel used in apartments - Solar energy (%)
House heating fuel used in apartments - Other fuel (%)
House heating fuel used in apartments - No fuel used (%)
Armed forces status - In Armed Forces (%)
Armed forces status - Civilian (%)
Armed forces status - Civilian - Veteran (%)
Armed forces status - Civilian - Nonveteran (%)
Fatal accidents locations in years 2005-2021
Fatal accidents locations in 2005
Fatal accidents locations in 2006
Fatal accidents locations in 2007
Fatal accidents locations in 2008
Fatal accidents locations in 2009
Fatal accidents locations in 2010
Fatal accidents locations in 2011
Fatal accidents locations in 2012
Fatal accidents locations in 2013
Fatal accidents locations in 2014
Fatal accidents locations in 2015
Fatal accidents locations in 2016
Fatal accidents locations in 2017
Fatal accidents locations in 2018
Fatal accidents locations in 2019
Fatal accidents locations in 2020
Fatal accidents locations in 2021
Alcohol use - People drinking some alcohol every month (%)
Alcohol use - People not drinking at all (%)
Alcohol use - Average days/month drinking alcohol
Alcohol use - Average drinks/week
Alcohol use - Average days/year people drink much
Audiometry - Average condition of hearing (%)
Audiometry - People that can hear a whisper from across a quiet room (%)
Audiometry - People that can hear normal voice from across a quiet room (%)
Audiometry - Ears ringing, roaring, buzzing (%)
Audiometry - Had a job exposure to loud noise (%)
Audiometry - Had off-work exposure to loud noise (%)
Blood Pressure & Cholesterol - Has high blood pressure (%)
Blood Pressure & Cholesterol - Checking blood pressure at home (%)
Blood Pressure & Cholesterol - Frequently checking blood cholesterol (%)
Blood Pressure & Cholesterol - Has high cholesterol level (%)
Consumer Behavior - Money monthly spent on food at supermarket/grocery store
Consumer Behavior - Money monthly spent on food at other stores
Consumer Behavior - Money monthly spent on eating out
Consumer Behavior - Money monthly spent on carryout/delivered foods
Consumer Behavior - Income spent on food at supermarket/grocery store (%)
Consumer Behavior - Income spent on food at other stores (%)
Consumer Behavior - Income spent on eating out (%)
Consumer Behavior - Income spent on carryout/delivered foods (%)
Current Health Status - General health condition (%)
Current Health Status - Blood donors (%)
Current Health Status - Has blood ever tested for HIV virus (%)
Current Health Status - Left-handed people (%)
Dermatology - People using sunscreen (%)
Diabetes - Diabetics (%)
Diabetes - Had a blood test for high blood sugar (%)
Diabetes - People taking insulin (%)
Diet Behavior & Nutrition - Diet health (%)
Diet Behavior & Nutrition - Milk product consumption (# of products/month)
Diet Behavior & Nutrition - Meals not home prepared (#/week)
Diet Behavior & Nutrition - Meals from fast food or pizza place (#/week)
Diet Behavior & Nutrition - Ready-to-eat foods (#/month)
Diet Behavior & Nutrition - Frozen meals/pizza (#/month)
Drug Use - People that ever used marijuana or hashish (%)
Drug Use - Ever used hard drugs (%)
Drug Use - Ever used any form of cocaine (%)
Drug Use - Ever used heroin (%)
Drug Use - Ever used methamphetamine (%)
Health Insurance - People covered by health insurance (%)
Kidney Conditions-Urology - Avg. # of times urinating at night
Medical Conditions - People with asthma (%)
Medical Conditions - People with anemia (%)
Medical Conditions - People with psoriasis (%)
Medical Conditions - People with overweight (%)
Medical Conditions - Elderly people having difficulties in thinking or remembering (%)
Medical Conditions - People who ever received blood transfusion (%)
Medical Conditions - People having trouble seeing even with glass/contacts (%)
Medical Conditions - People with arthritis (%)
Medical Conditions - People with gout (%)
Medical Conditions - People with congestive heart failure (%)
Medical Conditions - People with coronary heart disease (%)
Medical Conditions - People with angina pectoris (%)
Medical Conditions - People who ever had heart attack (%)
Medical Conditions - People who ever had stroke (%)
Medical Conditions - People with emphysema (%)
Medical Conditions - People with thyroid problem (%)
Medical Conditions - People with chronic bronchitis (%)
Medical Conditions - People with any liver condition (%)
Medical Conditions - People who ever had cancer or malignancy (%)
Mental Health - People who have little interest in doing things (%)
Mental Health - People feeling down, depressed, or hopeless (%)
Mental Health - People who have trouble sleeping or sleeping too much (%)
Mental Health - People feeling tired or having little energy (%)
Mental Health - People with poor appetite or overeating (%)
Mental Health - People feeling bad about themself (%)
Mental Health - People who have trouble concentrating on things (%)
Mental Health - People moving or speaking slowly or too fast (%)
Mental Health - People having thoughts they would be better off dead (%)
Oral Health - Average years since last visit a dentist
Oral Health - People embarrassed because of mouth (%)
Oral Health - People with gum disease (%)
Oral Health - General health of teeth and gums (%)
Oral Health - Average days a week using dental floss/device
Oral Health - Average days a week using mouthwash for dental problem
Oral Health - Average number of teeth
Pesticide Use - Households using pesticides to control insects (%)
Pesticide Use - Households using pesticides to kill weeds (%)
Physical Activity - People doing vigorous-intensity work activities (%)
Physical Activity - People doing moderate-intensity work activities (%)
Physical Activity - People walking or bicycling (%)
Physical Activity - People doing vigorous-intensity recreational activities (%)
Physical Activity - People doing moderate-intensity recreational activities (%)
Physical Activity - Average hours a day doing sedentary activities
Physical Activity - Average hours a day watching TV or videos
Physical Activity - Average hours a day using computer
Physical Functioning - People having limitations keeping them from working (%)
Physical Functioning - People limited in amount of work they can do (%)
Physical Functioning - People that need special equipment to walk (%)
Physical Functioning - People experiencing confusion/memory problems (%)
Physical Functioning - People requiring special healthcare equipment (%)
Prescription Medications - Average number of prescription medicines taking
Preventive Aspirin Use - Adults 40+ taking low-dose aspirin (%)
Reproductive Health - Vaginal deliveries (%)
Reproductive Health - Cesarean deliveries (%)
Reproductive Health - Deliveries resulted in a live birth (%)
Reproductive Health - Pregnancies resulted in a delivery (%)
Reproductive Health - Women breastfeeding newborns (%)
Reproductive Health - Women that had a hysterectomy (%)
Reproductive Health - Women that had both ovaries removed (%)
Reproductive Health - Women that have ever taken birth control pills (%)
Reproductive Health - Women taking birth control pills (%)
Reproductive Health - Women that have ever used Depo-Provera or injectables (%)
Reproductive Health - Women that have ever used female hormones (%)
Sexual Behavior - People 18+ that ever had sex (vaginal, anal, or oral) (%)
Sexual Behavior - Males 18+ that ever had vaginal sex with a woman (%)
Sexual Behavior - Males 18+ that ever performed oral sex on a woman (%)
Sexual Behavior - Males 18+ that ever had anal sex with a woman (%)
Sexual Behavior - Males 18+ that ever had any sex with a man (%)
Sexual Behavior - Females 18+ that ever had vaginal sex with a man (%)
Sexual Behavior - Females 18+ that ever performed oral sex on a man (%)
Sexual Behavior - Females 18+ that ever had anal sex with a man (%)
Sexual Behavior - Females 18+ that ever had any kind of sex with a woman (%)
Sexual Behavior - Average age people first had sex
Sexual Behavior - Average number of female sex partners in lifetime (males 18+)
Sexual Behavior - Average number of female vaginal sex partners in lifetime (males 18+)
Sexual Behavior - Average age people first performed oral sex on a woman (18+)
Sexual Behavior - Average number of woman performed oral sex on in lifetime (18+)
Sexual Behavior - Average number of male sex partners in lifetime (males 18+)
Sexual Behavior - Average number of male anal sex partners in lifetime (males 18+)
Sexual Behavior - Average age people first performed oral sex on a man (18+)
Sexual Behavior - Average number of male oral sex partners in lifetime (18+)
Sexual Behavior - People using protection when performing oral sex (%)
Sexual Behavior - Average number of times people have vaginal or anal sex a year
Sexual Behavior - People having sex without condom (%)
Sexual Behavior - Average number of male sex partners in lifetime (females 18+)
Sexual Behavior - Average number of male vaginal sex partners in lifetime (females 18+)
Sexual Behavior - Average number of female sex partners in lifetime (females 18+)
Sexual Behavior - Circumcised males 18+ (%)
Sleep Disorders - Average hours sleeping at night
Sleep Disorders - People that has trouble sleeping (%)
Smoking-Cigarette Use - People smoking cigarettes (%)
Taste & Smell - People 40+ having problems with smell (%)
Taste & Smell - People 40+ having problems with taste (%)
Taste & Smell - People 40+ that ever had wisdom teeth removed (%)
Taste & Smell - People 40+ that ever had tonsils teeth removed (%)
Taste & Smell - People 40+ that ever had a loss of consciousness because of a head injury (%)
Taste & Smell - People 40+ that ever had a broken nose or other serious injury to face or skull (%)
Taste & Smell - People 40+ that ever had two or more sinus infections (%)
Weight - Average height (inches)
Weight - Average weight (pounds)
Weight - Average BMI
Weight - People that are obese (%)
Weight - People that ever were obese (%)
Weight - People trying to lose weight (%)
Latest news from King of Prussia, PA collected exclusively by city-data.com from local newspapers, TV, and radio stations
Ancestries: Italian (8.6%), Irish (6.3%), German (3.9%), American (3.1%), Polish (2.7%), English (1.8%).
Current Local Time:
Land area: 8.40 square miles.
Population density: 2,372 people per square mile (low).
5,929 residents are foreign born (17.5% Asia , 2.6% Europe , 2.5% Latin America ).
This place:
24.0%Pennsylvania:
7.3%
Median real estate property taxes paid for housing units with mortgages in 2022: $3,541 (0.9%)Median real estate property taxes paid for housing units with no mortgage in 2022: $3,541 (0.9%)
Nearest city with pop. 50,000+: Philadelphia, PA
Nearest cities:
Latitude: 40.09 N, Longitude: 75.38 W
Daytime population change due to commuting: +23,766 (+96.4%)Workers who live and work in this place: 7,446 (51.6%)
Property values in King of Prussia, PA
King of Prussia tourist attractions:
Unemployment in December 2023: Here:
2.4%Pennsylvania:
2.9%
Most common occupations in King of Prussia, PA (%)
Both Males Females
Computer specialists (9.3%)
Other management occupations, except farmers and farm managers (5.9%)
Other office and administrative support workers, including supervisors (5.2%)
Sales representatives, services, wholesale and manufacturing (4.3%)
Retail sales workers, except cashiers (4.0%)
Secretaries and administrative assistants (3.8%)
Accountants and auditors (3.7%)
Computer specialists (12.3%)
Other management occupations, except farmers and farm managers (6.3%)
Sales representatives, services, wholesale and manufacturing (6.1%)
Retail sales workers, except cashiers (4.6%)
Engineers (3.9%)
Accountants and auditors (3.6%)
Other sales and related occupations, including supervisors (3.6%)
Secretaries and administrative assistants (7.8%)
Other office and administrative support workers, including supervisors (7.6%)
Computer specialists (5.9%)
Other management occupations, except farmers and farm managers (5.6%)
Preschool, kindergarten, elementary, and middle school teachers (4.9%)
Registered nurses (3.9%)
Accountants and auditors (3.9%)
Tornado activity:
King of Prussia-area historical tornado activity is slightly above Pennsylvania state average. It is 7% greater than the overall U.S. average.
On 3/22/1955, a category F3 (max. wind speeds 158-206 mph) tornado 5.8 miles away from the King of Prussia place center killed one person and caused between $50,000 and $500,000 in damages.
On 7/27/1994, a category F3 tornado 12.0 miles away from the place center killed 3 people and injured 25 people and caused between $5,000,000 and $50,000,000 in damages.
Earthquake activity:
King of Prussia-area historical earthquake activity is significantly above Pennsylvania state average. It is 65% smaller than the overall U.S. average. On 8/23/2011 at 17:51:04, a magnitude 5.8 (5.8 MW, Depth: 3.7 mi, Class: Moderate, Intensity: VI - VII) earthquake occurred 204.3 miles away from the city center On 1/16/1994 at 01:49:16, a magnitude 4.6 (4.6 MB, 4.6 LG, Depth: 3.1 mi, Class: Light, Intensity: IV - V) earthquake occurred 38.4 miles away from the city center On 1/16/1994 at 00:42:43, a magnitude 4.2 (4.2 MB, 4.0 LG, Depth: 3.1 mi) earthquake occurred 36.9 miles away from King of Prussia center On 10/7/1983 at 10:18:46, a magnitude 5.3 (5.1 MB, 5.3 LG, 5.1 ML) earthquake occurred 272.1 miles away from King of Prussia center On 11/30/2017 at 21:47:31, a magnitude 4.1 (4.1 MW, Depth: 6.1 mi) earthquake occurred 62.1 miles away from King of Prussia center On 9/25/1998 at 19:52:52, a magnitude 5.2 (4.8 MB, 4.3 MS, 5.2 LG, 4.5 MW, Depth: 3.1 mi) earthquake occurred 279.9 miles away from King of Prussia center Magnitude types: regional Lg-wave magnitude (LG), body-wave magnitude (MB), local magnitude (ML), surface-wave magnitude (MS), moment magnitude (MW) Natural disasters: The number of natural disasters in Montgomery County (26) is a lot greater than the US average (15).Major Disasters (Presidential) Declared: 20Emergencies Declared: 6Hurricanes: 7, Floods: 5, Winter Storms: 5, Storms: 4, Tropical Storms: 4, Snowstorms: 3, Blizzard: 1, Mudslide: 1, Snowfall: 1, Tropical Depression: 1, Water Shortage: 1, Other: 1 (Note: some incidents may be assigned to more than one category). Main business address for: GSI COMMERCE INC RETAIL-CATALOG & MAIL-ORDER HOUSES ), OWOSSO CORP MOTORS & GENERATORS ), INTERDIGITAL COMMUNICATIONS CORP PATENT OWNERS & LESSORS ), Allied Security Holdings LLC SERVICES-DETECTIVE, GUARD & ARMORED CAR SERVICES ), UGI CORP /PA/ GAS & OTHER SERVICES COMBINED ), SEDONA CORP SERVICES-PREPACKAGED SOFTWARE ), AMERIGAS FINANCE CORP RETAIL-RETAIL STORES, NEC ), UNIVERSAL HEALTH SERVICES INC SERVICES-GENERAL MEDICAL & SURGICAL HOSPITALS, NEC ) and 3 other public companies .
Hospitals and medical centers in King of Prussia: AMEDISYS HOME HEALTH (620 FREEDOM BUSINESS CENTER STE 105)
CHILDRENS HOSP HOME CARE (950 PULASKI DRIVE)
MANORCARE HEALTH SERVICES-KING OF PRUSSIA (600 WEST VALLEY FORGE ROAD)
Heliports located in King of Prussia: Amtrak stations near King of Prussia: 7 miles: PAOLI (LANCASTER PIKE & S. VALLEY RD.) Services: ticket office, enclosed waiting area, public restrooms, public payphones, ATM, paid short-term parking, paid long-term parking, call for car rental service, call for taxi service, public transit connection.
8 miles: ARDMORE (STATION RD. & LANCASTER AVE.) Services: enclosed waiting area, public restrooms, public payphones, paid short-term parking, call for car rental service, call for taxi service, public transit connection.
14 miles: NORTH PHILADELPHIA (PHILADELPHIA, 2900 N. BROAD ST.) Services: ticket office, fully wheelchair accessible, enclosed waiting area, public restrooms, public payphones, paid short-term parking, paid long-term parking, call for taxi service, public transit connection.
Operable nuclear power plants near King of Prussia:
18 miles: Limerick 1 and 2 in Pottstown, PA.
College/University in King of Prussia: Cortiva Institute-Pennsylvania School of Muscle Therapy Full-time enrollment: 172; Location: 211 South Gulph Road Suite 100; Private, for-profit; Website: www.cortiva.com)
Colleges/universities with over 2000 students nearest to King of Prussia:
Cabrini College (about 3 miles; Radnor, PA ; Full-time enrollment: 2,304)
Eastern University (about 3 miles; Saint Davids, PA ; FT enrollment: 3,220)
Villanova University (about 5 miles; Villanova, PA ; FT enrollment: 9,350)
Montgomery County Community College (about 8 miles; Blue Bell, PA ; FT enrollment: 8,723)
Delaware County Community College (about 9 miles; Media, PA ; FT enrollment: 8,419)
Saint Joseph's University (about 11 miles; Philadelphia, PA ; FT enrollment: 7,329)
Gwynedd Mercy University (about 11 miles; Gwynedd Valley, PA ; FT enrollment: 2,125)
Public high schools in King of Prussia:
Public elementary/middle schools in King of Prussia: UPPER MERION MS Students: 1,113, Location: 450 CROSSFIELD ROAD, Grades: 5-8)CALEY EL SCH Students: 412, Location: 725 CALEY ROAD, Grades: KG-4)CANDLEBROOK EL SCH Students: 359, Location: 310 PRINCE FREDERICK ST, Grades: KG-4)Private elementary/middle school in King of Prussia: MOTHER DIVINE PROVIDENCE SCHOOL Students: 275, Location: 405 ALLENDALE RD, Grades: PK-8)
See full list of schools located in King of Prussia Library in King of Prussia: UPPER MERION TOWNSHIP LIBRARY Operating income: $1,741,132; Location: 175 W VALLEY FORGE RD; 128,611 books ; 8,692 audio materials ; 5,892 video materials ; 5 local licensed databases ; 41 state licensed databases ; 5 other licensed databases ; 200 print serial subscriptions )
Notable locations in King of Prussia: (A) , King of Prussia Plaza (B) , King of Prussia Industrial Park (C) , General Electric Space Center (D) , Court at King of Prussia (E) , Shainline Station (F) , Gulph Station (G) , King of Prussia Station (H) , Valley Forge Country Club (I) , American Baptist and Freedom Business Center (J) , Hughes Park Station (K) , Gulph Mills Business Park (L) , King of Prussia Business Center (M) , Valley Forge Convention Center (N) , Abrams Station (O) , King of Prussia Chamber of Commerce (P) , King of Prussia Library (Q) , King of Prussia Fire Company (R) , King of Prussia Fire Company Substation (S) , Lafayette Ambulance (T) . Display/hide their locations on the map
Shopping Centers: (1) , Dekalb Plaza Shopping Center (2) , King of Prussia Mall Shopping Center (3) , Plaza King of Prussia Shopping Center (4) , Valley Forge Center Shopping Center (5) , Valley Forge Plaza Shopping Center (6) , The Court at King of Prussia Shopping Center (7) . Display/hide their locations on the map
Main business address in King of Prussia include: (A) , OWOSSO CORP (B) , INTERDIGITAL COMMUNICATIONS CORP (C) , UGI CORP /PA/ (D) , SEDONA CORP (E) , AMERIGAS FINANCE CORP (F) , UNIVERSAL HEALTH SERVICES INC (G) . Display/hide their locations on the map
Churches in King of Prussia include: (A) , Valley Forge Presbyterian Church (B) , Upper Merion Baptist Church (C) , King of Prussia Church of Christ (D) , Abrams Community Chapel (E) . Display/hide their locations on the map
Cemeteries: (1) , Saint Augustines Cemetery (2) , Ukranian Greek Catholic Cemetery (3) , Roberts Cemetery (4) . Display/hide their locations on the map
Creek: (A) . Display/hide its location on the map
Parks in King of Prussia include: (1) , Merion View Park (2) , Valley Forge Acres Park (3) , Upper Merion Township Park (4) . Display/hide their locations on the map
Birthplace of: Lisa Salters - Basketball player, Kit Osbourne - Professional wrestler.
Montgomery County has a predicted average indoor radon screening level greater than 4 pCi/L (pico curies per liter) - Highest Potential Drinking water stations with addresses in King of Prussia and their reported violations in the past:
VALLEY FORGE NATL PARK (Population served: 2,300, Groundwater):
Past monitoring violations:
One routine major monitoring violation
5 minor monitoring violations
2 regular monitoring violations
Average household size: This place:
2.3 peoplePennsylvania:
2.5 people
Percentage of family households: This place:
58.9%Whole state:
65.0%
Percentage of households with unmarried partners: This place:
5.2%Whole state:
6.6%
Likely homosexual households (counted as self-reported same-sex unmarried-partner households)
Lesbian couples: 0.2% of all households Gay men: 0.4% of all households
130 people in nursing facilities/skilled-nursing facilities in 2010people in other noninstitutional facilities in 2010people in nursing homes in 2000people in religious group quarters in 2000
For population 15 years and over in King of Prussia:
Never married: 36.0%Now married: 51.7%Separated: 0.9%Widowed: 4.4%Divorced: 7.0% For population 25 years and over in King of Prussia:
High school or higher: 96.6%Bachelor's degree or higher: 64.5%Graduate or professional degree: 23.8%Unemployed: 3.1%Mean travel time to work (commute): 16.3 minutes
Education Gini index (Inequality in education) Here:
9.2Pennsylvania average:
11.4
Religion statistics for King of Prussia, PA (based on Montgomery County data)
Religion Adherents Congregations Catholic 301,220 55 Mainline Protestant 103,475 221 Evangelical Protestant 54,215 269 Other 43,532 68 Black Protestant 3,190 11 Orthodox 2,945 9 None 291,297 -
Source: Clifford Grammich, Kirk Hadaway, Richard Houseal, Dale E.Jones, Alexei Krindatch, Richie Stanley and Richard H.Taylor. 2012. 2010 U.S.Religion Census: Religious Congregations & Membership Study. Association of Statisticians of American Religious Bodies. Jones, Dale E., et al. 2002. Congregations and Membership in the United States 2000. Nashville, TN: Glenmary Research Center. Graphs represent county-level data
Food Environment Statistics: Number of grocery stores : 126Montgomery County :
1.63 / 10,000 pop.State :
2.04 / 10,000 pop.
Number of supercenters and club stores : 4Here :
0.05 / 10,000 pop.Pennsylvania :
0.09 / 10,000 pop.
Number of convenience stores (no gas) : 90This county :
1.16 / 10,000 pop.Pennsylvania :
0.88 / 10,000 pop.
Number of convenience stores (with gas) : 137Montgomery County :
1.77 / 10,000 pop.State :
2.52 / 10,000 pop.
Number of full-service restaurants : 590This county :
7.61 / 10,000 pop.State :
7.12 / 10,000 pop.
Adult diabetes rate : Montgomery County :
8.3%Pennsylvania :
9.1%
Adult obesity rate : Montgomery County :
23.4%Pennsylvania :
27.2%
Low-income preschool obesity rate : This county :
10.8%Pennsylvania :
11.5%
Health and Nutrition: Healthy diet rate : King of Prussia:
57.3%Pennsylvania:
50.2%
Average overall health of teeth and gums : King of Prussia:
57.0%State:
47.1%
Average BMI : King of Prussia:
27.4Pennsylvania:
28.7
People feeling badly about themselves : King of Prussia:
17.2%State:
20.8%
People not drinking alcohol at all : King of Prussia:
9.2%Pennsylvania:
10.9%
Average hours sleeping at night : Overweight people : King of Prussia:
31.3%State:
34.3%
General health condition : King of Prussia:
63.4%Pennsylvania:
56.2%
Average condition of hearing : Here:
81.8%Pennsylvania:
78.3%
More about Health and Nutrition of King of Prussia, PA Residents
6.73% of this county's 2021 resident taxpayers lived in other counties in 2020 ($101,242 average adjusted gross income )
Here:
6.73%Pennsylvania average:
5.27%
0.01% of residents moved from foreign countries ($62 average AGI )Montgomery County:
0.01%Pennsylvania average:
0.01%
Top counties from which taxpayers relocated into this county between 2020 and 2021:
6.38% of this county's 2020 resident taxpayers moved to other counties in 2021 ($104,034 average adjusted gross income )
Here:
6.38%Pennsylvania average:
5.44%
0.01% of residents moved to foreign countries ($121 average AGI )Montgomery County:
0.01%Pennsylvania average:
0.01%
Top counties to which taxpayers relocated from this county between 2020 and 2021:
Businesses in King of Prussia, PA
Name Count Name Count
ALDO 2 Jones New York 5 AT&T 2 Journeys 1 Abercrombie & Fitch 1 Juicy Couture 1 Abercrombie Kids 1 Justice 1 Aeropostale 1 Kroger 1 Aerosoles 1 LA Fitness 1 American Eagle Outfitters 2 La-Z-Boy 1 Ann Taylor 2 Lane Bryant 1 Apple Store 1 Lane Furniture 1 Baja Fresh Mexican Grill 1 LensCrafters 2 Bakers 1 Levi Strauss & Co. 1 Bally Total Fitness 1 Macy's 1 Banana Republic 1 Marriott 1 Bath & Body Works 2 McDonald's 1 Bebe 1 Men's Wearhouse 1 Bed Bath & Beyond 1 Motel 6 1 Best Western 1 Motherhood Maternity 3 Brooks Brothers 1 New Balance 3 Brookstone 1 New York & Co 1 Budget Car Rental 1 Nike 14 Burger King 2 Nordstrom 2 CVS 1 Old Navy 1 Cache 1 Pac Sun 1 Casual Male XL 1 Panera Bread 1 Charlotte Russe 1 Papa John's Pizza 1 Chick-Fil-A 1 Payless 1 Chico's 1 Penske 1 Clarks 1 Pier 1 Imports 1 Cold Stone Creamery 1 Pottery Barn 1 Coldwater Creek 1 Pottery Barn Kids 1 Comfort Inn 1 RadioShack 1 Costco 1 Raymour & Flanigan 1 Crate & Barrel 1 Red Lobster 1 Cricket Wireless 1 Rite Aid 1 DHL 1 Ryder Rental & Truck Leasing 1 Dairy Queen 1 Safeway 1 Dunkin Donuts 2 Sephora 1 Eddie Bauer 1 Skechers USA 1 Express 1 Soma Intimates 1 FedEx 9 Spencer Gifts 1 Finish Line 1 Sprint Nextel 2 Foot Locker 1 Staples 1 Forever 21 1 Starbucks 5 Fredericks Of Hollywood 1 Subway 2 GNC 2 T-Mobile 4 GameStop 2 T.G.I. Driday's 1 Gap 1 Taco Bell 1 Giant 1 Talbots 2 Gymboree 1 The Cheesecake Factory 1 H&M 2 The Limited 1 H&R Block 2 The Room Place 2 Haagen-Dazs 1 Toys"R"Us 1 Hilton 1 U-Haul 3 Holiday Inn 2 UPS 16 Hollister Co. 1 Urban Outfitters 1 Home Depot 1 Vans 4 Homestead Studio Suites 1 Verizon Wireless 1 Hot Topic 1 Victoria's Secret 2 Hyatt 1 Vons 1 J. Jill 1 Walgreens 1 J.Crew 2 Walmart 1 JCPenney 1 Wendy's 1 JoS. A. Bank 1 Wet Seal 1
Strongest AM radio stations in King of Prussia:
WZZD (990 AM; 50 kW; PHILADELPHIA, PA; Owner: PENNSYLVANIA MEDIA ASSOCIATES, INC.)
KYW (1060 AM; 50 kW; PHILADELPHIA, PA; Owner: INFINITY BROADCASTING OPERATIONS, INC.)
WWDB (860 AM; daytime; 10 kW; PHILADELPHIA, PA)
WPEN (950 AM; 50 kW; PHILADELPHIA, PA; Owner: GREATER PHILADELPHIA RADIO, INC.)
WNWR (1540 AM; 50 kW; PHILADELPHIA, PA)
WFIL (560 AM; 5 kW; PHILADELPHIA, PA; Owner: PENNSYLVANIA MEDIA ASSOCIATES, INC.)
WVCH (740 AM; 50 kW; CHESTER, PA; Owner: WVCH COMMUNICATIONS, INC.)
WNAP (1110 AM; daytime; 5 kW; NORRISTOWN, PA; Owner: WNAP, INC)
WWJZ (640 AM; 50 kW; MOUNT HOLLY, NJ; Owner: ABC, INC.)
WPHT (1210 AM; 50 kW; PHILADELPHIA, PA; Owner: INFINITY BROADCASTING OPERATIONS, INC.)
WDAS (1480 AM; 5 kW; PHILADELPHIA, PA; Owner: AMFM RADIO LICENSES, L.L.C.)
WEEU (830 AM; 20 kW; READING, PA; Owner: WEEU BROADCASTING COMPANY)
WIP (610 AM; 5 kW; PHILADELPHIA, PA; Owner: INFINITY BROADCASTING CORPORATION OF PHILADELPHIA)
Strongest FM radio stations in King of Prussia:
WMWX (95.7 FM; PHILADELPHIA, PA; Owner: GREATER PHILADELPHIA RADIO, INC.)
WMGK (102.9 FM; PHILADELPHIA, PA; Owner: GREATER PHILADELPHIA RADIO, INC.)
WOGL (98.1 FM; PHILADELPHIA, PA; Owner: INFINITY BROADCASTING OPERATIONS, INC.)
WPLY (100.3 FM; MEDIA, PA; Owner: RADIO ONE LICENSES, LLC)
WSNI-FM (104.5 FM; PHILADELPHIA, PA; Owner: AMFM RADIO LICENSES, L.L.C.)
WYBF (89.1 FM; RADNOR TOWNSHIP, PA; Owner: CABRINI COLLEGE)
WPHI-FM (103.9 FM; JENKINTOWN, PA; Owner: RADIO ONE LICENSES, LLC)
WBEB (101.1 FM; PHILADELPHIA, PA; Owner: WEAZ-FM RADIO, INC.)
WRTI (90.1 FM; PHILADELPHIA, PA; Owner: TEMPLE UNIV. OF THE COMMONWEALTH, ET)
WYSP (94.1 FM; PHILADELPHIA, PA; Owner: INFINITY BROADCASTING OPERATIONS, INC.)
WXPN (88.5 FM; PHILADELPHIA, PA; Owner: TRUSTEES OF THE UNIVERSITY OF PENNA.)
WHYY-FM (90.9 FM; PHILADELPHIA, PA; Owner: WHYY, INC.)
WXTU (92.5 FM; PHILADELPHIA, PA; Owner: WXTU LICENSE LIMITED PARTNERSHIP)
WDAS-FM (105.3 FM; PHILADELPHIA, PA; Owner: AMFM RADIO LICENSES, L.L.C.)
WUSL (98.9 FM; PHILADELPHIA, PA; Owner: AMFM RADIO LICENSES, L.L.C.)
WPTP (96.5 FM; PHILADELPHIA, PA; Owner: WDAS LICENSE LIMITED PARTNERSHIP)
WIOQ (102.1 FM; PHILADELPHIA, PA; Owner: AMFM RADIO LICENSES, L.L.C.)
WXVU (89.1 FM; VILLANOVA, PA; Owner: VILLANOVA UNIVERSITY)
WJJZ (106.1 FM; PHILADELPHIA, PA; Owner: AMFM RADIO LICENSES, L.L.C.)
WMMR (93.3 FM; PHILADELPHIA, PA; Owner: GREATER BOSTON RADIO, INC.)
TV broadcast stations around King of Prussia:
KYW-TV (Channel 3; PHILADELPHIA, PA; Owner: CBS BROADCASTING INC.)
WPHL-TV (Channel 17; PHILADELPHIA, PA; Owner: TRIBUNE TELEVISION COMPANY)
WPPX (Channel 61; WILMINGTON, DE; Owner: PAXSON PHILADELPHIA LICENSE, INC.)
WPVI-TV (Channel 6; PHILADELPHIA, PA; Owner: ABC, INC.)
WPSG (Channel 57; PHILADELPHIA, PA; Owner: VIACOM STATIONS GROUP OF PHILADELPHIA INC.)
WCAU (Channel 10; PHILADELPHIA, PA; Owner: NBC SUBSIDIARY (WCAU-TV), L.P.)
WGTW (Channel 48; BURLINGTON, NJ; Owner: BRUNSON COMMUNICATIONS, INC.)
WYBE (Channel 35; PHILADELPHIA, PA; Owner: INDEPENDENCE PUBLIC MEDIA OF PHILADELPHIA, INC.)
WTXF-TV (Channel 29; PHILADELPHIA, PA; Owner: FOX TV STATIONS OF PHILADELPHIA)
WHYY-TV (Channel 12; WILMINGTON, DE; Owner: WHYY, INC.)
WELL-LP (Channel 8; WILLOW GROVE, ETC., PA; Owner: WORD OF GOD FELLOWSHIP, INC.)
WPHA-LP (Channel 63; PHILADELPHIA, PA; Owner: COMMERCIAL BROADCASTING CORP.)
WFPA-CA (Channel 28; PHILADELPHIA, PA; Owner: WXTV LICENSE PARTNERSHIP, G.P.)
WWJT-LP (Channel 7; PHILADELPHIA, PA; Owner: PHILADELPHIA TELEVISION NETWORK, INC)
WUVP (Channel 65; VINELAND, NJ; Owner: UNIVISION PHILADELPHIA LLC)
WTSD-CA (Channel 14; WILMINGTON, DE; Owner: PRIORITY COMMUNICATIONS MINISTRIES, INC.)
WNJT (Channel 52; TRENTON, NJ; Owner: NEW JERSEY PUBLIC BROADCASTING AUTHORITY)
WNJS (Channel 23; CAMDEN, NJ; Owner: NEW JERSEY PUBLIC BROADCASTING AUTHORITY)
WMCN-TV (Channel 53; ATLANTIC CITY, NJ; Owner: LENFEST BROADCASTING, LLC)
WTVE (Channel 51; READING, PA; Owner: READING BROADCASTING, INC.)
WFMZ-TV (Channel 69; ALLENTOWN, PA; Owner: MARANATHA BROADCASTING COMPANY, INC.)
WPSJ-LP (Channel 8; HAMMONTON, ETC., NJ; Owner: ENGLE BROADCASTING)
W40AZ (Channel 40; WILMINGTON, DE; Owner: NATIONAL MINORITY T.V., INC.)
W55BT (Channel 55; TALLEYVILLE, DE; Owner: MEDIACASTING LLC)
W33BT (Channel 33; CAMDEN, NJ; Owner: MEDIACASTING LLC)
National Bridge Inventory (NBI) Statistics 132 Number of bridges784ft / 239m Total length $9,914,000 Total costs3,337,138 Total average daily traffic240,512 Total average daily truck traffic
New bridges - historical statistics
2 Before 1900 1 1910-1919 1 1920-1929 2 1930-1939 1 1940-1949 28 1950-1959 19 1960-1969 6 1970-1979 8 1980-1989 9 1990-1999 49 2000-2009 6 2010-2019
See full National Bridge Inventory statistics for King of Prussia, PA
Home Mortgage Disclosure Act Aggregated Statistics For Year 2009(Based on 4 full and 3 partial tracts) A) FHA, FSA/RHS & VA B) Conventional C) Refinancings D) Home Improvement Loans F) Non-occupant Loans on Number Average Value Number Average Value Number Average Value Number Average Value Number Average Value
LOANS ORIGINATED 50 $248,315 119 $216,322 473 $208,868 32 $78,086 20 $160,892 APPLICATIONS APPROVED, NOT ACCEPTED 3 $259,000 10 $159,827 47 $216,924 5 $50,828 3 $76,840 APPLICATIONS DENIED 4 $248,268 13 $210,385 132 $242,126 22 $48,578 5 $182,582 APPLICATIONS WITHDRAWN 4 $331,962 14 $214,320 98 $222,561 3 $89,603 2 $212,220 FILES CLOSED FOR INCOMPLETENESS 0 $0 3 $230,513 23 $211,219 0 $0 1 $287,860
Aggregated Statistics For Year 2008(Based on 4 full and 3 partial tracts) A) FHA, FSA/RHS & VA B) Conventional C) Refinancings D) Home Improvement Loans F) Non-occupant Loans on Number Average Value Number Average Value Number Average Value Number Average Value Number Average Value
LOANS ORIGINATED 29 $255,016 158 $216,608 236 $189,149 64 $48,633 26 $192,470 APPLICATIONS APPROVED, NOT ACCEPTED 1 $122,000 17 $218,908 58 $192,318 14 $101,216 3 $225,507 APPLICATIONS DENIED 3 $265,113 17 $229,599 160 $206,232 43 $69,550 16 $143,716 APPLICATIONS WITHDRAWN 3 $174,087 19 $249,713 62 $226,869 4 $172,592 4 $217,545 FILES CLOSED FOR INCOMPLETENESS 0 $0 4 $207,845 17 $213,456 1 $28,540 0 $0
Aggregated Statistics For Year 2007(Based on 4 full and 3 partial tracts) A) FHA, FSA/RHS & VA B) Conventional C) Refinancings D) Home Improvement Loans F) Non-occupant Loans on Number Average Value Number Average Value Number Average Value Number Average Value Number Average Value
LOANS ORIGINATED 8 $231,589 218 $192,460 281 $171,372 79 $57,209 23 $183,793 APPLICATIONS APPROVED, NOT ACCEPTED 0 $0 37 $213,896 58 $160,807 25 $59,188 1 $283,760 APPLICATIONS DENIED 0 $0 13 $194,352 139 $210,993 43 $77,873 13 $226,416 APPLICATIONS WITHDRAWN 0 $0 21 $190,899 61 $210,265 5 $152,820 7 $369,447 FILES CLOSED FOR INCOMPLETENESS 0 $0 9 $203,928 22 $249,802 3 $62,567 2 $521,430
Aggregated Statistics For Year 2006(Based on 4 full and 3 partial tracts) A) FHA, FSA/RHS & VA B) Conventional C) Refinancings D) Home Improvement Loans F) Non-occupant Loans on G) Loans On Manufactured Number Average Value Number Average Value Number Average Value Number Average Value Number Average Value Number Average Value
LOANS ORIGINATED 5 $211,800 275 $192,810 323 $163,622 103 $66,612 40 $133,434 1 $74,000 APPLICATIONS APPROVED, NOT ACCEPTED 0 $0 43 $201,195 77 $141,410 23 $59,494 9 $226,801 1 $36,790 APPLICATIONS DENIED 0 $0 31 $198,726 178 $191,155 40 $80,060 16 $131,974 3 $96,090 APPLICATIONS WITHDRAWN 0 $0 26 $175,838 125 $173,666 6 $80,027 1 $256,290 0 $0 FILES CLOSED FOR INCOMPLETENESS 0 $0 11 $197,215 40 $203,338 4 $81,368 0 $0 0 $0
Aggregated Statistics For Year 2005(Based on 4 full and 3 partial tracts) A) FHA, FSA/RHS & VA B) Conventional C) Refinancings D) Home Improvement Loans E) Loans on Dwellings For 5+ Families F) Non-occupant Loans on G) Loans On Manufactured Number Average Value Number Average Value Number Average Value Number Average Value Number Average Value Number Average Value Number Average Value
LOANS ORIGINATED 8 $201,648 290 $178,292 419 $156,768 99 $54,373 2 $3,513,200 35 $127,552 1 $67,080 APPLICATIONS APPROVED, NOT ACCEPTED 0 $0 33 $183,498 84 $159,467 19 $48,698 0 $0 0 $0 1 $82,320 APPLICATIONS DENIED 0 $0 33 $178,472 167 $160,886 39 $55,253 0 $0 18 $137,649 2 $88,225 APPLICATIONS WITHDRAWN 0 $0 38 $177,404 130 $179,781 18 $102,657 0 $0 8 $104,159 1 $69,870 FILES CLOSED FOR INCOMPLETENESS 0 $0 6 $117,312 40 $199,282 9 $97,489 0 $0 2 $104,000 0 $0
Aggregated Statistics For Year 2004(Based on 4 full and 3 partial tracts) A) FHA, FSA/RHS & VA B) Conventional C) Refinancings D) Home Improvement Loans E) Loans on Dwellings For 5+ Families F) Non-occupant Loans on G) Loans On Manufactured Number Average Value Number Average Value Number Average Value Number Average Value Number Average Value Number Average Value Number Average Value
LOANS ORIGINATED 4 $168,045 271 $180,774 526 $151,175 95 $72,296 0 $0 29 $123,333 2 $12,805 APPLICATIONS APPROVED, NOT ACCEPTED 0 $0 28 $205,899 71 $143,950 11 $36,496 0 $0 2 $167,095 0 $0 APPLICATIONS DENIED 0 $0 28 $171,424 181 $151,515 47 $49,457 1 $333,450 12 $146,065 1 $25,000 APPLICATIONS WITHDRAWN 0 $0 30 $176,028 189 $166,473 18 $92,488 0 $0 7 $181,676 0 $0 FILES CLOSED FOR INCOMPLETENESS 0 $0 5 $162,942 40 $166,362 9 $92,969 0 $0 1 $74,000 0 $0
Aggregated Statistics For Year 2003(Based on 4 full and 3 partial tracts) A) FHA, FSA/RHS & VA B) Conventional C) Refinancings D) Home Improvement Loans F) Non-occupant Loans on Number Average Value Number Average Value Number Average Value Number Average Value Number Average Value
LOANS ORIGINATED 6 $163,055 252 $170,674 1,213 $140,107 91 $53,997 54 $125,397 APPLICATIONS APPROVED, NOT ACCEPTED 1 $171,000 30 $177,340 183 $133,824 32 $42,693 6 $105,567 APPLICATIONS DENIED 1 $187,000 22 $173,582 248 $139,260 43 $40,402 12 $83,212 APPLICATIONS WITHDRAWN 3 $143,687 29 $156,199 189 $154,285 10 $59,719 6 $132,457 FILES CLOSED FOR INCOMPLETENESS 0 $0 3 $159,683 32 $144,478 7 $57,641 4 $151,900
Aggregated Statistics For Year 2002(Based on 4 full and 2 partial tracts) A) FHA, FSA/RHS & VA B) Conventional C) Refinancings D) Home Improvement Loans F) Non-occupant Loans on Number Average Value Number Average Value Number Average Value Number Average Value Number Average Value
LOANS ORIGINATED 12 $1,539,062 278 $266,833 644 $157,941 85 $42,197 25 $113,538 APPLICATIONS APPROVED, NOT ACCEPTED 0 $0 30 $156,426 82 $107,291 26 $39,098 2 $133,390 APPLICATIONS DENIED 1 $17,400,000 19 $123,594 132 $118,749 43 $33,462 8 $37,464 APPLICATIONS WITHDRAWN 1 $27,938,250 18 $123,621 113 $382,655 8 $66,341 4 $112,822 FILES CLOSED FOR INCOMPLETENESS 0 $0 3 $134,333 45 $119,588 4 $86,905 0 $0
Aggregated Statistics For Year 2001(Based on 4 full and 2 partial tracts) A) FHA, FSA/RHS & VA B) Conventional C) Refinancings D) Home Improvement Loans E) Loans on Dwellings For 5+ Families F) Non-occupant Loans on Number Average Value Number Average Value Number Average Value Number Average Value Number Average Value Number Average Value
LOANS ORIGINATED 16 $144,678 248 $135,223 426 $126,477 63 $39,106 1 $57,600,000 12 $91,712 APPLICATIONS APPROVED, NOT ACCEPTED 1 $97,000 21 $144,473 81 $90,862 19 $24,505 0 $0 0 $0 APPLICATIONS DENIED 1 $173,160 7 $120,286 144 $91,457 18 $29,753 0 $0 4 $113,348 APPLICATIONS WITHDRAWN 2 $174,570 18 $129,370 83 $101,114 9 $42,346 0 $0 2 $80,000 FILES CLOSED FOR INCOMPLETENESS 0 $0 3 $79,480 36 $119,721 3 $86,840 0 $0 0 $0
Aggregated Statistics For Year 2000(Based on 4 full and 2 partial tracts) A) FHA, FSA/RHS & VA B) Conventional C) Refinancings D) Home Improvement Loans E) Loans on Dwellings For 5+ Families F) Non-occupant Loans on Number Average Value Number Average Value Number Average Value Number Average Value Number Average Value Number Average Value
LOANS ORIGINATED 31 $130,272 206 $129,430 121 $86,695 89 $29,923 1 $2,050,000 8 $54,856 APPLICATIONS APPROVED, NOT ACCEPTED 1 $129,490 9 $140,582 47 $83,574 19 $21,105 0 $0 2 $44,255 APPLICATIONS DENIED 2 $40,200 18 $124,128 73 $80,508 27 $19,404 0 $0 2 $38,000 APPLICATIONS WITHDRAWN 2 $85,805 13 $123,965 58 $77,940 12 $45,454 0 $0 3 $185,643 FILES CLOSED FOR INCOMPLETENESS 0 $0 5 $147,882 24 $100,812 1 $23,290 0 $0 0 $0
Aggregated Statistics For Year 1999(Based on 5 full and 2 partial tracts) A) FHA, FSA/RHS & VA B) Conventional C) Refinancings D) Home Improvement Loans F) Non-occupant Loans on Number Average Value Number Average Value Number Average Value Number Average Value Number Average Value
LOANS ORIGINATED 33 $126,363 213 $113,451 231 $93,770 95 $25,607 9 $72,804 APPLICATIONS APPROVED, NOT ACCEPTED 0 $0 13 $143,732 56 $80,999 18 $17,628 1 $49,120 APPLICATIONS DENIED 1 $147,350 17 $129,699 108 $85,722 31 $23,977 5 $101,896 APPLICATIONS WITHDRAWN 1 $214,030 21 $127,457 89 $91,562 16 $64,207 2 $103,550 FILES CLOSED FOR INCOMPLETENESS 3 $117,970 3 $148,843 14 $95,740 1 $3,000 0 $0
Detailed HMDA statistics for the following Tracts:
2058.01
, 2058.05 , 2058.06 , 2058.07 , 2058.08 , 2058.09 , 2059.05
Private Mortgage Insurance Companies Aggregated Statistics For Year 2009(Based on 4 full and 3 partial tracts) A) Conventional B) Refinancings C) Non-occupant Loans on Number Average Value Number Average Value Number Average Value
LOANS ORIGINATED 24 $240,253 11 $271,636 0 $0 APPLICATIONS APPROVED, NOT ACCEPTED 11 $235,170 4 $271,818 2 $287,865 APPLICATIONS DENIED 2 $194,225 2 $291,775 0 $0 APPLICATIONS WITHDRAWN 1 $229,000 0 $0 0 $0 FILES CLOSED FOR INCOMPLETENESS 0 $0 0 $0 0 $0
Aggregated Statistics For Year 2008(Based on 4 full and 3 partial tracts) A) Conventional B) Refinancings C) Non-occupant Loans on Number Average Value Number Average Value Number Average Value
LOANS ORIGINATED 52 $257,072 17 $275,492 2 $232,005 APPLICATIONS APPROVED, NOT ACCEPTED 8 $221,021 10 $263,338 2 $210,790 APPLICATIONS DENIED 1 $251,530 1 $266,390 0 $0 APPLICATIONS WITHDRAWN 1 $337,750 0 $0 0 $0 FILES CLOSED FOR INCOMPLETENESS 0 $0 1 $270,000 0 $0
Aggregated Statistics For Year 2007(Based on 4 full and 3 partial tracts) A) Conventional B) Refinancings C) Non-occupant Loans on Number Average Value Number Average Value Number Average Value
LOANS ORIGINATED 37 $258,541 14 $264,170 3 $184,447 APPLICATIONS APPROVED, NOT ACCEPTED 3 $265,440 2 $236,925 0 $0 APPLICATIONS DENIED 0 $0 0 $0 0 $0 APPLICATIONS WITHDRAWN 0 $0 1 $216,000 0 $0 FILES CLOSED FOR INCOMPLETENESS 0 $0 0 $0 0 $0
Aggregated Statistics For Year 2006(Based on 4 full and 3 partial tracts) A) Conventional B) Refinancings C) Non-occupant Loans on Number Average Value Number Average Value Number Average Value
LOANS ORIGINATED 27 $231,580 7 $259,554 1 $304,840 APPLICATIONS APPROVED, NOT ACCEPTED 9 $222,213 3 $283,933 0 $0 APPLICATIONS DENIED 0 $0 1 $294,390 0 $0 APPLICATIONS WITHDRAWN 3 $323,390 0 $0 0 $0 FILES CLOSED FOR INCOMPLETENESS 0 $0 0 $0 0 $0
Aggregated Statistics For Year 2005(Based on 4 full and 3 partial tracts) A) Conventional B) Refinancings C) Non-occupant Loans on Number Average Value Number Average Value Number Average Value
LOANS ORIGINATED 33 $213,863 8 $222,416 1 $178,800 APPLICATIONS APPROVED, NOT ACCEPTED 11 $211,396 5 $213,824 0 $0 APPLICATIONS DENIED 1 $135,000 0 $0 0 $0 APPLICATIONS WITHDRAWN 1 $162,000 1 $204,000 0 $0 FILES CLOSED FOR INCOMPLETENESS 0 $0 0 $0 0 $0
Aggregated Statistics For Year 2004(Based on 4 full and 3 partial tracts) A) Conventional B) Refinancings C) Non-occupant Loans on Number Average Value Number Average Value Number Average Value
LOANS ORIGINATED 40 $219,324 15 $190,068 3 $148,667 APPLICATIONS APPROVED, NOT ACCEPTED 5 $270,126 4 $188,490 0 $0 APPLICATIONS DENIED 0 $0 0 $0 0 $0 APPLICATIONS WITHDRAWN 2 $183,330 3 $161,787 0 $0 FILES CLOSED FOR INCOMPLETENESS 1 $200,000 0 $0 0 $0
Aggregated Statistics For Year 2003(Based on 4 full and 3 partial tracts) A) Conventional B) Refinancings C) Non-occupant Loans on Number Average Value Number Average Value Number Average Value
LOANS ORIGINATED 58 $186,487 55 $168,094 2 $185,230 APPLICATIONS APPROVED, NOT ACCEPTED 10 $153,861 13 $165,709 1 $53,140 APPLICATIONS DENIED 0 $0 0 $0 0 $0 APPLICATIONS WITHDRAWN 1 $186,010 0 $0 0 $0 FILES CLOSED FOR INCOMPLETENESS 0 $0 0 $0 0 $0
Aggregated Statistics For Year 2002(Based on 4 full and 2 partial tracts) A) Conventional B) Refinancings C) Non-occupant Loans on Number Average Value Number Average Value Number Average Value
LOANS ORIGINATED 81 $163,243 34 $155,587 2 $106,500 APPLICATIONS APPROVED, NOT ACCEPTED 16 $151,656 12 $165,167 1 $43,000 APPLICATIONS DENIED 1 $209,610 1 $149,060 0 $0 APPLICATIONS WITHDRAWN 6 $139,070 4 $108,775 0 $0 FILES CLOSED FOR INCOMPLETENESS 0 $0 1 $176,070 0 $0
Aggregated Statistics For Year 2001(Based on 4 full and 2 partial tracts) A) Conventional B) Refinancings C) Non-occupant Loans on Number Average Value Number Average Value Number Average Value
LOANS ORIGINATED 99 $160,720 42 $153,330 3 $76,843 APPLICATIONS APPROVED, NOT ACCEPTED 12 $169,498 1 $98,000 0 $0 APPLICATIONS DENIED 1 $150,320 0 $0 0 $0 APPLICATIONS WITHDRAWN 1 $164,590 0 $0 0 $0 FILES CLOSED FOR INCOMPLETENESS 1 $162,690 0 $0 0 $0
Aggregated Statistics For Year 2000(Based on 4 full and 2 partial tracts) A) Conventional B) Refinancings C) Non-occupant Loans on Number Average Value Number Average Value Number Average Value
LOANS ORIGINATED 64 $148,946 7 $141,964 2 $81,565 APPLICATIONS APPROVED, NOT ACCEPTED 8 $154,174 5 $112,082 0 $0 APPLICATIONS DENIED 1 $155,580 0 $0 0 $0 APPLICATIONS WITHDRAWN 0 $0 0 $0 0 $0 FILES CLOSED FOR INCOMPLETENESS 0 $0 1 $124,000 0 $0
Aggregated Statistics For Year 1999(Based on 5 full and 2 partial tracts) A) Conventional B) Refinancings Number Average Value Number Average Value
LOANS ORIGINATED 85 $143,884 26 $131,713 APPLICATIONS APPROVED, NOT ACCEPTED 11 $148,706 9 $143,408 APPLICATIONS DENIED 3 $174,583 0 $0 APPLICATIONS WITHDRAWN 1 $154,000 1 $137,780 FILES CLOSED FOR INCOMPLETENESS 1 $100,600 0 $0
Detailed PMIC statistics for the following Tracts:
2058.01
, 2058.05 , 2058.06 , 2058.07 , 2058.08 , 2058.09 , 2059.05 Fire-safe hotels and motels in King of Prussia, Pennsylvania:
Radisson Valley Forge, 1160 First Ave, King Of Prussia, Pennsylvania 19406 Phone: (610) 337-2000, Fax: (610) 768-0183
Home2 Suites, King of Prussia/Valley Forge, 550 W DeKalb Pike, King of Prussia, Pennsylvania 19406 Phone: (610) 962-0700, Fax: (610) 962-0218
Best Western The Inn At King Of Prussia, 127 S Gulph Rd, King Of Prussia, Pennsylvania 19406 Phone: (215) 265-4500, Fax: (610) 337-0672
Sheraton Valley Forge, 480 N Gulph Rd, King Of Prussia, Pennsylvania 19406 Phone: (484) 238-1800, Fax: (484) 238-1801
DoubleTree by Hilton Philadelphia Valley Forge, 301 W Dekalb Pike, King of Prussia, Pennsylvania 19406 Phone: (610) 337-1200, Fax: (610) 337-3138
Holiday Inn Express Hotel & Suites King of Prussia, 260 N Gulph Rd, King of Prussia, Pennsylvania 19406 Phone: (610) 768-9500, Fax: (610) 768-7158
Extended Stay America - Philadelphia - King Of Prussia, 400 American Ave, King Of Prussia, Pennsylvania 19406 Phone: (610) 962-9000, Fax: (610) 962-9591
Hampton Inn King Of Prussia, 530 W Dekalb Pike, King Of Prussia, Pennsylvania 19406 Phone: (610) 962-8111, Fax: (610) 962-5494
4 other hotels and motels
All 12 fire-safe hotels and motels in King of Prussia, Pennsylvania
Most common first names in King of Prussia, PA among deceased individuals Name Count Lived (average)
Mary 173 79.4 years John 157 73.7 years William 132 73.3 years Joseph 125 72.0 years Robert 94 71.7 years Helen 84 79.9 years Margaret 82 80.8 years James 80 69.0 years George 79 74.4 years Anna 74 83.1 years
Most common last names in King of Prussia, PA among deceased individuals Last name Count Lived (average)
Smith 31 76.2 years Miller 23 71.6 years Jones 17 72.9 years Davis 16 76.2 years Collins 15 69.0 years Campbell 13 80.0 years Robinson 13 71.0 years Brown 13 73.5 years Young 11 78.2 years Anderson 10 80.0 years
King of Prussia compared to Pennsylvania state average:
Median house value above state average. Unemployed percentage significantly below state average. Hispanic race population percentage below state average. Foreign-born population percentage significantly above state average. Length of stay since moving in significantly above state average. Number of rooms per house below state average. House age below state average. Percentage of population with a bachelor's degree or higher significantly above state average. King of Prussia on our top lists :
#42 on the list of "Top 101 cities with the most recent year of entry for the foreign-born population (2,000+ people)+"
#47 on the list of "Top 101 cities that people commute into (largest positive percentage daily daytime population change due to commuting) (population 5,000+)"
#47 on the list of "Top 101 cities with the most residents born in India (population 500+)"
#57 on the list of "Top 101 cities with the most residents born in South Central Asia (population 500+)"
#63 on the list of "Top 101 cities with largest percentage of males in occupations: computer and mathematical occupations (population 5,000+)"
#101 on the list of "Top 101 cities with the most residents born in Northern Africa (population 500+)"
#85 (19406) on the list of "Top 101 zip codes with the most medium-big companies in 2005 (at least 100 employees)"
#13 on the list of "Top 101 counties with the most Mainline Protestant adherents"
#15 on the list of "Top 101 counties with the most Mainline Protestant congregations"
#28 on the list of "Top 101 counties with the lowest average weight of females"
#30 on the list of "Top 101 counties with the largest number of people without health insurance coverage in 2000 (pop. 50,000+)"
#37 on the list of "Top 101 counties with the most Catholic adherents"

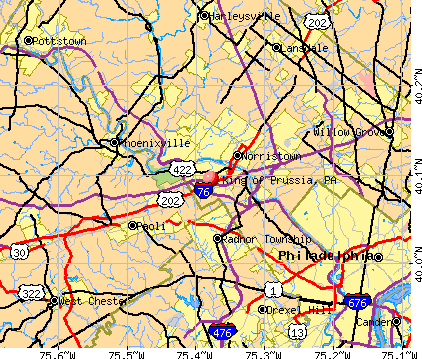


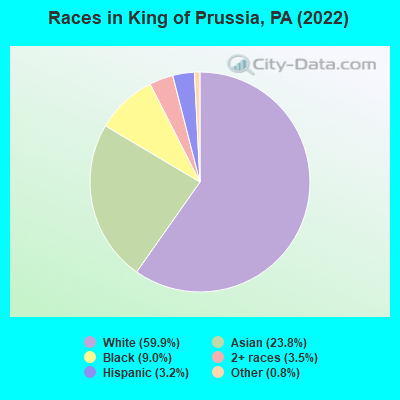
 Recent articles from our blog. Our writers, many of them Ph.D. graduates or candidates, create easy-to-read articles on a wide variety of topics.

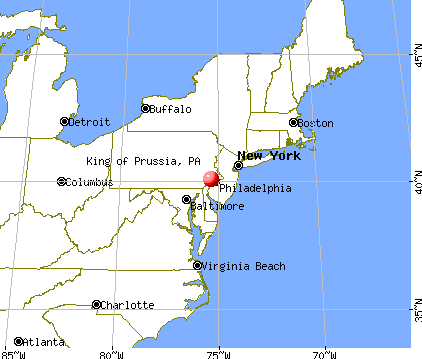
 (14.0 miles
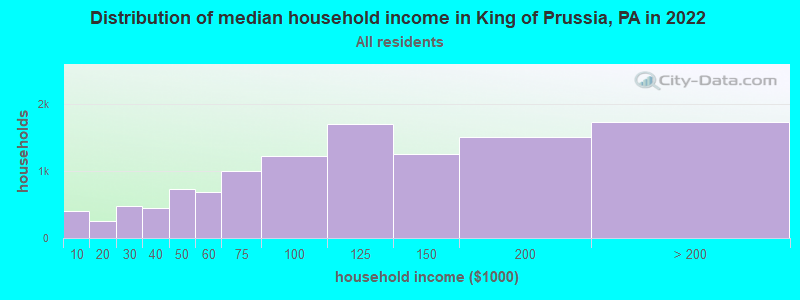
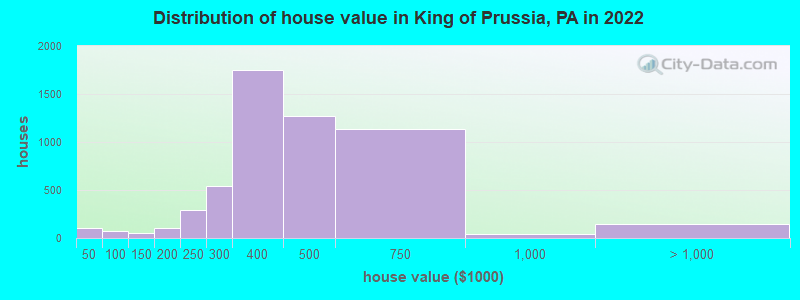
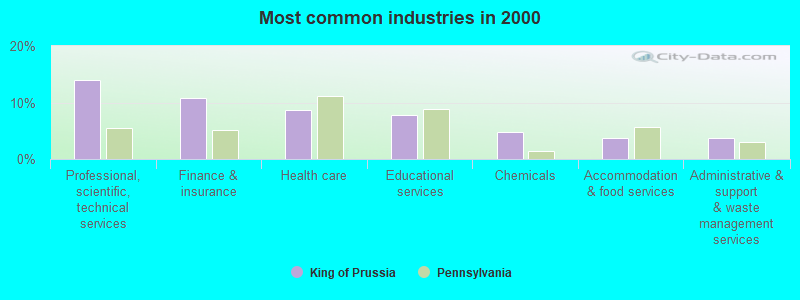
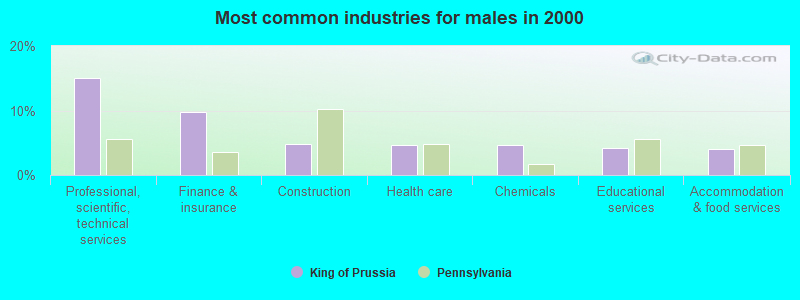
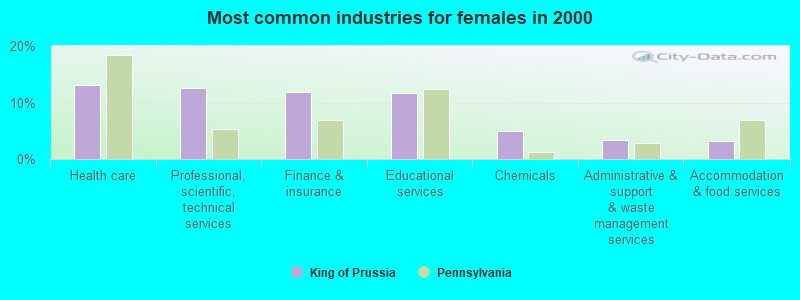
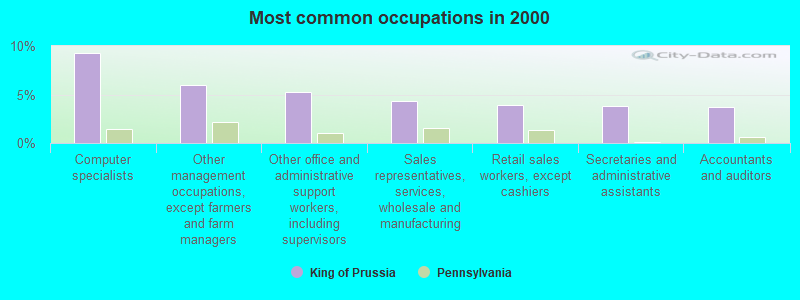
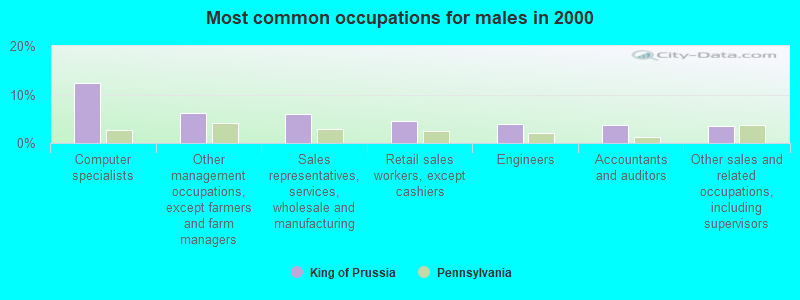
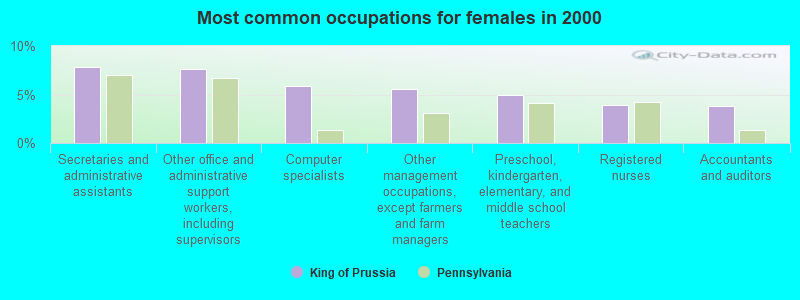
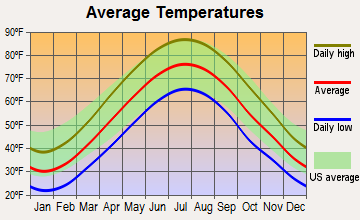
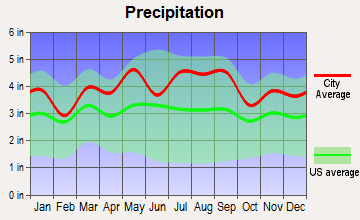
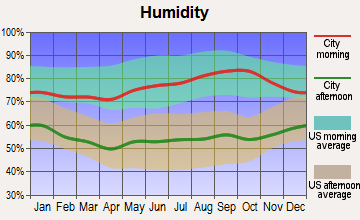
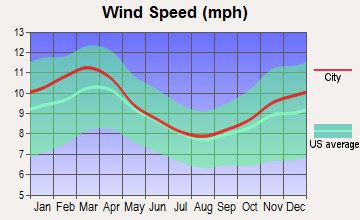
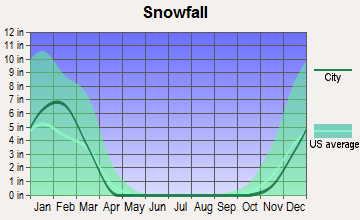
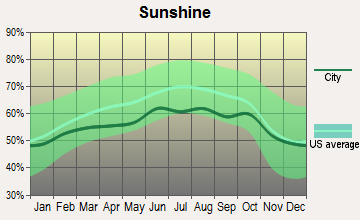
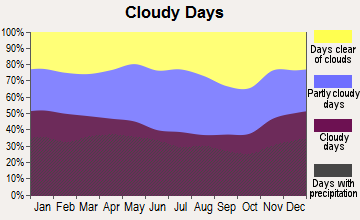
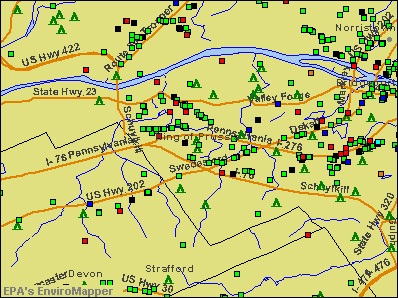

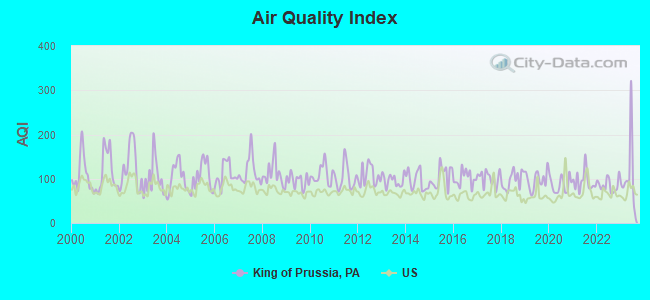
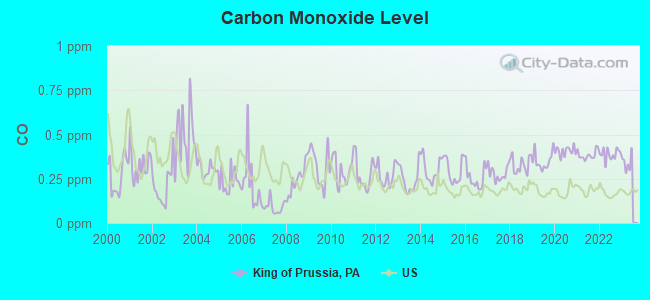
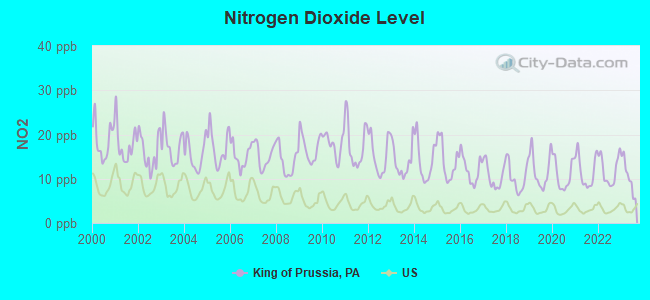
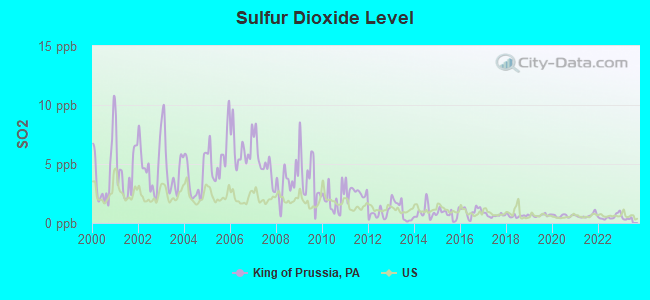
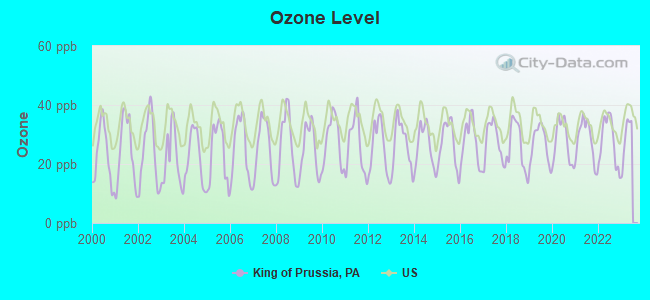
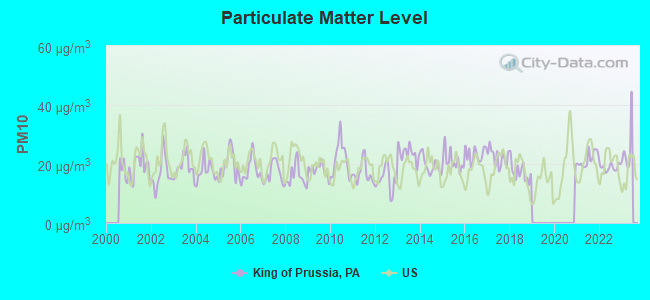
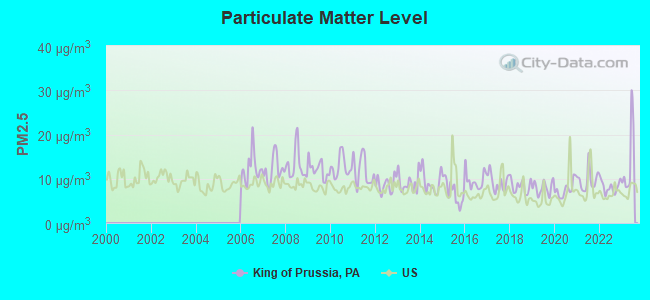
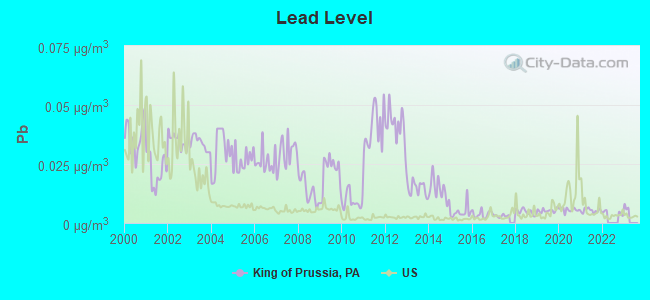
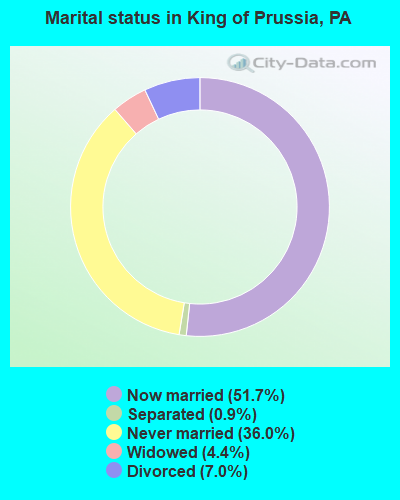
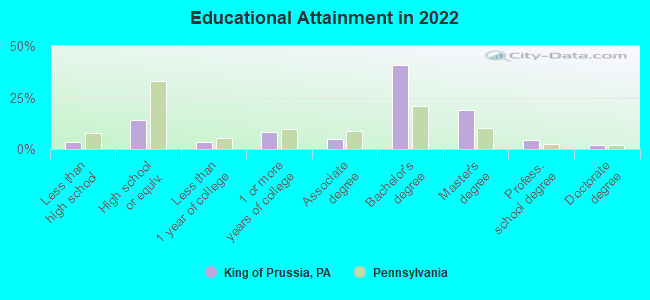
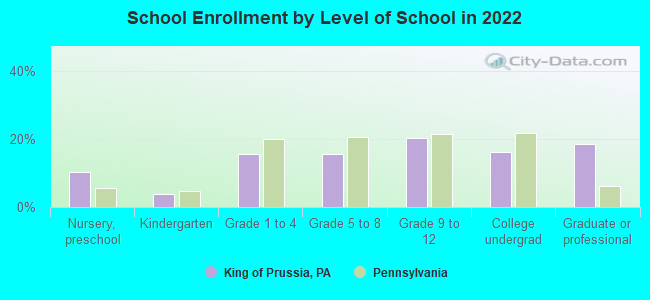
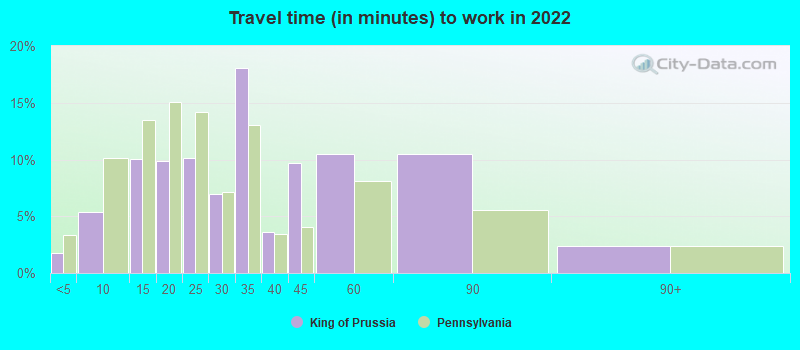
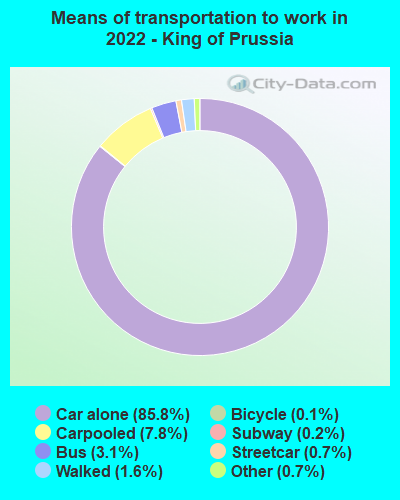
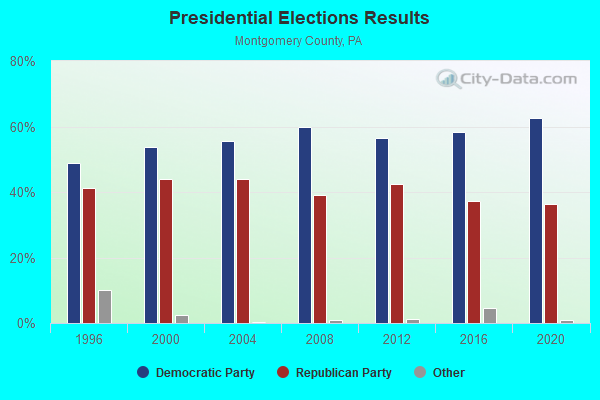
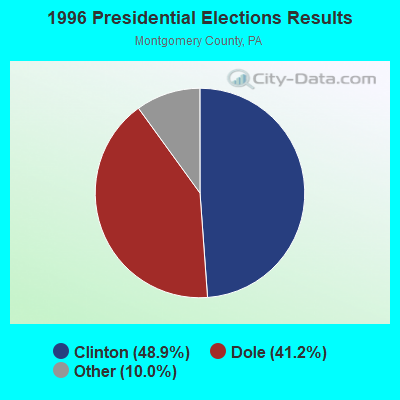
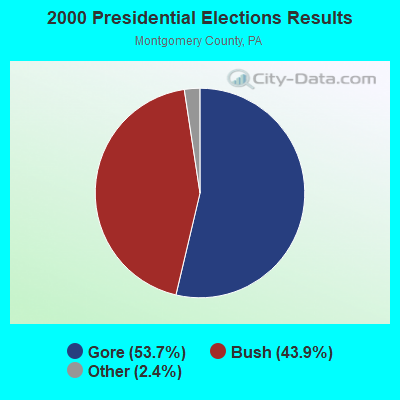
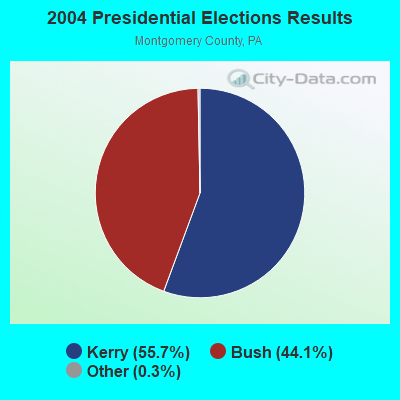
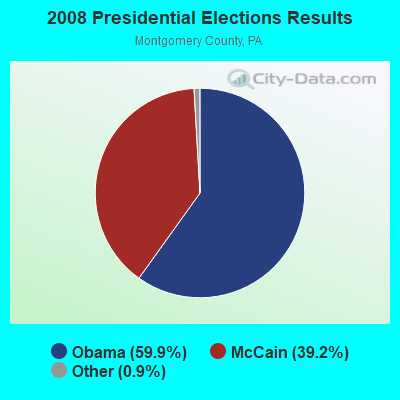
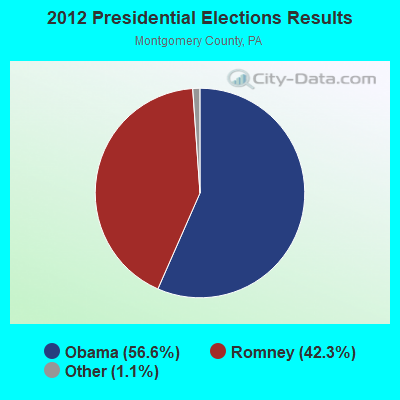
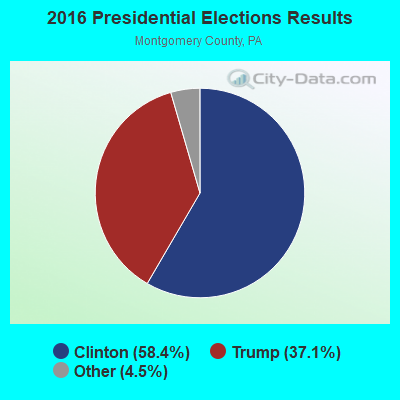
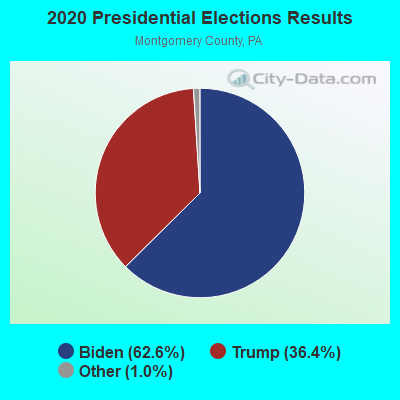
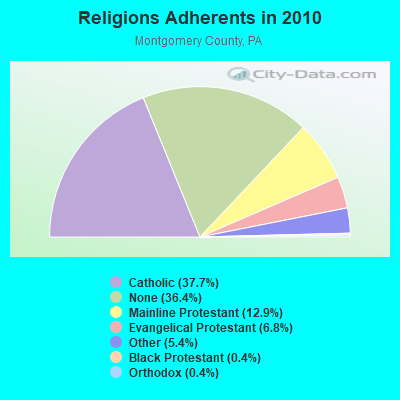
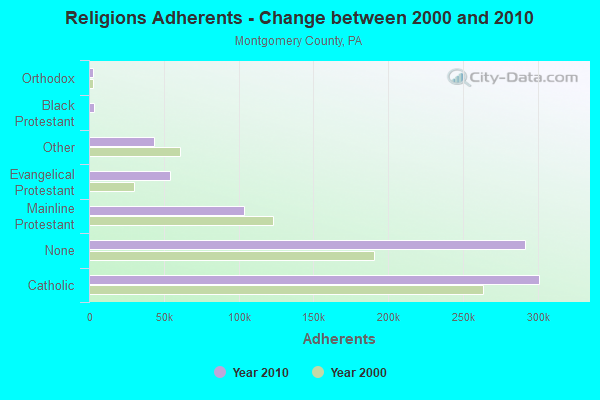
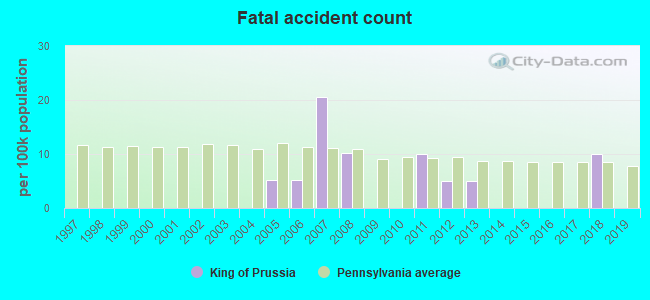
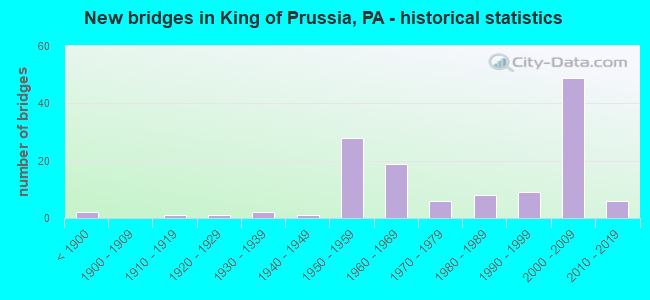

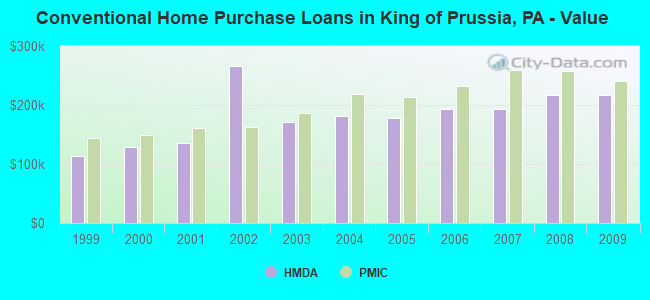
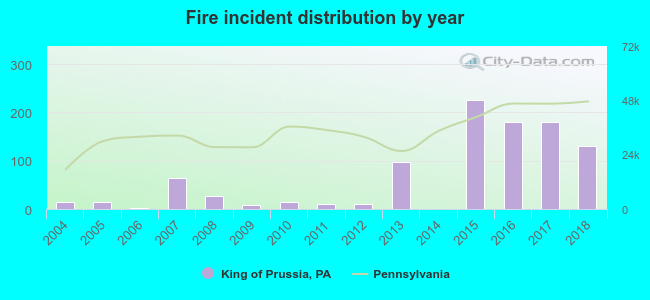 According to the data from the years 2004 - 2018 the average number of fires per year is 66. The highest number of fire incidents - 225 took place in 2015, and the least - 0 in 2014. The data has a growing trend.
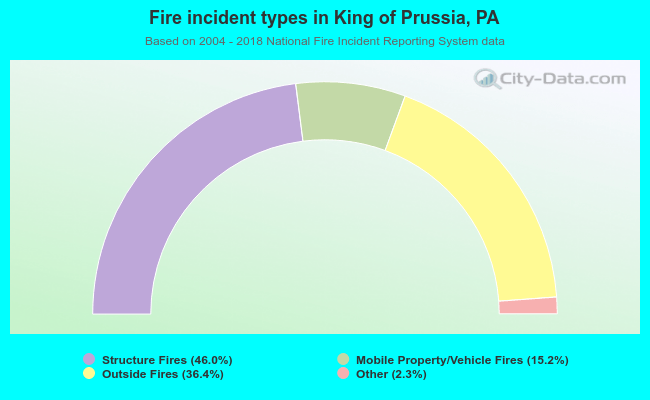 When looking into fire subcategories, the most incidents belonged to: Structure Fires (46.0%), and Outside Fires (36.4%).