Tanglewood (El Monte) neighborhood in San Jose, California (CA), 95127, 95148 detailed profile
Settings
X

Business Search - 14 Million verified businesses
Area: 0.124 square miles
Population: 1,542
Population density:
| Tanglewood (El Monte): | 12,463 people per square mile |
| San Jose: | 5,554 people per square mile |

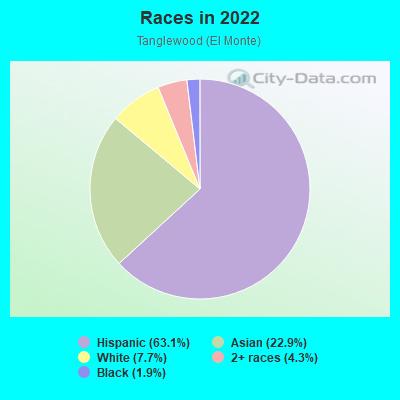
- 97963.1%Hispanic or Latino
- 35622.9%Asian
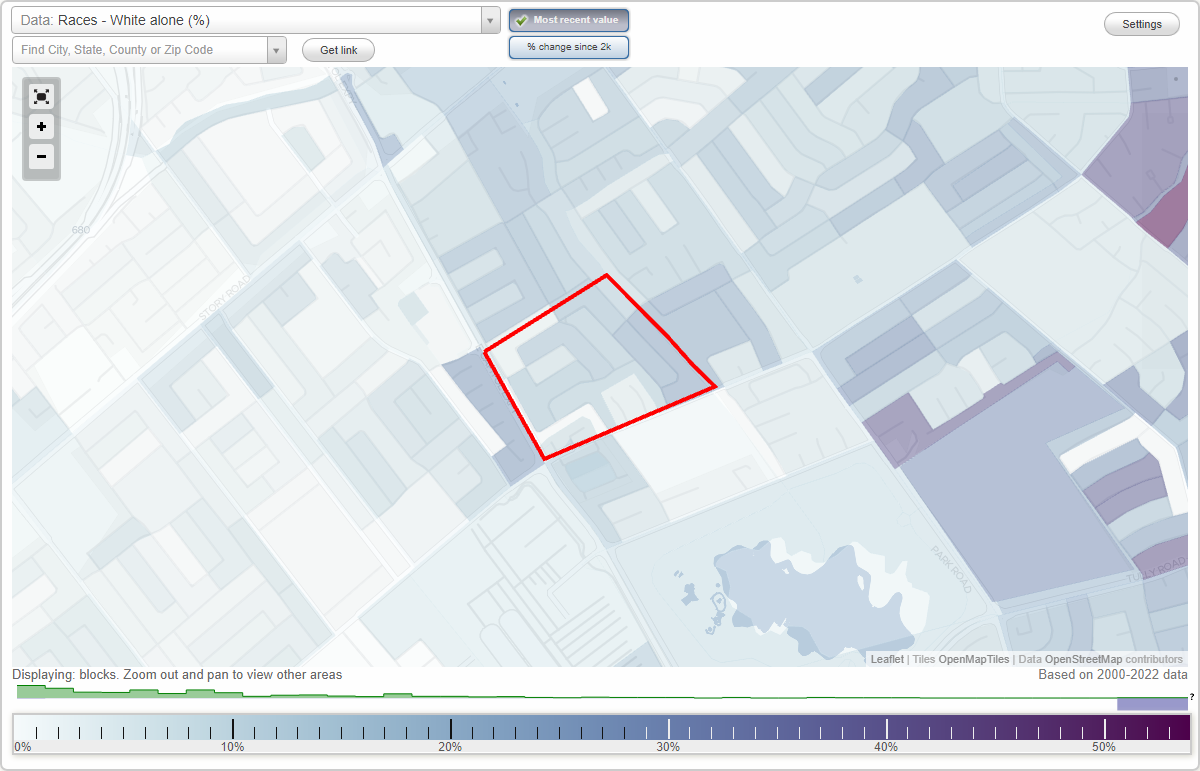
- 1207.7%White
- 674.3%Two or more races
- 301.9%Black
Median household income in 2022:
| Tanglewood (El Monte): | $127,648 |
| San Jose: | $133,835 |
Distribution of median household income
![Distribution of median household income]()
- 13Less than $10,000
- 50$10,000 to $19,999
- 13$20,000 to $29,999
- 30$30,000 to $39,999
- 30$40,000 to $49,999
- 20$50,000 to $59,999
- 50$60,000 to $74,999
- 39$75,000 to $99,999
- 47$100,000 to $124,999
- 22$125,000 to $149,999
- 50$150,000 to $199,999
- 85$200,000 or more

Distribution of owner-occupied house/condo value
![Distribution of owner-occupied house/condo value]()
- 15Less than $50,000
- 20$50,000 to $99,999
- 4$100,000 to $149,999
- 14$200,000 to $249,999
- 49$300,000 to $399,999
- 12$400,000 to $499,999
- 63$500,000 to $749,999
- 110$750,000 to $999,999
- 79$1,000,000 or more

Distribution of rent paid by renters
![Distribution of rent paid by renters]()
- 12$800 to $899
- 18$1,000 to $1,249
- 30$1,250 to $1,499
- 7$1,500 to $1,999
- 100$2,000 or more

Median rent in 2022:
| Tanglewood (El Monte): | $2,881 |
| San Jose: | $2,001 |
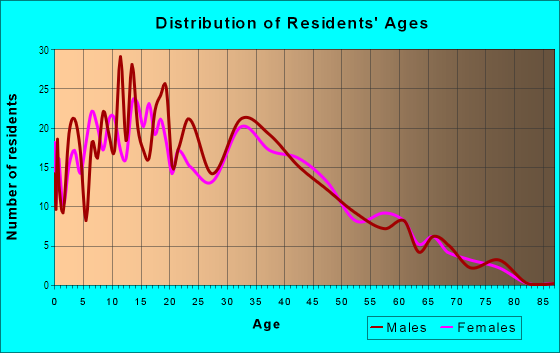
| Males: | 874 |
| Females: | 668 |
Males:
| This neighborhood: | 38.1 years |
| Whole city: | 37.6 years |
| This neighborhood: | 39.5 years |
| Whole city: | 39.1 years |
Average household size:
| Tanglewood (El Monte): | 4.2 people |
| San Jose: | 2.9 people |
Percentage of family households:
| Tanglewood (El Monte): | 59.6% |
| San Jose: | 49.9% |
| Here: | 63.8% |
| San Jose: | 53.0% |
Percentage of married-couple families with children (among all households):
| Tanglewood (El Monte): | 20.2% |
| San Jose: | 25.8% |
Percentage of single-mother households (among all households):
| Tanglewood (El Monte): | 6.2% |
| San Jose: | 5.2% |
Percentage of never married males 15 years old and over:
Percentage of never married females 15 years old and over:
| Tanglewood (El Monte): | 27.0% |
| San Jose: | 20.9% |
Percentage of never married females 15 years old and over:
| Tanglewood (El Monte): | 16.6% |
| city: | 16.7% |
Percentage of people that speak English not well or not at all:
| Tanglewood (El Monte): | 7.5% |
| San Jose: | 11.4% |
Percentage of people born in this state:
Percentage of people born in another U.S. state:
Percentage of native residents but born outside the U.S.:
Percentage of foreign born residents:
| Here: | 47.2% |
| San Jose: | 46.1% |
Percentage of people born in another U.S. state:
| Tanglewood (El Monte): | 4.9% |
| San Jose: | 10.4% |
Percentage of native residents but born outside the U.S.:
| Here: | 3.5% |
| city: | 1.7% |
Percentage of foreign born residents:
| Here: | 44.3% |
| San Jose: | 41.8% |
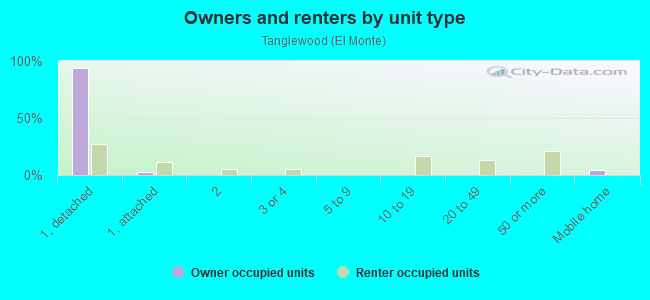
Owner-occupied
Renter-occupied

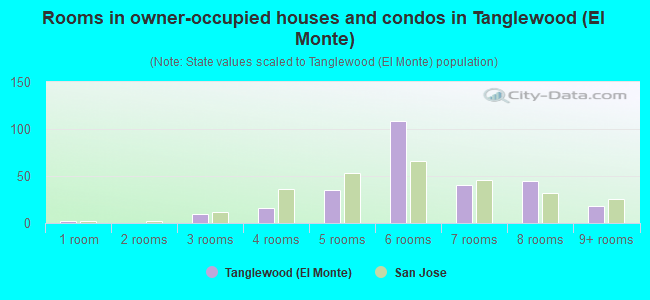
- Rooms in owner-occupied houses and condos in Tanglewood <
> - 21 room
- 02 rooms
- 103 rooms
- 164 rooms
- 355 rooms
- 1096 rooms
- 407 rooms
- 458 rooms
- 189+ rooms
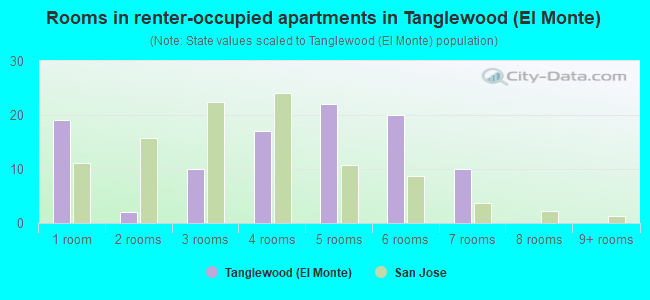
- Rooms in renter-occupied apartments in Tanglewood <
> - 191 room
- 22 rooms
- 103 rooms
- 174 rooms
- 225 rooms
- 206 rooms
- 107 rooms
- 08 rooms
- 09+ rooms
Owner-occupied
Renter-occupied
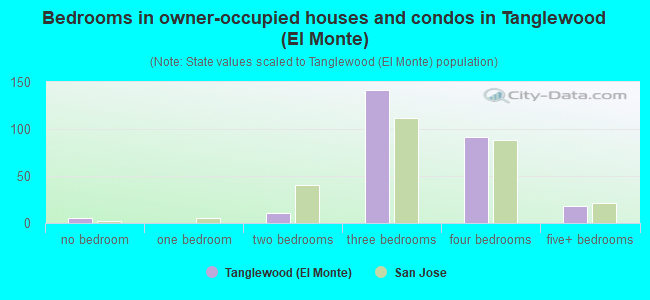
- Bedrooms in owner-occupied houses and condos in Tanglewood <
> - 5no bedroom
- 01 bedroom
- 112 bedrooms
- 1423 bedrooms
- 924 bedrooms
- 185+ bedrooms
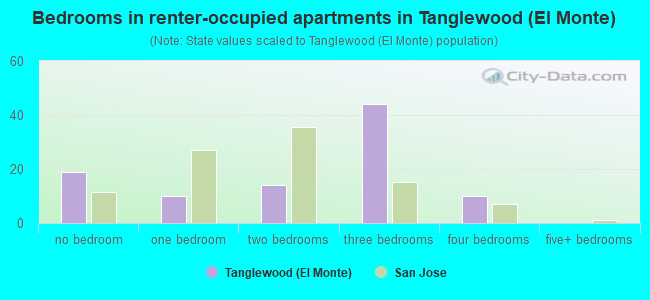
- Bedrooms in renter-occupied apartments in Tanglewood <
> - 19no bedroom
- 101 bedroom
- 142 bedrooms
- 443 bedrooms
- 104 bedrooms
- 05+ bedrooms
Average number of cars or other vehicles available in houses/condos:
Average number of cars or other vehicles available in apartments:
| This neighborhood: | 3.2 |
| San Jose: | 2.3 |
Average number of cars or other vehicles available in apartments:
| Here: | 2.6 |
| city: | 1.6 |
Percentage of units with a mortgage:
| Tanglewood (El Monte): | 67.1% |
| San Jose: | 66.9% |
Average estimated value of detached houses in 2022 (90.2% of all units):
| Tanglewood (El Monte): | $802,420 |
| San Jose: | $1,532,815 |
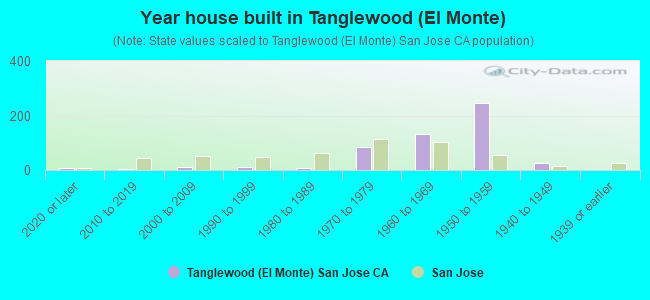
- Year house built in Tanglewood <
> - 92020 or later
- 22010 to 2019
- 102000 to 2009
- 101990 to 1999
- 81980 to 1989
- 861970 to 1979
- 1331960 to 1969
- 2461950 to 1959
- 251940 to 1949
- 01939 or earlier
City-data.com crime index for city in 2020 (higher means more crime):
| City: | 268.4 |
| U.S. average: | 219.5 |
Travel time to work (commute)
![Travel time to work (commute)]()
- 3Less than 5 minutes
- 255 to 9 minutes
- 7910 to 14 minutes
- 12115 to 19 minutes
- 10120 to 24 minutes
- 4825 to 29 minutes
- 10330 to 34 minutes
- 2735 to 39 minutes
- 1640 to 44 minutes
- 6745 to 59 minutes
- 5460 to 89 minutes
- 1990 or more minutes

Means of transportation to work
![Means of transportation to work]()
- 78.2%606Drove a car alone
- 9.4%73Carpooled
- 0.6%5Bus
- 0.5%4Long-distance train or commuter rail
- 3.0%23Light rail, streetcar or trolley
- 1.3%10Bicycle
- 2.7%21Walked
- 0.6%5Other means
- 8.4%65Worked at home

Time leaving home to go to work
![Time leaving home to go to work]()
- 2412:00 a.m. to 4:59 a.m.
- 295:00 a.m. to 5:29 a.m.
- 485:30 a.m. to 5:59 a.m.
- 446:00 a.m. to 6:29 a.m.
- 456:30 a.m. to 6:59 a.m.
- 1057:00 a.m. to 7:29 a.m.
- 667:30 a.m. to 7:59 a.m.
- 638:00 a.m. to 8:29 a.m.
- 388:30 a.m. to 8:59 a.m.
- 439:00 a.m. to 9:59 a.m.
- 2610:00 a.m. to 10:59 a.m.
- 811:00 a.m. to 11:59 a.m.
- 4712:00 p.m. to 3:59 p.m.
- 604:00 p.m. to 11:59 p.m.

Occupations of males:
- Percentage of males in management occupations (except farmers):
Here: 4.6% city: 13.0%
- Percentage of males in business and financial operations occupations:
Here: 5.7% city: 4.6%
- Percentage of males in architecture and engineering occupations:
Here: 4.7% city: 10.2%
- Percentage of males in community and social services occupations:
Here: 2.4% city: 0.8%
- Percentage of males in education, training, and library occupations:
Here: 5.4% city: 2.8%
- Percentage of males in healthcare practitioners and technical occupations:
Here: 1.2% city: 2.0%
- Percentage of males in service occupations:
Here: 18.2% city: 12.7%
- Percentage of males in sales and office occupations:
Here: 11.9% city: 12.8%
- Percentage of males in farming, fishing, and forestry occupations:
Here: 5.8% city: 0.4%
- Percentage of males in construction, extraction, and maintenance occupations:
Here: 12.5% city: 7.8%
- Percentage of males in production occupations:
Here: 10.9% city: 5.5%
- Percentage of males in transportation occupations:
Here: 6.1% city: 3.6%
- Percentage of males in material moving occupations:
Here: 5.6% city: 3.1%
Occupations of females:
- Percentage of females in management occupations (except farmers):
Here: 9.2% city: 11.0%
- Percentage of females in architecture and engineering occupations:
Here: 3.5% city: 2.8%
- Percentage of females in community and social services occupations:
Here: 2.3% city: 1.8%
- Percentage of females in education, training, and library occupations:
Here: 10.6% city: 8.1%
- Percentage of females in arts, design, entertainment, sports, and media occupations:
Here: 1.4% city: 2.0%
- Percentage of females in healthcare practitioners and technical occupations:
Here: 7.4% city: 6.8%
- Percentage of females in service occupations:
Here: 24.5% city: 21.7%
- Percentage of females in sales and office occupations:
Here: 26.1% city: 22.0%
- Percentage of females in farming, fishing, and forestry occupations:
Here: 3.4% city: 0.2%
- Percentage of females in construction, extraction, and maintenance occupations:
Here: 1.5% city: 0.2%
- Percentage of females in production occupations:
Here: 7.9% city: 4.0%
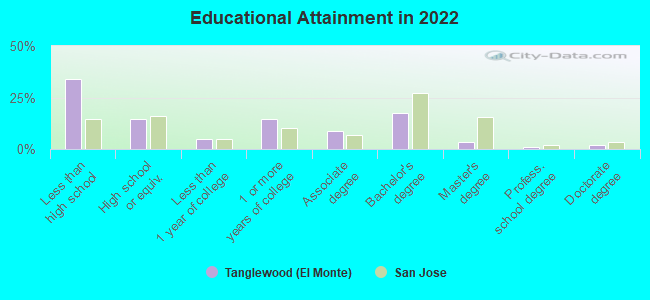
Education in this neighborhood (subdivision or community):
- Percentage of people 3 years and older in K-12 schools:
Tanglewood (El Monte): 15.9% San Jose: 16.1%
- Percentage of people 3 years and older in undergraduate colleges:
Tanglewood (El Monte): 7.5% San Jose: 6.5%
- Percentage of people 3 years and older in grad. or professional schools:
Tanglewood (El Monte): 1.5% San Jose: 2.0%
- Percentage of students K-12 enrolled in private schools:
Tanglewood (El Monte): 9.2% San Jose: 14.9%
Percentage of population below poverty level:
| Tanglewood (El Monte): | 9.1% |
| San Jose: | 9.0% |
Median year owner moved in (as recorded in 2022):
Median year renter moved in (as recorded in 2022):
| Tanglewood (El Monte): | 2001 |
| San Jose: | 2008 |
Median year renter moved in (as recorded in 2022):
| Tanglewood (El Monte): | 2015 |
| San Jose: | 2020 |
Percentage of married-couple families with both working:
| Tanglewood (El Monte): | 56.2% |
| San Jose: | 72.5% |
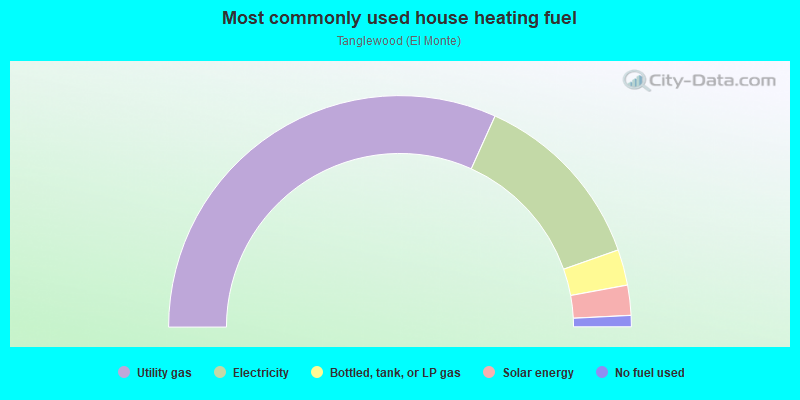
- 63.5%Utility gas
- 25.7%Electricity
- 5.0%Bottled, tank, or LP gas
- 4.2%Solar energy
- 1.6%No fuel used
Roads and streets:
el Monte Way
Length: 0.33 miles
Directions: E-W, N-S, SE-NW, SW-NE
Address range: 2700 to 2899
Directions: E-W, N-S, SE-NW, SW-NE
Address range: 2700 to 2899
Hillmont Ave
Length: 0.30 miles
Directions: E-W, SE-NW
Address range: 1500 to 1799
Directions: E-W, SE-NW
Address range: 1500 to 1799
Sundown Ln
Length: 0.27 miles
Directions: E-W, N-S, SE-NW, SW-NE
Address range: 1650 to 1799
Directions: E-W, N-S, SE-NW, SW-NE
Address range: 1650 to 1799
Tanglewood Dr
Length: 0.22 miles
Directions: E-W, N-S, SW-NE
Address range: 2700 to 2899
Directions: E-W, N-S, SW-NE
Address range: 2700 to 2899
S Capitol Ave
Length: 0.22 miles
Directions: E-W, N-S, SE-NW, SW-NE
Address range: 1600 to 1743
Directions: E-W, N-S, SE-NW, SW-NE
Address range: 1600 to 1743
(Mc Ginness Ave)
Length: 0.20 miles
Directions: E-W, SE-NW
Address range: 1571 to 1699
Directions: E-W, SE-NW
Address range: 1571 to 1699
Woodmoor Dr
Length: 0.18 miles
Directions: E-W, SW-NE
Address range: 2700 to 2799
Directions: E-W, SW-NE
Address range: 2700 to 2799
Ocala Ave
Length: 0.15 miles
Directions: E-W, N-S, SE-NW, SW-NE
Directions: E-W, N-S, SE-NW, SW-NE
Twin Oaks Ln
Length: 0.13 miles
Directions: E-W, SW-NE
Address range: 2700 to 2799
Directions: E-W, SW-NE
Address range: 2700 to 2799
Montevideo Ln
Length: 0.13 miles
Directions: E-W, N-S, SE-NW
Address range: 1600 to 1699
Directions: E-W, N-S, SE-NW
Address range: 1600 to 1699
Cragwood Ln
Length: 0.10 miles
Directions: E-W, N-S, SE-NW
Address range: 1500 to 1699
Directions: E-W, N-S, SE-NW
Address range: 1500 to 1699
Moss Point Dr
Length: 0.10 miles
Direction: SW-NE
Address range: 2800 to 2875
Direction: SW-NE
Address range: 2800 to 2875
Everwood Ct
Length: 0.07 miles
Directions: E-W, SE-NW, SW-NE
Address range: 1900 to 1999
Directions: E-W, SE-NW, SW-NE
Address range: 1900 to 1999
Evermont Ct
Length: 0.03 miles
Direction: SE-NW
Address range: 1900 to 1999
Direction: SE-NW
Address range: 1900 to 1999