The Almond Grove (The Almond Grove Historic District) neighborhood in Los Gatos, California (CA), 95030 detailed profile
Settings
X

Business Search - 14 Million verified businesses
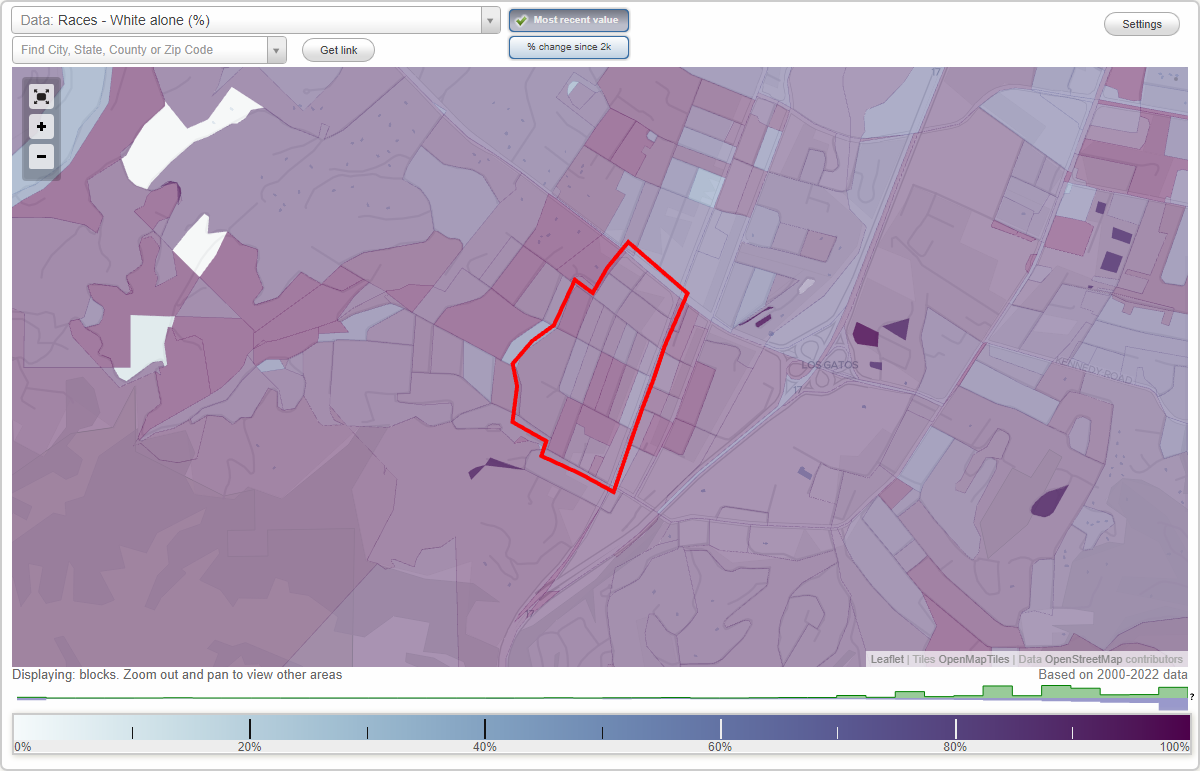
Area: 0.135 square miles
Population: 1,270
Population density:
| The Almond Grove (The Almond Grove Historic District): | 9,427 people per square mile |
| Los Gatos: | 3,089 people per square mile |

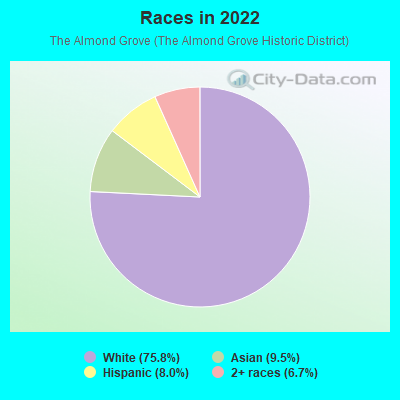
- 96275.8%White
- 1209.5%Asian
- 1028.0%Hispanic or Latino
- 856.7%Two or more races
Median household income in 2022:
| The Almond Grove (The Almond Grove Historic District): | $159,511 |
| Los Gatos: | $198,117 |
Distribution of median household income
![Distribution of median household income]()
- 37Less than $10,000
- 6$10,000 to $19,999
- 14$20,000 to $29,999
- 21$30,000 to $39,999
- 30$40,000 to $49,999
- 16$50,000 to $59,999
- 13$60,000 to $74,999
- 67$75,000 to $99,999
- 46$100,000 to $124,999
- 37$125,000 to $149,999
- 108$150,000 to $199,999
- 204$200,000 or more

Distribution of owner-occupied house/condo value
![Distribution of owner-occupied house/condo value]()
- 8$150,000 to $199,999
- 11$200,000 to $249,999
- 2$250,000 to $299,999
- 16$750,000 to $999,999
- 111$1,000,000 or more

Distribution of rent paid by renters
![Distribution of rent paid by renters]()
- 14$1,000 to $1,249
- 7$1,250 to $1,499
- 84$1,500 to $1,999
- 338$2,000 or more

Median rent in 2022:
| The Almond Grove (The Almond Grove Historic District): | $2,330 |
| Los Gatos: | $2,001 |
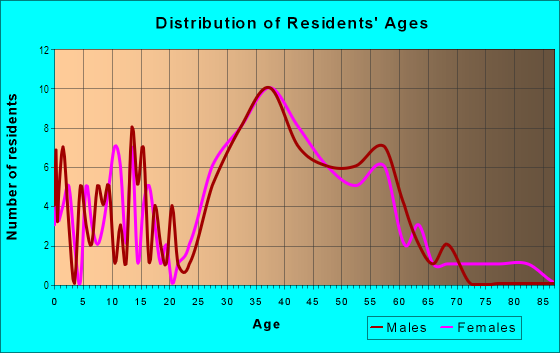
| Males: | 664 |
| Females: | 606 |
Males:
| This neighborhood: | 45.8 years |
| Whole city: | 44.4 years |
| This neighborhood: | 35.5 years |
| Whole city: | 46.7 years |
Average household size:
| The Almond Grove (The Almond Grove Historic District): | 2.2 people |
| Los Gatos: | 2.5 people |
Percentage of family households:
| The Almond Grove (The Almond Grove Historic District): | 40.7% |
| Los Gatos: | 50.1% |
| Here: | 49.2% |
| Los Gatos: | 61.1% |
Percentage of married-couple families with children (among all households):
| The Almond Grove (The Almond Grove Historic District): | 46.2% |
| Los Gatos: | 33.8% |
Percentage of single-mother households (among all households):
| The Almond Grove (The Almond Grove Historic District): | 0.8% |
| Los Gatos: | 2.7% |
Percentage of never married males 15 years old and over:
Percentage of never married females 15 years old and over:
| The Almond Grove (The Almond Grove Historic District): | 10.7% |
| Los Gatos: | 11.6% |
Percentage of never married females 15 years old and over:
| The Almond Grove (The Almond Grove Historic District): | 12.1% |
| town: | 11.0% |
Percentage of people that speak English not well or not at all:
| The Almond Grove (The Almond Grove Historic District): | 0.0% |
| Los Gatos: | 2.2% |
Percentage of people born in this state:
Percentage of people born in another U.S. state:
Percentage of native residents but born outside the U.S.:
Percentage of foreign born residents:
| Here: | 52.1% |
| Los Gatos: | 46.7% |
Percentage of people born in another U.S. state:
| The Almond Grove (The Almond Grove Historic District): | 24.9% |
| Los Gatos: | 26.4% |
Percentage of native residents but born outside the U.S.:
| Here: | 1.1% |
| town: | 1.8% |
Percentage of foreign born residents:
| Here: | 21.9% |
| Los Gatos: | 25.1% |
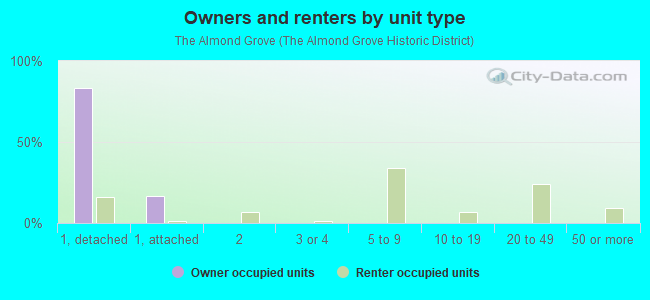
Owner-occupied
Renter-occupied

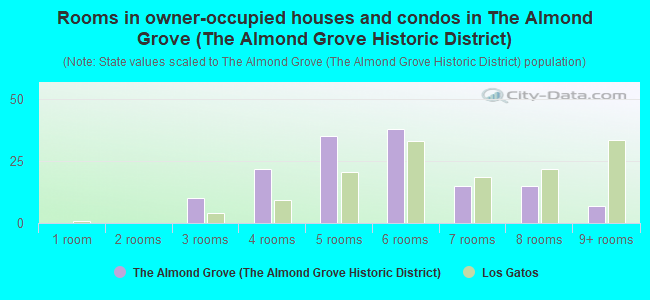
- Rooms in owner-occupied houses and condos in The Almond Grove <
> - 01 room
- 02 rooms
- 103 rooms
- 224 rooms
- 355 rooms
- 386 rooms
- 157 rooms
- 158 rooms
- 79+ rooms
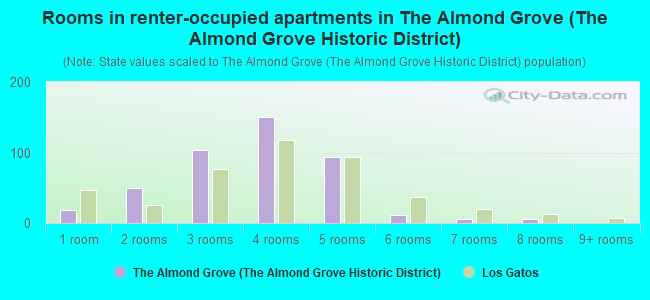
- Rooms in renter-occupied apartments in The Almond Grove <
> - 181 room
- 492 rooms
- 1043 rooms
- 1504 rooms
- 945 rooms
- 116 rooms
- 57 rooms
- 68 rooms
- 09+ rooms
Owner-occupied
Renter-occupied
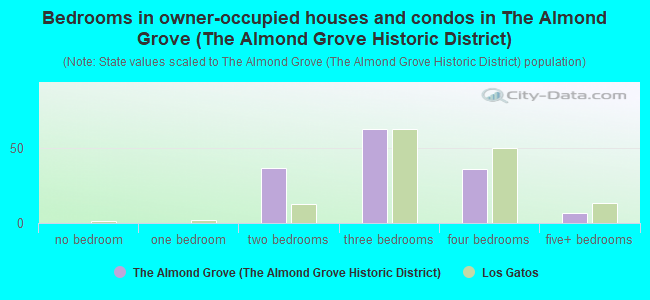
- Bedrooms in owner-occupied houses and condos in The Almond Grove <
> - 0no bedroom
- 01 bedroom
- 372 bedrooms
- 633 bedrooms
- 364 bedrooms
- 75+ bedrooms
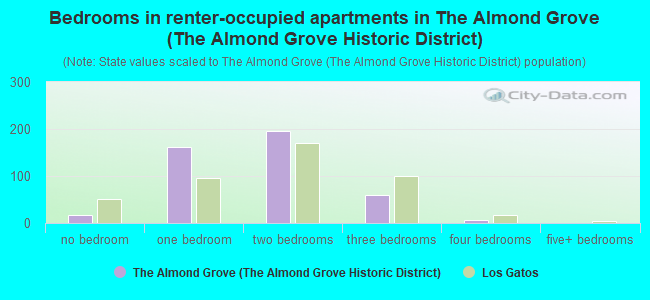
- Bedrooms in renter-occupied apartments in The Almond Grove <
> - 18no bedroom
- 1611 bedroom
- 1952 bedrooms
- 593 bedrooms
- 64 bedrooms
- 05+ bedrooms
Average number of cars or other vehicles available in houses/condos:
Average number of cars or other vehicles available in apartments:
| This neighborhood: | 1.5 |
| Los Gatos: | 2.2 |
Average number of cars or other vehicles available in apartments:
| Here: | 1.6 |
| town: | 1.6 |
Percentage of units with a mortgage:
| The Almond Grove (The Almond Grove Historic District): | 80.8% |
| Los Gatos: | 68.7% |
Housing prices:
- Average estimated value of detached houses in 2022 (31.6% of all units):
The Almond Grove (The Almond Grove Historic District): $1,751,740 Los Gatos: $2,794,988
- Average estimated value of townhouses or other attached units in 2022 (4.7% of all units):
This neighborhood: $369,291 town: $1,302,045
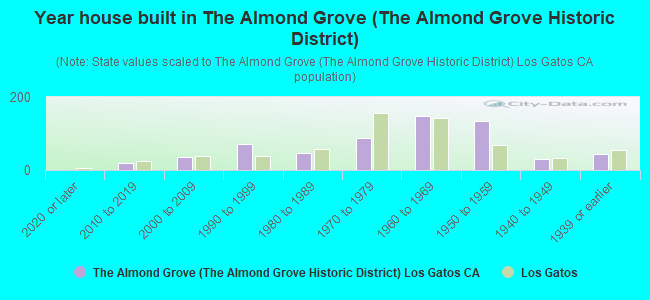
- Year house built in The Almond Grove <
> - 02020 or later
- 202010 to 2019
- 362000 to 2009
- 711990 to 1999
- 461980 to 1989
- 871970 to 1979
- 1491960 to 1969
- 1341950 to 1959
- 311940 to 1949
- 451939 or earlier
City-data.com crime index for town in 2020 (higher means more crime):
| City: | 91.9 |
| U.S. average: | 219.5 |
Travel time to work (commute)
![Travel time to work (commute)]()
- 10Less than 5 minutes
- 365 to 9 minutes
- 5510 to 14 minutes
- 4915 to 19 minutes
- 6920 to 24 minutes
- 6125 to 29 minutes
- 10730 to 34 minutes
- 435 to 39 minutes
- 3140 to 44 minutes
- 12345 to 59 minutes
- 3260 to 89 minutes
- 1090 or more minutes

Means of transportation to work
![Means of transportation to work]()
- 67.6%455Drove a car alone
- 11.6%78Carpooled
- 0.6%4Bus
- 2.5%17Walked
- 3.3%22Other means
- 14.6%98Worked at home

Time leaving home to go to work
![Time leaving home to go to work]()
- 1012:00 a.m. to 4:59 a.m.
- 25:30 a.m. to 5:59 a.m.
- 266:00 a.m. to 6:29 a.m.
- 476:30 a.m. to 6:59 a.m.
- 1387:00 a.m. to 7:29 a.m.
- 937:30 a.m. to 7:59 a.m.
- 1078:00 a.m. to 8:29 a.m.
- 778:30 a.m. to 8:59 a.m.
- 49:00 a.m. to 9:59 a.m.
- 4210:00 a.m. to 10:59 a.m.
- 1011:00 a.m. to 11:59 a.m.
- 612:00 p.m. to 3:59 p.m.
- 114:00 p.m. to 11:59 p.m.

Occupations of males:
- Percentage of males in management occupations (except farmers):
Here: 29.3% town: 27.5%
- Percentage of males in business and financial operations occupations:
Here: 5.9% town: 8.2%
- Percentage of males in computer and mathematical occupations:
Here: 7.6% town: 14.7%
- Percentage of males in architecture and engineering occupations:
Here: 10.7% town: 7.6%
- Percentage of males in legal occupations:
Here: 1.2% town: 1.8%
- Percentage of males in education, training, and library occupations:
Here: 3.4% town: 3.6%
- Percentage of males in healthcare practitioners and technical occupations:
Here: 2.2% town: 3.3%
- Percentage of males in service occupations:
Here: 6.6% town: 6.8%
- Percentage of males in sales and office occupations:
Here: 5.5% town: 13.7%
- Percentage of males in construction, extraction, and maintenance occupations:
Here: 9.2% town: 3.1%
- Percentage of males in production occupations:
Here: 4.3% town: 2.1%
- Percentage of males in material moving occupations:
Here: 3.2% town: 0.7%
Occupations of females:
- Percentage of females in management occupations (except farmers):
Here: 6.8% town: 19.4%
- Percentage of females in business and financial operations occupations:
Here: 6.4% town: 10.5%
- Percentage of females in computer and mathematical occupations:
Here: 1.9% town: 5.0%
- Percentage of females in architecture and engineering occupations:
Here: 2.6% town: 2.6%
- Percentage of females in life, physical, and social science occupations:
Here: 9.6% town: 1.5%
- Percentage of females in legal occupations:
Here: 5.5% town: 2.7%
- Percentage of females in education, training, and library occupations:
Here: 7.0% town: 8.8%
- Percentage of females in arts, design, entertainment, sports, and media occupations:
Here: 3.6% town: 2.3%
- Percentage of females in healthcare practitioners and technical occupations:
Here: 6.4% town: 9.8%
- Percentage of females in service occupations:
Here: 17.3% town: 9.9%
- Percentage of females in sales and office occupations:
Here: 32.8% town: 23.6%
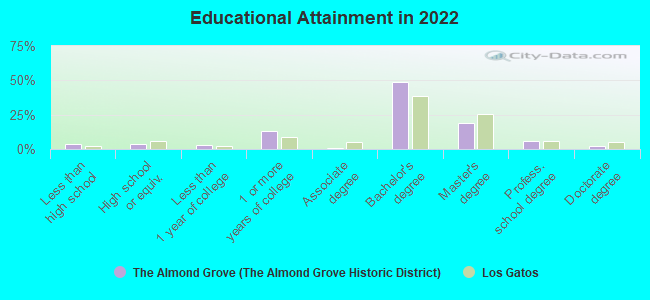
Education in this neighborhood (subdivision or community):
- Percentage of people 3 years and older in K-12 schools:
The Almond Grove (The Almond Grove Historic District): 11.4% Los Gatos: 18.4%
- Percentage of people 3 years and older in undergraduate colleges:
The Almond Grove (The Almond Grove Historic District): 3.8% Los Gatos: 4.8%
- Percentage of people 3 years and older in grad. or professional schools:
The Almond Grove (The Almond Grove Historic District): 0.5% Los Gatos: 1.0%
- Percentage of students K-12 enrolled in private schools:
The Almond Grove (The Almond Grove Historic District): 16.4% Los Gatos: 19.0%
Percentage of population below poverty level:
| The Almond Grove (The Almond Grove Historic District): | 3.9% |
| Los Gatos: | 3.9% |
Median year owner moved in (as recorded in 2022):
Median year renter moved in (as recorded in 2022):
| The Almond Grove (The Almond Grove Historic District): | 2007 |
| Los Gatos: | 2006 |
Median year renter moved in (as recorded in 2022):
| The Almond Grove (The Almond Grove Historic District): | 2016 |
| Los Gatos: | 2016 |
Percentage of married-couple families with both working:
| The Almond Grove (The Almond Grove Historic District): | 28.5% |
| Los Gatos: | 60.9% |
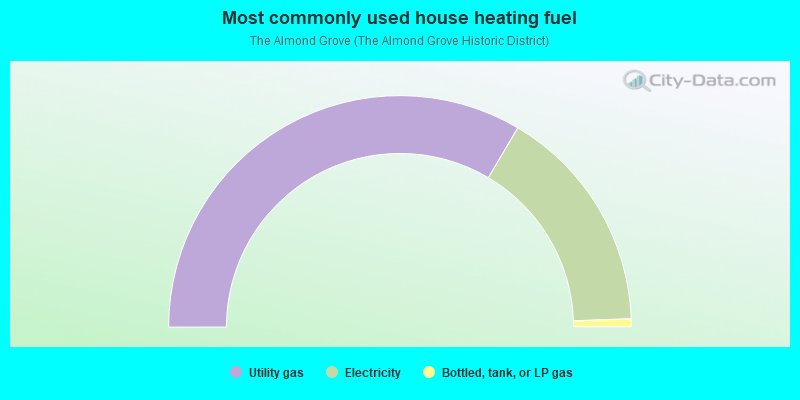
- 67.1%Utility gas
- 31.9%Electricity
- 1.1%Bottled, tank, or LP gas
Highways in this neighborhood:
Saratoga Los Gatos Rd (Los Gatos Saratoga Rd, State Hwy 9)
Length: 0.19 miles
Direction: SE-NW
Address range: 200 to 308
Direction: SE-NW
Address range: 200 to 308
Roads and streets:
Tait Ave
Length: 0.51 miles
Directions: N-S, SW-NE
Address range: 1 to 398
Directions: N-S, SW-NE
Address range: 1 to 398
N Santa Cruz Ave
Length: 0.50 miles
Directions: N-S, SW-NE
Address range: 1 to 403
Directions: N-S, SW-NE
Address range: 1 to 403
Massol Ct (Massol Ave)
Length: 0.41 miles
Directions: N-S, SW-NE
Address range: 1 to 399
Directions: N-S, SW-NE
Address range: 1 to 399
Victory Ln
Length: 0.36 miles
Directions: N-S, SW-NE
Address range: 1 to 299
Directions: N-S, SW-NE
Address range: 1 to 299
Nicholson Ave
Length: 0.30 miles
Directions: E-W, SE-NW
Address range: 200 to 397
Directions: E-W, SE-NW
Address range: 200 to 397
Bean Ave
Length: 0.29 miles
Directions: E-W, N-S, SE-NW
Address range: 200 to 399
Directions: E-W, N-S, SE-NW
Address range: 200 to 399
Bachman Ave
Length: 0.29 miles
Direction: SE-NW
Address range: 200 to 353
Direction: SE-NW
Address range: 200 to 353
Wilder Ave
Length: 0.22 miles
Directions: N-S, SW-NE
Address range: 100 to 299
Directions: N-S, SW-NE
Address range: 100 to 299
Almendra Ave
Length: 0.21 miles
Directions: E-W, SE-NW
Address range: 200 to 399
Directions: E-W, SE-NW
Address range: 200 to 399
W Main St
Length: 0.20 miles
Directions: E-W, SE-NW
Address range: 126 to 328
Directions: E-W, SE-NW
Address range: 126 to 328
Bayview Ave
Length: 0.14 miles
Direction: SW-NE
Address range: 1 to 99
Direction: SW-NE
Address range: 1 to 99
Glen Ridge Ave
Length: 0.12 miles
Directions: N-S, SE-NW
Address range: 1 to 99
Directions: N-S, SE-NW
Address range: 1 to 99
Pennsylvania Ave
Length: 0.11 miles
Direction: SE-NW
Address range: 2 to 48
Direction: SE-NW
Address range: 2 to 48
Lyndon Ave
Length: 0.08 miles
Direction: SW-NE
Address range: 1 to 99
Direction: SW-NE
Address range: 1 to 99