Los Gatos, California Submit your own pictures of this town and show them to the world
OSM Map
General Map
Google Map
MSN Map
OSM Map
General Map
Google Map
MSN Map
OSM Map
General Map
Google Map
MSN Map
OSM Map
General Map
Google Map
MSN Map
Please wait while loading the map...
Population in 2022: 32,402 (99% urban, 1% rural). Population change since 2000: +13.3%Males: 16,121 Females: 16,281
March 2022 cost of living index in Los Gatos: 131.7 (high, U.S. average is 100) Percentage of residents living in poverty in 2022: 3.9%for White Non-Hispanic residents , 0.3% for Black residents , 6.2% for Hispanic or Latino residents , 14.4% for other race residents , 1.3% for two or more races residents )
Profiles of local businesses
Business Search - 14 Million verified businesses
Data:
Median household income ($)
Median household income (% change since 2000)
Household income diversity
Ratio of average income to average house value (%)
Ratio of average income to average rent
Median household income ($) - White
Median household income ($) - Black or African American
Median household income ($) - Asian
Median household income ($) - Hispanic or Latino
Median household income ($) - American Indian and Alaska Native
Median household income ($) - Multirace
Median household income ($) - Other Race
Median household income for houses/condos with a mortgage ($)
Median household income for apartments without a mortgage ($)
Races - White alone (%)
Races - White alone (% change since 2000)
Races - Black alone (%)
Races - Black alone (% change since 2000)
Races - American Indian alone (%)
Races - American Indian alone (% change since 2000)
Races - Asian alone (%)
Races - Asian alone (% change since 2000)
Races - Hispanic (%)
Races - Hispanic (% change since 2000)
Races - Native Hawaiian and Other Pacific Islander alone (%)
Races - Native Hawaiian and Other Pacific Islander alone (% change since 2000)
Races - Two or more races (%)
Races - Two or more races (% change since 2000)
Races - Other race alone (%)
Races - Other race alone (% change since 2000)
Racial diversity
Unemployment (%)
Unemployment (% change since 2000)
Unemployment (%) - White
Unemployment (%) - Black or African American
Unemployment (%) - Asian
Unemployment (%) - Hispanic or Latino
Unemployment (%) - American Indian and Alaska Native
Unemployment (%) - Multirace
Unemployment (%) - Other Race
Population density (people per square mile)
Population - Males (%)
Population - Females (%)
Population - Males (%) - White
Population - Males (%) - Black or African American
Population - Males (%) - Asian
Population - Males (%) - Hispanic or Latino
Population - Males (%) - American Indian and Alaska Native
Population - Males (%) - Multirace
Population - Males (%) - Other Race
Population - Females (%) - White
Population - Females (%) - Black or African American
Population - Females (%) - Asian
Population - Females (%) - Hispanic or Latino
Population - Females (%) - American Indian and Alaska Native
Population - Females (%) - Multirace
Population - Females (%) - Other Race
Coronavirus confirmed cases (Apr 27, 2024)
Deaths caused by coronavirus (Apr 27, 2024)
Coronavirus confirmed cases (per 100k population) (Apr 27, 2024)
Deaths caused by coronavirus (per 100k population) (Apr 27, 2024)
Daily increase in number of cases (Apr 27, 2024)
Weekly increase in number of cases (Apr 27, 2024)
Cases doubled (in days) (Apr 27, 2024)
Hospitalized patients (Apr 18, 2022)
Negative test results (Apr 18, 2022)
Total test results (Apr 18, 2022)
COVID Vaccine doses distributed (per 100k population) (Sep 19, 2023)
COVID Vaccine doses administered (per 100k population) (Sep 19, 2023)
COVID Vaccine doses distributed (Sep 19, 2023)
COVID Vaccine doses administered (Sep 19, 2023)
Likely homosexual households (%)
Likely homosexual households (% change since 2000)
Likely homosexual households - Lesbian couples (%)
Likely homosexual households - Lesbian couples (% change since 2000)
Likely homosexual households - Gay men (%)
Likely homosexual households - Gay men (% change since 2000)
Cost of living index
Median gross rent ($)
Median contract rent ($)
Median monthly housing costs ($)
Median house or condo value ($)
Median house or condo value ($ change since 2000)
Mean house or condo value by units in structure - 1, detached ($)
Mean house or condo value by units in structure - 1, attached ($)
Mean house or condo value by units in structure - 2 ($)
Mean house or condo value by units in structure by units in structure - 3 or 4 ($)
Mean house or condo value by units in structure - 5 or more ($)
Mean house or condo value by units in structure - Boat, RV, van, etc. ($)
Mean house or condo value by units in structure - Mobile home ($)
Median house or condo value ($) - White
Median house or condo value ($) - Black or African American
Median house or condo value ($) - Asian
Median house or condo value ($) - Hispanic or Latino
Median house or condo value ($) - American Indian and Alaska Native
Median house or condo value ($) - Multirace
Median house or condo value ($) - Other Race
Median resident age
Resident age diversity
Median resident age - Males
Median resident age - Females
Median resident age - White
Median resident age - Black or African American
Median resident age - Asian
Median resident age - Hispanic or Latino
Median resident age - American Indian and Alaska Native
Median resident age - Multirace
Median resident age - Other Race
Median resident age - Males - White
Median resident age - Males - Black or African American
Median resident age - Males - Asian
Median resident age - Males - Hispanic or Latino
Median resident age - Males - American Indian and Alaska Native
Median resident age - Males - Multirace
Median resident age - Males - Other Race
Median resident age - Females - White
Median resident age - Females - Black or African American
Median resident age - Females - Asian
Median resident age - Females - Hispanic or Latino
Median resident age - Females - American Indian and Alaska Native
Median resident age - Females - Multirace
Median resident age - Females - Other Race
Commute - mean travel time to work (minutes)
Travel time to work - Less than 5 minutes (%)
Travel time to work - Less than 5 minutes (% change since 2000)
Travel time to work - 5 to 9 minutes (%)
Travel time to work - 5 to 9 minutes (% change since 2000)
Travel time to work - 10 to 19 minutes (%)
Travel time to work - 10 to 19 minutes (% change since 2000)
Travel time to work - 20 to 29 minutes (%)
Travel time to work - 20 to 29 minutes (% change since 2000)
Travel time to work - 30 to 39 minutes (%)
Travel time to work - 30 to 39 minutes (% change since 2000)
Travel time to work - 40 to 59 minutes (%)
Travel time to work - 40 to 59 minutes (% change since 2000)
Travel time to work - 60 to 89 minutes (%)
Travel time to work - 60 to 89 minutes (% change since 2000)
Travel time to work - 90 or more minutes (%)
Travel time to work - 90 or more minutes (% change since 2000)
Marital status - Never married (%)
Marital status - Now married (%)
Marital status - Separated (%)
Marital status - Widowed (%)
Marital status - Divorced (%)
Median family income ($)
Median family income (% change since 2000)
Median non-family income ($)
Median non-family income (% change since 2000)
Median per capita income ($)
Median per capita income (% change since 2000)
Median family income ($) - White
Median family income ($) - Black or African American
Median family income ($) - Asian
Median family income ($) - Hispanic or Latino
Median family income ($) - American Indian and Alaska Native
Median family income ($) - Multirace
Median family income ($) - Other Race
Median year house/condo built
Median year apartment built
Year house built - Built 2005 or later (%)
Year house built - Built 2000 to 2004 (%)
Year house built - Built 1990 to 1999 (%)
Year house built - Built 1980 to 1989 (%)
Year house built - Built 1970 to 1979 (%)
Year house built - Built 1960 to 1969 (%)
Year house built - Built 1950 to 1959 (%)
Year house built - Built 1940 to 1949 (%)
Year house built - Built 1939 or earlier (%)
Average household size
Household density (households per square mile)
Average household size - White
Average household size - Black or African American
Average household size - Asian
Average household size - Hispanic or Latino
Average household size - American Indian and Alaska Native
Average household size - Multirace
Average household size - Other Race
Occupied housing units (%)
Vacant housing units (%)
Owner occupied housing units (%)
Renter occupied housing units (%)
Vacancy status - For rent (%)
Vacancy status - For sale only (%)
Vacancy status - Rented or sold, not occupied (%)
Vacancy status - For seasonal, recreational, or occasional use (%)
Vacancy status - For migrant workers (%)
Vacancy status - Other vacant (%)
Residents with income below the poverty level (%)
Residents with income below 50% of the poverty level (%)
Children below poverty level (%)
Poor families by family type - Married-couple family (%)
Poor families by family type - Male, no wife present (%)
Poor families by family type - Female, no husband present (%)
Poverty status for native-born residents (%)
Poverty status for foreign-born residents (%)
Poverty among high school graduates not in families (%)
Poverty among people who did not graduate high school not in families (%)
Residents with income below the poverty level (%) - White
Residents with income below the poverty level (%) - Black or African American
Residents with income below the poverty level (%) - Asian
Residents with income below the poverty level (%) - Hispanic or Latino
Residents with income below the poverty level (%) - American Indian and Alaska Native
Residents with income below the poverty level (%) - Multirace
Residents with income below the poverty level (%) - Other Race
Air pollution - Air Quality Index (AQI)
Air pollution - CO
Air pollution - NO2
Air pollution - SO2
Air pollution - Ozone
Air pollution - PM10
Air pollution - PM25
Air pollution - Pb
Crime - Murders per 100,000 population
Crime - Rapes per 100,000 population
Crime - Robberies per 100,000 population
Crime - Assaults per 100,000 population
Crime - Burglaries per 100,000 population
Crime - Thefts per 100,000 population
Crime - Auto thefts per 100,000 population
Crime - Arson per 100,000 population
Crime - City-data.com crime index
Crime - Violent crime index
Crime - Property crime index
Crime - Murders per 100,000 population (5 year average)
Crime - Rapes per 100,000 population (5 year average)
Crime - Robberies per 100,000 population (5 year average)
Crime - Assaults per 100,000 population (5 year average)
Crime - Burglaries per 100,000 population (5 year average)
Crime - Thefts per 100,000 population (5 year average)
Crime - Auto thefts per 100,000 population (5 year average)
Crime - Arson per 100,000 population (5 year average)
Crime - City-data.com crime index (5 year average)
Crime - Violent crime index (5 year average)
Crime - Property crime index (5 year average)
1996 Presidential Elections Results (%) - Democratic Party (Clinton)
1996 Presidential Elections Results (%) - Republican Party (Dole)
1996 Presidential Elections Results (%) - Other
2000 Presidential Elections Results (%) - Democratic Party (Gore)
2000 Presidential Elections Results (%) - Republican Party (Bush)
2000 Presidential Elections Results (%) - Other
2004 Presidential Elections Results (%) - Democratic Party (Kerry)
2004 Presidential Elections Results (%) - Republican Party (Bush)
2004 Presidential Elections Results (%) - Other
2008 Presidential Elections Results (%) - Democratic Party (Obama)
2008 Presidential Elections Results (%) - Republican Party (McCain)
2008 Presidential Elections Results (%) - Other
2012 Presidential Elections Results (%) - Democratic Party (Obama)
2012 Presidential Elections Results (%) - Republican Party (Romney)
2012 Presidential Elections Results (%) - Other
2016 Presidential Elections Results (%) - Democratic Party (Clinton)
2016 Presidential Elections Results (%) - Republican Party (Trump)
2016 Presidential Elections Results (%) - Other
2020 Presidential Elections Results (%) - Democratic Party (Biden)
2020 Presidential Elections Results (%) - Republican Party (Trump)
2020 Presidential Elections Results (%) - Other
Ancestries Reported - Arab (%)
Ancestries Reported - Czech (%)
Ancestries Reported - Danish (%)
Ancestries Reported - Dutch (%)
Ancestries Reported - English (%)
Ancestries Reported - French (%)
Ancestries Reported - French Canadian (%)
Ancestries Reported - German (%)
Ancestries Reported - Greek (%)
Ancestries Reported - Hungarian (%)
Ancestries Reported - Irish (%)
Ancestries Reported - Italian (%)
Ancestries Reported - Lithuanian (%)
Ancestries Reported - Norwegian (%)
Ancestries Reported - Polish (%)
Ancestries Reported - Portuguese (%)
Ancestries Reported - Russian (%)
Ancestries Reported - Scotch-Irish (%)
Ancestries Reported - Scottish (%)
Ancestries Reported - Slovak (%)
Ancestries Reported - Subsaharan African (%)
Ancestries Reported - Swedish (%)
Ancestries Reported - Swiss (%)
Ancestries Reported - Ukrainian (%)
Ancestries Reported - United States (%)
Ancestries Reported - Welsh (%)
Ancestries Reported - West Indian (%)
Ancestries Reported - Other (%)
Educational Attainment - No schooling completed (%)
Educational Attainment - Less than high school (%)
Educational Attainment - High school or equivalent (%)
Educational Attainment - Less than 1 year of college (%)
Educational Attainment - 1 or more years of college (%)
Educational Attainment - Associate degree (%)
Educational Attainment - Bachelor's degree (%)
Educational Attainment - Master's degree (%)
Educational Attainment - Professional school degree (%)
Educational Attainment - Doctorate degree (%)
School Enrollment - Nursery, preschool (%)
School Enrollment - Kindergarten (%)
School Enrollment - Grade 1 to 4 (%)
School Enrollment - Grade 5 to 8 (%)
School Enrollment - Grade 9 to 12 (%)
School Enrollment - College undergrad (%)
School Enrollment - Graduate or professional (%)
School Enrollment - Not enrolled in school (%)
School enrollment - Public schools (%)
School enrollment - Private schools (%)
School enrollment - Not enrolled (%)
Median number of rooms in houses and condos
Median number of rooms in apartments
Housing units lacking complete plumbing facilities (%)
Housing units lacking complete kitchen facilities (%)
Density of houses
Urban houses (%)
Rural houses (%)
Households with people 60 years and over (%)
Households with people 65 years and over (%)
Households with people 75 years and over (%)
Households with one or more nonrelatives (%)
Households with no nonrelatives (%)
Population in households (%)
Family households (%)
Nonfamily households (%)
Population in families (%)
Family households with own children (%)
Median number of bedrooms in owner occupied houses
Mean number of bedrooms in owner occupied houses
Median number of bedrooms in renter occupied houses
Mean number of bedrooms in renter occupied houses
Median number of vehichles in owner occupied houses
Mean number of vehichles in owner occupied houses
Median number of vehichles in renter occupied houses
Mean number of vehichles in renter occupied houses
Mortgage status - with mortgage (%)
Mortgage status - with second mortgage (%)
Mortgage status - with home equity loan (%)
Mortgage status - with both second mortgage and home equity loan (%)
Mortgage status - without a mortgage (%)
Average family size
Average family size - White
Average family size - Black or African American
Average family size - Asian
Average family size - Hispanic or Latino
Average family size - American Indian and Alaska Native
Average family size - Multirace
Average family size - Other Race
Geographical mobility - Same house 1 year ago (%)
Geographical mobility - Moved within same county (%)
Geographical mobility - Moved from different county within same state (%)
Geographical mobility - Moved from different state (%)
Geographical mobility - Moved from abroad (%)
Place of birth - Born in state of residence (%)
Place of birth - Born in other state (%)
Place of birth - Native, outside of US (%)
Place of birth - Foreign born (%)
Housing units in structures - 1, detached (%)
Housing units in structures - 1, attached (%)
Housing units in structures - 2 (%)
Housing units in structures - 3 or 4 (%)
Housing units in structures - 5 to 9 (%)
Housing units in structures - 10 to 19 (%)
Housing units in structures - 20 to 49 (%)
Housing units in structures - 50 or more (%)
Housing units in structures - Mobile home (%)
Housing units in structures - Boat, RV, van, etc. (%)
House/condo owner moved in on average (years ago)
Renter moved in on average (years ago)
Year householder moved into unit - Moved in 1999 to March 2000 (%)
Year householder moved into unit - Moved in 1995 to 1998 (%)
Year householder moved into unit - Moved in 1990 to 1994 (%)
Year householder moved into unit - Moved in 1980 to 1989 (%)
Year householder moved into unit - Moved in 1970 to 1979 (%)
Year householder moved into unit - Moved in 1969 or earlier (%)
Means of transportation to work - Drove car alone (%)
Means of transportation to work - Carpooled (%)
Means of transportation to work - Public transportation (%)
Means of transportation to work - Bus or trolley bus (%)
Means of transportation to work - Streetcar or trolley car (%)
Means of transportation to work - Subway or elevated (%)
Means of transportation to work - Railroad (%)
Means of transportation to work - Ferryboat (%)
Means of transportation to work - Taxicab (%)
Means of transportation to work - Motorcycle (%)
Means of transportation to work - Bicycle (%)
Means of transportation to work - Walked (%)
Means of transportation to work - Other means (%)
Working at home (%)
Industry diversity
Most Common Industries - Agriculture, forestry, fishing and hunting, and mining (%)
Most Common Industries - Agriculture, forestry, fishing and hunting (%)
Most Common Industries - Mining, quarrying, and oil and gas extraction (%)
Most Common Industries - Construction (%)
Most Common Industries - Manufacturing (%)
Most Common Industries - Wholesale trade (%)
Most Common Industries - Retail trade (%)
Most Common Industries - Transportation and warehousing, and utilities (%)
Most Common Industries - Transportation and warehousing (%)
Most Common Industries - Utilities (%)
Most Common Industries - Information (%)
Most Common Industries - Finance and insurance, and real estate and rental and leasing (%)
Most Common Industries - Finance and insurance (%)
Most Common Industries - Real estate and rental and leasing (%)
Most Common Industries - Professional, scientific, and management, and administrative and waste management services (%)
Most Common Industries - Professional, scientific, and technical services (%)
Most Common Industries - Management of companies and enterprises (%)
Most Common Industries - Administrative and support and waste management services (%)
Most Common Industries - Educational services, and health care and social assistance (%)
Most Common Industries - Educational services (%)
Most Common Industries - Health care and social assistance (%)
Most Common Industries - Arts, entertainment, and recreation, and accommodation and food services (%)
Most Common Industries - Arts, entertainment, and recreation (%)
Most Common Industries - Accommodation and food services (%)
Most Common Industries - Other services, except public administration (%)
Most Common Industries - Public administration (%)
Occupation diversity
Most Common Occupations - Management, business, science, and arts occupations (%)
Most Common Occupations - Management, business, and financial occupations (%)
Most Common Occupations - Management occupations (%)
Most Common Occupations - Business and financial operations occupations (%)
Most Common Occupations - Computer, engineering, and science occupations (%)
Most Common Occupations - Computer and mathematical occupations (%)
Most Common Occupations - Architecture and engineering occupations (%)
Most Common Occupations - Life, physical, and social science occupations (%)
Most Common Occupations - Education, legal, community service, arts, and media occupations (%)
Most Common Occupations - Community and social service occupations (%)
Most Common Occupations - Legal occupations (%)
Most Common Occupations - Education, training, and library occupations (%)
Most Common Occupations - Arts, design, entertainment, sports, and media occupations (%)
Most Common Occupations - Healthcare practitioners and technical occupations (%)
Most Common Occupations - Health diagnosing and treating practitioners and other technical occupations (%)
Most Common Occupations - Health technologists and technicians (%)
Most Common Occupations - Service occupations (%)
Most Common Occupations - Healthcare support occupations (%)
Most Common Occupations - Protective service occupations (%)
Most Common Occupations - Fire fighting and prevention, and other protective service workers including supervisors (%)
Most Common Occupations - Law enforcement workers including supervisors (%)
Most Common Occupations - Food preparation and serving related occupations (%)
Most Common Occupations - Building and grounds cleaning and maintenance occupations (%)
Most Common Occupations - Personal care and service occupations (%)
Most Common Occupations - Sales and office occupations (%)
Most Common Occupations - Sales and related occupations (%)
Most Common Occupations - Office and administrative support occupations (%)
Most Common Occupations - Natural resources, construction, and maintenance occupations (%)
Most Common Occupations - Farming, fishing, and forestry occupations (%)
Most Common Occupations - Construction and extraction occupations (%)
Most Common Occupations - Installation, maintenance, and repair occupations (%)
Most Common Occupations - Production, transportation, and material moving occupations (%)
Most Common Occupations - Production occupations (%)
Most Common Occupations - Transportation occupations (%)
Most Common Occupations - Material moving occupations (%)
People in Group quarters - Institutionalized population (%)
People in Group quarters - Correctional institutions (%)
People in Group quarters - Federal prisons and detention centers (%)
People in Group quarters - Halfway houses (%)
People in Group quarters - Local jails and other confinement facilities (including police lockups) (%)
People in Group quarters - Military disciplinary barracks (%)
People in Group quarters - State prisons (%)
People in Group quarters - Other types of correctional institutions (%)
People in Group quarters - Nursing homes (%)
People in Group quarters - Hospitals/wards, hospices, and schools for the handicapped (%)
People in Group quarters - Hospitals/wards and hospices for chronically ill (%)
People in Group quarters - Hospices or homes for chronically ill (%)
People in Group quarters - Military hospitals or wards for chronically ill (%)
People in Group quarters - Other hospitals or wards for chronically ill (%)
People in Group quarters - Hospitals or wards for drug/alcohol abuse (%)
People in Group quarters - Mental (Psychiatric) hospitals or wards (%)
People in Group quarters - Schools, hospitals, or wards for the mentally retarded (%)
People in Group quarters - Schools, hospitals, or wards for the physically handicapped (%)
People in Group quarters - Institutions for the deaf (%)
People in Group quarters - Institutions for the blind (%)
People in Group quarters - Orthopedic wards and institutions for the physically handicapped (%)
People in Group quarters - Wards in general hospitals for patients who have no usual home elsewhere (%)
People in Group quarters - Wards in military hospitals for patients who have no usual home elsewhere (%)
People in Group quarters - Juvenile institutions (%)
People in Group quarters - Long-term care (%)
People in Group quarters - Homes for abused, dependent, and neglected children (%)
People in Group quarters - Residential treatment centers for emotionally disturbed children (%)
People in Group quarters - Training schools for juvenile delinquents (%)
People in Group quarters - Short-term care, detention or diagnostic centers for delinquent children (%)
People in Group quarters - Type of juvenile institution unknown (%)
People in Group quarters - Noninstitutionalized population (%)
People in Group quarters - College dormitories (includes college quarters off campus) (%)
People in Group quarters - Military quarters (%)
People in Group quarters - On base (%)
People in Group quarters - Barracks, unaccompanied personnel housing (UPH), (Enlisted/Officer), ;and similar group living quarters for military personnel (%)
People in Group quarters - Transient quarters for temporary residents (%)
People in Group quarters - Military ships (%)
People in Group quarters - Group homes (%)
People in Group quarters - Homes or halfway houses for drug/alcohol abuse (%)
People in Group quarters - Homes for the mentally ill (%)
People in Group quarters - Homes for the mentally retarded (%)
People in Group quarters - Homes for the physically handicapped (%)
People in Group quarters - Other group homes (%)
People in Group quarters - Religious group quarters (%)
People in Group quarters - Dormitories (%)
People in Group quarters - Agriculture workers' dormitories on farms (%)
People in Group quarters - Job Corps and vocational training facilities (%)
People in Group quarters - Other workers' dormitories (%)
People in Group quarters - Crews of maritime vessels (%)
People in Group quarters - Other nonhousehold living situations (%)
People in Group quarters - Other noninstitutional group quarters (%)
Residents speaking English at home (%)
Residents speaking English at home - Born in the United States (%)
Residents speaking English at home - Native, born elsewhere (%)
Residents speaking English at home - Foreign born (%)
Residents speaking Spanish at home (%)
Residents speaking Spanish at home - Born in the United States (%)
Residents speaking Spanish at home - Native, born elsewhere (%)
Residents speaking Spanish at home - Foreign born (%)
Residents speaking other language at home (%)
Residents speaking other language at home - Born in the United States (%)
Residents speaking other language at home - Native, born elsewhere (%)
Residents speaking other language at home - Foreign born (%)
Class of Workers - Employee of private company (%)
Class of Workers - Self-employed in own incorporated business (%)
Class of Workers - Private not-for-profit wage and salary workers (%)
Class of Workers - Local government workers (%)
Class of Workers - State government workers (%)
Class of Workers - Federal government workers (%)
Class of Workers - Self-employed workers in own not incorporated business and Unpaid family workers (%)
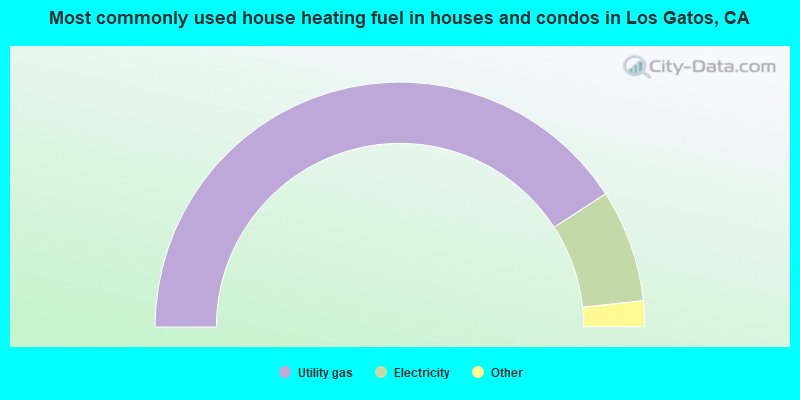
House heating fuel used in houses and condos - Utility gas (%)
House heating fuel used in houses and condos - Bottled, tank, or LP gas (%)
House heating fuel used in houses and condos - Electricity (%)
House heating fuel used in houses and condos - Fuel oil, kerosene, etc. (%)
House heating fuel used in houses and condos - Coal or coke (%)
House heating fuel used in houses and condos - Wood (%)
House heating fuel used in houses and condos - Solar energy (%)
House heating fuel used in houses and condos - Other fuel (%)
House heating fuel used in houses and condos - No fuel used (%)
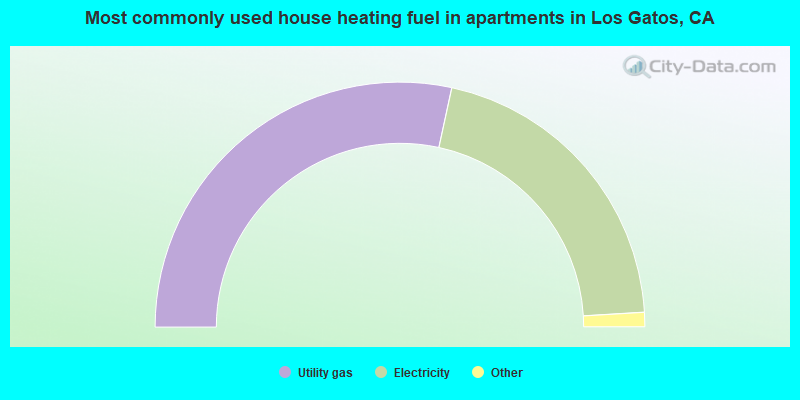
House heating fuel used in apartments - Utility gas (%)
House heating fuel used in apartments - Bottled, tank, or LP gas (%)
House heating fuel used in apartments - Electricity (%)
House heating fuel used in apartments - Fuel oil, kerosene, etc. (%)
House heating fuel used in apartments - Coal or coke (%)
House heating fuel used in apartments - Wood (%)
House heating fuel used in apartments - Solar energy (%)
House heating fuel used in apartments - Other fuel (%)
House heating fuel used in apartments - No fuel used (%)
Armed forces status - In Armed Forces (%)
Armed forces status - Civilian (%)
Armed forces status - Civilian - Veteran (%)
Armed forces status - Civilian - Nonveteran (%)
Fatal accidents locations in years 2005-2021
Fatal accidents locations in 2005
Fatal accidents locations in 2006
Fatal accidents locations in 2007
Fatal accidents locations in 2008
Fatal accidents locations in 2009
Fatal accidents locations in 2010
Fatal accidents locations in 2011
Fatal accidents locations in 2012
Fatal accidents locations in 2013
Fatal accidents locations in 2014
Fatal accidents locations in 2015
Fatal accidents locations in 2016
Fatal accidents locations in 2017
Fatal accidents locations in 2018
Fatal accidents locations in 2019
Fatal accidents locations in 2020
Fatal accidents locations in 2021
Alcohol use - People drinking some alcohol every month (%)
Alcohol use - People not drinking at all (%)
Alcohol use - Average days/month drinking alcohol
Alcohol use - Average drinks/week
Alcohol use - Average days/year people drink much
Audiometry - Average condition of hearing (%)
Audiometry - People that can hear a whisper from across a quiet room (%)
Audiometry - People that can hear normal voice from across a quiet room (%)
Audiometry - Ears ringing, roaring, buzzing (%)
Audiometry - Had a job exposure to loud noise (%)
Audiometry - Had off-work exposure to loud noise (%)
Blood Pressure & Cholesterol - Has high blood pressure (%)
Blood Pressure & Cholesterol - Checking blood pressure at home (%)
Blood Pressure & Cholesterol - Frequently checking blood cholesterol (%)
Blood Pressure & Cholesterol - Has high cholesterol level (%)
Consumer Behavior - Money monthly spent on food at supermarket/grocery store
Consumer Behavior - Money monthly spent on food at other stores
Consumer Behavior - Money monthly spent on eating out
Consumer Behavior - Money monthly spent on carryout/delivered foods
Consumer Behavior - Income spent on food at supermarket/grocery store (%)
Consumer Behavior - Income spent on food at other stores (%)
Consumer Behavior - Income spent on eating out (%)
Consumer Behavior - Income spent on carryout/delivered foods (%)
Current Health Status - General health condition (%)
Current Health Status - Blood donors (%)
Current Health Status - Has blood ever tested for HIV virus (%)
Current Health Status - Left-handed people (%)
Dermatology - People using sunscreen (%)
Diabetes - Diabetics (%)
Diabetes - Had a blood test for high blood sugar (%)
Diabetes - People taking insulin (%)
Diet Behavior & Nutrition - Diet health (%)
Diet Behavior & Nutrition - Milk product consumption (# of products/month)
Diet Behavior & Nutrition - Meals not home prepared (#/week)
Diet Behavior & Nutrition - Meals from fast food or pizza place (#/week)
Diet Behavior & Nutrition - Ready-to-eat foods (#/month)
Diet Behavior & Nutrition - Frozen meals/pizza (#/month)
Drug Use - People that ever used marijuana or hashish (%)
Drug Use - Ever used hard drugs (%)
Drug Use - Ever used any form of cocaine (%)
Drug Use - Ever used heroin (%)
Drug Use - Ever used methamphetamine (%)
Health Insurance - People covered by health insurance (%)
Kidney Conditions-Urology - Avg. # of times urinating at night
Medical Conditions - People with asthma (%)
Medical Conditions - People with anemia (%)
Medical Conditions - People with psoriasis (%)
Medical Conditions - People with overweight (%)
Medical Conditions - Elderly people having difficulties in thinking or remembering (%)
Medical Conditions - People who ever received blood transfusion (%)
Medical Conditions - People having trouble seeing even with glass/contacts (%)
Medical Conditions - People with arthritis (%)
Medical Conditions - People with gout (%)
Medical Conditions - People with congestive heart failure (%)
Medical Conditions - People with coronary heart disease (%)
Medical Conditions - People with angina pectoris (%)
Medical Conditions - People who ever had heart attack (%)
Medical Conditions - People who ever had stroke (%)
Medical Conditions - People with emphysema (%)
Medical Conditions - People with thyroid problem (%)
Medical Conditions - People with chronic bronchitis (%)
Medical Conditions - People with any liver condition (%)
Medical Conditions - People who ever had cancer or malignancy (%)
Mental Health - People who have little interest in doing things (%)
Mental Health - People feeling down, depressed, or hopeless (%)
Mental Health - People who have trouble sleeping or sleeping too much (%)
Mental Health - People feeling tired or having little energy (%)
Mental Health - People with poor appetite or overeating (%)
Mental Health - People feeling bad about themself (%)
Mental Health - People who have trouble concentrating on things (%)
Mental Health - People moving or speaking slowly or too fast (%)
Mental Health - People having thoughts they would be better off dead (%)
Oral Health - Average years since last visit a dentist
Oral Health - People embarrassed because of mouth (%)
Oral Health - People with gum disease (%)
Oral Health - General health of teeth and gums (%)
Oral Health - Average days a week using dental floss/device
Oral Health - Average days a week using mouthwash for dental problem
Oral Health - Average number of teeth
Pesticide Use - Households using pesticides to control insects (%)
Pesticide Use - Households using pesticides to kill weeds (%)
Physical Activity - People doing vigorous-intensity work activities (%)
Physical Activity - People doing moderate-intensity work activities (%)
Physical Activity - People walking or bicycling (%)
Physical Activity - People doing vigorous-intensity recreational activities (%)
Physical Activity - People doing moderate-intensity recreational activities (%)
Physical Activity - Average hours a day doing sedentary activities
Physical Activity - Average hours a day watching TV or videos
Physical Activity - Average hours a day using computer
Physical Functioning - People having limitations keeping them from working (%)
Physical Functioning - People limited in amount of work they can do (%)
Physical Functioning - People that need special equipment to walk (%)
Physical Functioning - People experiencing confusion/memory problems (%)
Physical Functioning - People requiring special healthcare equipment (%)
Prescription Medications - Average number of prescription medicines taking
Preventive Aspirin Use - Adults 40+ taking low-dose aspirin (%)
Reproductive Health - Vaginal deliveries (%)
Reproductive Health - Cesarean deliveries (%)
Reproductive Health - Deliveries resulted in a live birth (%)
Reproductive Health - Pregnancies resulted in a delivery (%)
Reproductive Health - Women breastfeeding newborns (%)
Reproductive Health - Women that had a hysterectomy (%)
Reproductive Health - Women that had both ovaries removed (%)
Reproductive Health - Women that have ever taken birth control pills (%)
Reproductive Health - Women taking birth control pills (%)
Reproductive Health - Women that have ever used Depo-Provera or injectables (%)
Reproductive Health - Women that have ever used female hormones (%)
Sexual Behavior - People 18+ that ever had sex (vaginal, anal, or oral) (%)
Sexual Behavior - Males 18+ that ever had vaginal sex with a woman (%)
Sexual Behavior - Males 18+ that ever performed oral sex on a woman (%)
Sexual Behavior - Males 18+ that ever had anal sex with a woman (%)
Sexual Behavior - Males 18+ that ever had any sex with a man (%)
Sexual Behavior - Females 18+ that ever had vaginal sex with a man (%)
Sexual Behavior - Females 18+ that ever performed oral sex on a man (%)
Sexual Behavior - Females 18+ that ever had anal sex with a man (%)
Sexual Behavior - Females 18+ that ever had any kind of sex with a woman (%)
Sexual Behavior - Average age people first had sex
Sexual Behavior - Average number of female sex partners in lifetime (males 18+)
Sexual Behavior - Average number of female vaginal sex partners in lifetime (males 18+)
Sexual Behavior - Average age people first performed oral sex on a woman (18+)
Sexual Behavior - Average number of woman performed oral sex on in lifetime (18+)
Sexual Behavior - Average number of male sex partners in lifetime (males 18+)
Sexual Behavior - Average number of male anal sex partners in lifetime (males 18+)
Sexual Behavior - Average age people first performed oral sex on a man (18+)
Sexual Behavior - Average number of male oral sex partners in lifetime (18+)
Sexual Behavior - People using protection when performing oral sex (%)
Sexual Behavior - Average number of times people have vaginal or anal sex a year
Sexual Behavior - People having sex without condom (%)
Sexual Behavior - Average number of male sex partners in lifetime (females 18+)
Sexual Behavior - Average number of male vaginal sex partners in lifetime (females 18+)
Sexual Behavior - Average number of female sex partners in lifetime (females 18+)
Sexual Behavior - Circumcised males 18+ (%)
Sleep Disorders - Average hours sleeping at night
Sleep Disorders - People that has trouble sleeping (%)
Smoking-Cigarette Use - People smoking cigarettes (%)
Taste & Smell - People 40+ having problems with smell (%)
Taste & Smell - People 40+ having problems with taste (%)
Taste & Smell - People 40+ that ever had wisdom teeth removed (%)
Taste & Smell - People 40+ that ever had tonsils teeth removed (%)
Taste & Smell - People 40+ that ever had a loss of consciousness because of a head injury (%)
Taste & Smell - People 40+ that ever had a broken nose or other serious injury to face or skull (%)
Taste & Smell - People 40+ that ever had two or more sinus infections (%)
Weight - Average height (inches)
Weight - Average weight (pounds)
Weight - Average BMI
Weight - People that are obese (%)
Weight - People that ever were obese (%)
Weight - People trying to lose weight (%)
20,907 64.7% White alone 5,682 17.6% Asian alone 2,636 8.2% Hispanic 1,416 4.4% Two or more races 355 1.1% Black alone 236 0.7% Other race alone 9 0.03% American Indian alone
According to our research of California and other state lists, there were 23 registered sex offenders living in Los Gatos, California as of April 27, 2024 . The ratio of all residents to sex offenders in Los Gatos is 1,350 to 1.The ratio of registered sex offenders to all residents in this city is lower than the state average.
Officers per 1,000 residents here:
1.19California average:
2.30
Latest news from Los Gatos, CA collected exclusively by city-data.com from local newspapers, TV, and radio stations
Ancestries: European (8.8%), English (5.4%), German (5.0%), Irish (4.5%), Iranian (4.5%), Italian (3.9%).
Current Local Time:
Incorporated on 08/10/1887
Land area: 10.7 square miles.
Population density: 3,025 people per square mile (average).
8,333 residents are foreign born (14.5% Asia , 7.3% Europe ).
This town:
25.8%California:
26.5%
Median real estate property taxes paid for housing units with mortgages in 2022: $10,001 (0.4%)Median real estate property taxes paid for housing units with no mortgage in 2022: $7,799 (0.4%)
Nearest city with pop. 50,000+: San Jose, CA
Nearest city with pop. 1,000,000+: Los Angeles, CA
Nearest cities:
Latitude: 37.24 N, Longitude: 121.96 W
Daytime population change due to commuting: +7,379 (+22.8%)Workers who live and work in this town: 6,542 (43.4%)
Los Gatos tourist attractions:
Single-family new house construction building permits:
2022: 30 buildings , average cost: $692,8002021: 119 buildings , average cost: $417,1002020: 47 buildings , average cost: $492,9002019: 25 buildings , average cost: $763,3002018: 31 buildings , average cost: $1,093,9002017: 23 buildings , average cost: $1,018,6002016: 51 buildings , average cost: $779,8002015: 27 buildings , average cost: $1,489,2002014: 39 buildings , average cost: $1,077,2002013: 56 buildings , average cost: $826,5002012: 48 buildings , average cost: $751,8002011: 19 buildings , average cost: $800,7002010: 32 buildings , average cost: $886,2002009: 13 buildings , average cost: $816,1002008: 16 buildings , average cost: $833,5002007: 34 buildings , average cost: $815,2002006: 61 buildings , average cost: $701,7002005: 28 buildings , average cost: $882,2002004: 52 buildings , average cost: $464,5002003: 37 buildings , average cost: $355,4002002: 36 buildings , average cost: $359,2002001: 41 buildings , average cost: $292,5002000: 85 buildings , average cost: $259,7001999: 61 buildings , average cost: $241,0001998: 46 buildings , average cost: $283,7001997: 68 buildings , average cost: $286,500Unemployment in December 2023:
Population change in the 1990s: +1,210 (+4.4%).
Most common occupations in Los Gatos, CA (%)
Both Males Females
Other management occupations, except farmers and farm managers (9.3%)
Computer specialists (6.7%)
Top executives (5.4%)
Sales representatives, services, wholesale and manufacturing (5.4%)
Advertising, marketing, promotions, public relations, and sales managers (4.7%)
Other sales and related occupations, including supervisors (4.6%)
Engineers (4.0%)
Other management occupations, except farmers and farm managers (10.7%)
Computer specialists (9.2%)
Top executives (8.1%)
Sales representatives, services, wholesale and manufacturing (6.7%)
Engineers (6.6%)
Other sales and related occupations, including supervisors (5.3%)
Advertising, marketing, promotions, public relations, and sales managers (5.2%)
Other management occupations, except farmers and farm managers (7.6%)
Other office and administrative support workers, including supervisors (5.8%)
Preschool, kindergarten, elementary, and middle school teachers (5.8%)
Secretaries and administrative assistants (4.1%)
Advertising, marketing, promotions, public relations, and sales managers (4.0%)
Sales representatives, services, wholesale and manufacturing (3.7%)
Other sales and related occupations, including supervisors (3.7%)
Earthquake activity:
Los Gatos-area historical earthquake activity is significantly above California state average. It is 7589% greater than the overall U.S. average. On 4/18/1906 at 13:12:21, a magnitude 7.9 (7.9 UK, Class: Major, Intensity: VIII - XII) earthquake occurred 77.6 miles away from the city center, causing $524,000,000 total damage On 10/18/1989 at 00:04:15, a magnitude 7.1 (6.5 MB, 7.1 MS, 6.9 MW, 7.0 ML) earthquake occurred 13.7 miles away from the city center, causing 62 deaths ( 62 shaking deaths) and 3757 injuries, causing $1,305,032,704 total damage On 11/4/1927 at 13:51:53, a magnitude 7.5 (7.5 UK) earthquake occurred 168.8 miles away from Los Gatos center On 7/21/1952 at 11:52:14, a magnitude 7.7 (7.7 UK) earthquake occurred 226.5 miles away from Los Gatos center, causing $50,000,000 total damage On 1/31/1922 at 13:17:28, a magnitude 7.6 (7.6 UK) earthquake occurred 307.7 miles away from Los Gatos center On 12/21/1932 at 06:10:09, a magnitude 7.2 (7.2 UK) earthquake occurred 229.3 miles away from Los Gatos center Magnitude types: body-wave magnitude (MB), local magnitude (ML), surface-wave magnitude (MS), moment magnitude (MW) Natural disasters: The number of natural disasters in Santa Clara County (19) is greater than the US average (15).Major Disasters (Presidential) Declared: 10Emergencies Declared: 3Floods: 9, Fires: 5, Winter Storms: 5, Storms: 4, Mudslides: 3, Landslides: 2, Drought: 1, Earthquake: 1, Freeze: 1, Hurricane: 1, Tornado: 1, Other: 1 (Note: some incidents may be assigned to more than one category). Main business address for: NETFLIX INC SERVICES-VIDEO TAPE RENTAL ), HI/FN INC SEMICONDUCTORS & RELATED DEVICES ), SEMOTUS SOLUTIONS INC SERVICES-BUSINESS SERVICES, NEC ), ALPHASMART INC SERVICES-COMPUTER PROGRAMMING SERVICES ).
Hospitals in Los Gatos: MISSION OAKS HOSPITAL (300 DE SOTO DR) SERENO SURGERY CTR (14601 S BASCOM AVE, #100) SILICON VALLEY SURGERY CENTER (14601 SOUTH BASCOM AVENUE, STE 100) Nursing Homes in Los Gatos: COMMUNITY HOSPITAL OF LOS GATOS D/P SNF (815 POLLARD ROAD) EMMANUEL CONVALESCENT HOSPITAL OF LOS GATOS (371 LOS GATOS BOULEVARD) GEM CONV HOSP (15245 NATIONAL AVE) LOS GATOS MEADOWS GERIATRIC HOSPITAL (110 WOOD ROAD) LOS GATOS OAKS CONVALESCENT HOSPITAL (16605 LARK AVENUE) STONEBROOK HEALTH AND REHABILITATION (350 DE SOTO DRIVE) THE TERRACES OF LOS GATOS (800 BLOSSOM HILL ROAD) VASONA CREEK HEALTHCARE CENTER (16412 LOS GATOS BOULEVARD) WOODLANDS HEALTHCARE CENTER (14966 TERRENO DE FLORES LANE) Dialysis Facilities in Los Gatos: FMC LOS GATOS (14651 SOUTH BASCOM SUITE 100) Amtrak stations near Los Gatos: 8 miles: SAN JOSE (65 CAHILL ST.) Services: ticket office, fully wheelchair accessible, enclosed waiting area, public restrooms, public payphones, paid short-term parking, free long-term parking, taxi stand, public transit connection.
10 miles: SANTA CLARA-GREAT AMERICA (SANTA CLARA, FOOT OF STARS & STRIPES DR.) Services: partially wheelchair accessible, free short-term parking.
19 miles: SANTA CRUZ (920 PACIFIC AVE.) - Bus Station Services: fully wheelchair accessible, public payphones, snack bar, public transit connection.
Colleges/universities with over 2000 students nearest to Los Gatos:
West Valley College (about 4 miles; Saratoga, CA ; Full-time enrollment: 6,128)
San Jose City College (about 6 miles; San Jose, CA ; FT enrollment: 5,526)
De Anza College (about 8 miles; Cupertino, CA ; FT enrollment: 16,729)
San Jose State University (about 9 miles; San Jose, CA ; FT enrollment: 23,357)
Santa Clara University (about 9 miles; Santa Clara, CA ; FT enrollment: 7,640)
Mission College (about 11 miles; Santa Clara, CA ; FT enrollment: 5,625)
Evergreen Valley College (about 12 miles; San Jose, CA ; FT enrollment: 5,539)
Public high school in Los Gatos: LOS GATOS HIGH Students: 1,277, Location: 20 HIGH SCH CT., Grades: 9-12)Biggest public elementary/middle schools in Los Gatos: RAYMOND J. FISHER MIDDLE Students: 959, Location: 19195 FISHER AVE., Grades: 6-8)ROLLING HILLS MIDDLE Students: 900, Location: 1585 MORE AVE., Grades: 5-8, Charter school )BLOSSOM HILL ELEMENTARY Students: 372, Location: 16400 BLOSSOM HILL RD., Grades: KG-5)DAVES AVENUE ELEMENTARY Students: 361, Location: 17770 DAVES AVE., Grades: KG-5)LOUISE VAN METER ELEMENTARY Students: 337, Location: 16445 LOS GATOS BLVD., Grades: KG-5)ALTA VISTA ELEMENTARY Students: 320, Location: 200 BLOSSOM VALLEY RD., Grades: KG-5)LOMA PRIETA ELEMENTARY Students: 174, Location: 23800 SUMMIT RD., Grades: KG-5)C. T. ENGLISH MIDDLE Students: 151, Location: 23800 SUMMIT RD., Grades: 6-8)LEXINGTON ELEMENTARY Students: 108, Location: 17010 ROBERTS RD., Grades: KG-5)LAKESIDE ELEMENTARY Location: 19621 BLACK RD., Grades: KG-5)
Private elementary/middle schools in Los Gatos: LOS GATOS CHRISTIAN SCHOOL Students: 356, Location: 16845 HICKS RD, Grades: PK-8)
HILLBROOK SCHOOL Students: 322, Location: 300 MARCHMONT DR, Grades: PK-8)
ST MARY'S ELEMENTARY SCHOOL Students: 292, Location: 30 LYNDON AVE, Grades: KG-8)
MULBERRY SCHOOL Students: 202, Location: 220 BELGATOS RD, Grades: PK-5)
YAVNEH DAY SCHOOL Students: 172, Location: 14855 OKA RD STE 100, Grades: KG-8)
RAINBOW OF KNOWLEDGE ELEMENTARY SCHOOL Students: 20, Location: 15080 LOS GATOS BLVD, Grades: PK-6)
See full list of schools located in Los Gatos Libraries in Los Gatos: SANTA CLARA COUNTY LIBRARY Operating income: $32,661,875; Location: 14600 WINCHESTER BLVD.; 1,411,125 books ; 4,947 e-books ; 138,160 audio materials ; 185,240 video materials ; 91 local licensed databases ; 2,459 print serial subscriptions ; 7 electronic serial subscriptions )
LOS GATOS PUBLIC LIBRARY Operating income: $1,658,480; Location: 110 E. MAIN ST.; 125,401 books ; 9,931 e-books ; 8,911 audio materials ; 7,920 video materials ; 40 other licensed databases ; 222 print serial subscriptions ; 3 electronic serial subscriptions )
User-submitted facts and corrections:
another Los Gatos zip code is: 95032
Calvary Baptist Church 16330 Los Gatos Blvd. Los Gatos, CA 95032
another Los Gatos zip code is: 95032
Notable locations in Los Gatos: (A) , La Rinconada Country Club (B) , Novitiate (C) , Santa Clara County Fire Department Shannon Fire Station (D) , Santa Clara County Fire Department Los Gatos Station (E) , Santa Clara County Fire Department Winchester Station (F) , Los Gatos Public Library (G) , Los Gatos City Hall (H) , Los Gatos Arts and Natural History Museum (I) , California Province of the Society of Jesus Jesuit Center Library (J) . Display/hide their locations on the map
Shopping Centers: (1) , Old Town Los Gatos Shopping Center (2) , Kings Court Shopping Center (3) , Blossom Hill Square Shopping Center (4) , Blossom Hill Shopping Center (5) . Display/hide their locations on the map
Main business address in Los Gatos include: (A) , HI/FN INC (B) , SEMOTUS SOLUTIONS INC (C) , ALPHASMART INC (D) . Display/hide their locations on the map
Churches in Los Gatos include: (A) , Kingdom Hall of Jehovahs Witnesses (B) , Faith Lutheran Church (C) , First Baptist Church (D) , First Methodist Church (E) , Nazarene Chapel (F) , Novitiate of the Sacred Heart (G) , Saint Lukes Episcopal Church (H) , Seventh Day Adventist Church (I) . Display/hide their locations on the map
Reservoirs: (A) , Tisdale Reservoir (B) . Display/hide their locations on the map
Parks in Los Gatos include: (1) , Worcester Park (2) , Helm Field (3) , Oak Meadow Park (4) , Vasona Lake County Park (5) . Display/hide their locations on the map
Hotel:
Courts:
Birthplace of: A. J. Allmendinger - Racing driver, Blair Hull - Investor, Jason Chaffetz - Politician, Adam Bernero - 2005 Major League Baseball player (Atlanta Braves, born : Nov 28, 1976), Jared Allen - 2005 NFL player (Kansas City Chiefs, born : Apr 3, 1982), Mike L. Murphy - Film director and digital artist, Mike Penberthy - Basketball player, Paul Montgomery - Businessman, Sandy Hill (mountaineer) - Mountain climber, Ed Giovanola - Baseball player.
Santa Clara County has a predicted average indoor radon screening level between 2 and 4 pCi/L (pico curies per liter) - Moderate Potential Drinking water stations with addresses in Los Gatos and their reported violations in the past:
LOVEY'S LANDING (Population served: 350, Groundwater):
Past health violations:
MCL, Monthly (TCR) - Between JAN-2010 and MAR-2010, Contaminant: Coliform. Follow-up actions: St Violation/Reminder Notice (MAR-03-2010)
MCL, Monthly (TCR) - Between JAN-2006 and MAR-2006, Contaminant: Coliform. Follow-up actions: St Public Notif requested (MAR-06-2006)
Past monitoring violations:
2 routine major monitoring violations
Population served: 130, Purch surface water):
Past monitoring violations:
Monitoring, Repeat Major (TCR) - In SEP-2007, Contaminant: Coliform (TCR). Follow-up actions: St Violation/Reminder Notice (OCT-17-2007), St Public Notif requested (OCT-17-2007)
Monitoring, Repeat Major (TCR) - In SEP-2007, Contaminant: Coliform (TCR). Follow-up actions: St Violation/Reminder Notice (OCT-17-2007), St Public Notif requested (OCT-17-2007)
2 routine major monitoring violations
Population served: 25, Groundwater):
Past monitoring violations:
10 routine major monitoring violations
Population served: 25, Groundwater):
Past monitoring violations:
Monitoring, Repeat Major (TCR) - Between JUL-2005 and SEP-2005, Contaminant: Coliform (TCR). Follow-up actions: St Violation/Reminder Notice (OCT-27-2005), St Public Notif requested (OCT-27-2005)
Monitoring, Repeat Major (TCR) - Between JUL-2005 and SEP-2005, Contaminant: Coliform (TCR). Follow-up actions: St Violation/Reminder Notice (OCT-27-2005), St Public Notif requested (OCT-27-2005)
11 routine major monitoring violations
Drinking water stations with addresses in Los Gatos that have no violations reported:
COYOTE LAKE COUNTY PARK (Population served: 350, Primary Water Source Type: Groundwater)
ALDERCROFT HEIGHTS COUNTY WATER DISTRICT (Population served: 338, Primary Water Source Type: Surface water)
WALDEN WEST (Population served: 150, Primary Water Source Type: Groundwater)
JOSEPH GRANT COUNTY PARK (Population served: 100, Primary Water Source Type: Groundwater)
SANBORN-SKYLINE COUNTY PARK (Population served: 100, Primary Water Source Type: Groundwater)
BRUSH AND OLD WELL MUTUAL WATER COMPANY (Population served: 70, Primary Water Source Type: Purch surface water)
METCALF MOTORCYCLE COUNTY PARK (Population served: 25, Primary Water Source Type: Groundwater)
SCC ANIMAL SHELTER/AIRPORT (Population served: 25, Primary Water Source Type: Groundwater)
MT. MADONNA COUNTY PARK (Population served: 25, Primary Water Source Type: Groundwater)
UVAS CANYON COUNTY PARK (Population served: 25, Primary Water Source Type: Groundwater)
Average household size: This town:
2.4 peopleCalifornia:
2.9 people
Percentage of family households: This town:
63.1%Whole state:
68.7%
Percentage of households with unmarried partners: This town:
5.1%Whole state:
7.2%
Likely homosexual households (counted as self-reported same-sex unmarried-partner households)
Lesbian couples: 0.4% of all households Gay men: 0.3% of all households
People in group quarters in Los Gatos in 2010:
238 people in nursing facilities/skilled-nursing facilities
72 people in other noninstitutional facilities
20 people in residential treatment centers for juveniles (non-correctional)
7 people in group homes intended for adults
7 people in workers' group living quarters and job corps centers
6 people in residential treatment centers for adults
People in group quarters in Los Gatos in 2000:
553 people in nursing homes
85 people in religious group quarters
44 people in other noninstitutional group quarters
12 people in other nonhousehold living situations
8 people in homes for the mentally retarded
Banks with most branches in Los Gatos (2011 data):
Wells Fargo Bank, National Association: Blossom Hill Branch, Union Avenue Branch, Los Gatos Branch. Info updated 2011/04/05: Bank assets: $1,161,490.0 mil, Deposits: $905,653.0 mil, headquarters in Sioux Falls, SD, positive income , 6395 total offices , Holding Company: Wells Fargo & Company
JPMorgan Chase Bank, National Association: Los Gatos - Los Gatos Blvd, Los Gatos Union Ave Branch, 400 N Santa Cruz Ave Branch. Info updated 2011/11/10: Bank assets: $1,811,678.0 mil, Deposits: $1,190,738.0 mil, headquarters in Columbus, OH, positive income , International Specialization, 5577 total offices , Holding Company: Jpmorgan Chase & Co.
U.S. Bank National Association: Los Gatos Branch at 127 North Santa Cruz, branch established on 1890/01/01; Los Gatos Blossom Hills Branch at 14184 Blossom Hill Rd., branch established on 1957/10/16. Info updated 2012/01/30: Bank assets: $330,470.8 mil, Deposits: $236,091.5 mil, headquarters in Cincinnati, OH, positive income , 3121 total offices , Holding Company: U.S. Bancorp
Bank of America, National Association: East Los Gatos Branch at 780 Blossom Hill Road, branch established on 1963/12/09; Los Gatos Branch at 333 North Santa Cruz Avenue, branch established on 1927/02/19. Info updated 2009/11/18: Bank assets: $1,451,969.3 mil, Deposits: $1,077,176.8 mil, headquarters in Charlotte, NC, positive income , 5782 total offices , Holding Company: Bank Of America Corporation
Heritage Bank of Commerce: Los Gatos Branch at 15575 Los Gatos Boulevard, Building B, branch established on 2003/12/08. Info updated 2007/07/02: Bank assets: $1,303.2 mil, Deposits: $1,073.8 mil, headquarters in San Jose, CA, positive income , Commercial Lending Specialization, 12 total offices , Holding Company: Heritage Commerce Corp
Comerica Bank: Los Gatos Branch at 444 North Santa Cruz Avenue, branch established on 1983/12/14. Info updated 2011/07/29: Bank assets: $60,970.5 mil, Deposits: $48,300.9 mil, headquarters in Dallas, TX, positive income , Commercial Lending Specialization, 497 total offices , Holding Company: Comerica Incorporated
First Republic Bank: Los Gatos Saratoga Branch at 275 Los Gatos Saratoga Rd, branch established on 2009/02/09. Info updated 2010/08/03: Bank assets: $27,791.8 mil, Deposits: $22,459.3 mil, headquarters in San Francisco, CA, positive income , Mortgage Lending Specialization, 60 total offices
Citibank, National Association: Los Gatos Branch at 15879 Los Gatos Boulevard, branch established on 1921/01/01. Info updated 2012/01/10: Bank assets: $1,288,658.0 mil, Deposits: $882,541.0 mil, headquarters in Sioux Falls, SD, positive income , International Specialization, 1048 total offices , Holding Company: Citigroup Inc.
Bank of the West: Los Gatos Branch at 308 North Santa Cruz Avenue, branch established on 1954/02/15. Info updated 2009/11/16: Bank assets: $62,408.3 mil, Deposits: $43,995.2 mil, headquarters in San Francisco, CA, positive income , 647 total offices , Holding Company: Bnp Paribas
For population 15 years and over in Los Gatos:
Never married: 22.7%Now married: 62.0%Separated: 1.8%Widowed: 5.7%Divorced: 7.9% For population 25 years and over in Los Gatos:
High school or higher: 97.6%Bachelor's degree or higher: 74.8%Graduate or professional degree: 36.1%Unemployed: 2.9%Mean travel time to work (commute): 17.6 minutes
Education Gini index (Inequality in education) Here:
8.6California average:
15.5
Religion statistics for Los Gatos, CA (based on Santa Clara County data)
Religion Adherents Congregations Catholic 447,369 56 Evangelical Protestant 148,599 481 Other 125,165 221 Mainline Protestant 44,623 132 Orthodox 7,720 17 Black Protestant 2,552 20 None 1,005,614 -
Source: Clifford Grammich, Kirk Hadaway, Richard Houseal, Dale E.Jones, Alexei Krindatch, Richie Stanley and Richard H.Taylor. 2012. 2010 U.S.Religion Census: Religious Congregations & Membership Study. Association of Statisticians of American Religious Bodies. Jones, Dale E., et al. 2002. Congregations and Membership in the United States 2000. Nashville, TN: Glenmary Research Center. Graphs represent county-level data
Food Environment Statistics: Number of grocery stores : 345Here :
1.99 / 10,000 pop.State :
2.14 / 10,000 pop.
Number of supercenters and club stores : 7Santa Clara County :
0.04 / 10,000 pop.State :
0.04 / 10,000 pop.
Number of convenience stores (no gas) : 117This county :
0.68 / 10,000 pop.California :
0.62 / 10,000 pop.
Number of convenience stores (with gas) : 239This county :
1.38 / 10,000 pop.California :
1.49 / 10,000 pop.
Number of full-service restaurants : 1,488Here :
8.59 / 10,000 pop.California :
7.42 / 10,000 pop.
Adult diabetes rate : This county :
7.1%California :
7.3%
Adult obesity rate : Here :
19.0%California :
21.3%
Low-income preschool obesity rate : Santa Clara County :
16.6%California :
17.9%
Health and Nutrition: Healthy diet rate : Here:
55.8%California:
49.4%
Average overall health of teeth and gums : Los Gatos:
55.3%California:
48.0%
People feeling badly about themselves : This city:
18.3%California:
20.2%
People not drinking alcohol at all : Los Gatos:
9.1%California:
11.2%
Average hours sleeping at night : Los Gatos:
6.9California:
6.8
Overweight people : Los Gatos:
34.2%California:
31.5%
General health condition : Los Gatos:
61.4%California:
56.4%
Average condition of hearing : Los Gatos:
80.6%California:
80.9%
More about Health and Nutrition of Los Gatos, CA Residents
Local government employment and payroll (March 2022)
Function
Full-time employees
Monthly full-time payroll
Average yearly full-time wage
Part-time employees
Monthly part-time payroll
Police Protection - Officers
34 $459,819 $162,289 0 $0 Streets and Highways
34 $326,443 $115,215 7 $16,740 Police - Other
23 $238,226 $124,292 6 $17,123 Housing and Community Development (Local)
19 $183,022 $115,593 1 $3,722 Local Libraries
16 $107,417 $80,563 10 $5,301 Other and Unallocable
11 $80,049 $87,326 2 $2,267 Financial Administration
8 $72,342 $108,513 5 $12,800 Other Government Administration
0 $0 5 $3,155
Totals for Government
145 $1,467,318 $121,433 36 $61,109
Los Gatos government finances - Expenditure in 2017 (per resident):
Construction - Libraries: $7,559,000 ($233.29)
Regular Highways: $3,706,000 ($114.38)Parks and Recreation: $1,518,000 ($46.85)Housing and Community Development: $597,000 ($18.42)Current Operations - Police Protection: $13,251,000 ($408.96)
Central Staff Services: $10,062,000 ($310.54)Protective Inspection and Regulation - Other: $4,279,000 ($132.06)Regular Highways: $3,190,000 ($98.45)Libraries: $2,509,000 ($77.43)Parks and Recreation: $1,739,000 ($53.67)Financial Administration: $1,098,000 ($33.89)General - Interest on Debt: $1,020,000 ($31.48)
Intergovernmental to Local - Other - Health - Other: $215,000 ($6.64)
Other - General - Other: $214,000 ($6.60)Other Capital Outlay - Central Staff Services: $86,000 ($2.65)
Police Protection: $53,000 ($1.64)
Los Gatos government finances - Revenue in 2017 (per resident):
Charges - Other: $2,970,000 ($91.66)
Regular Highways: $620,000 ($19.13)Parks and Recreation: $44,000 ($1.36)Federal Intergovernmental - Other: $15,000 ($0.46)
Local Intergovernmental - Other: $30,000 ($0.93)
Miscellaneous - Fines and Forfeits: $881,000 ($27.19)
General Revenue - Other: $831,000 ($25.65)Special Assessments: $766,000 ($23.64)Donations From Private Sources: $216,000 ($6.67)Interest Earnings: $193,000 ($5.96)Rents: $32,000 ($0.99)Sale of Property: $4,000 ($0.12)State Intergovernmental - Other: $1,052,000 ($32.47)
Highways: $605,000 ($18.67)General Local Government Support: $48,000 ($1.48)Tax - Property: $14,092,000 ($434.91)
General Sales and Gross Receipts: $8,799,000 ($271.56)Other License: $3,205,000 ($98.91)Public Utilities Sales: $2,367,000 ($73.05)Other Selective Sales: $2,323,000 ($71.69)Occupation and Business License - Other: $1,721,000 ($53.11)Documentary and Stock Transfer: $630,000 ($19.44)Other: $28,000 ($0.86)
Los Gatos government finances - Debt in 2017 (per resident):
Long Term Debt - Beginning Outstanding - Unspecified Public Purpose: $25,488,000 ($786.62)
Outstanding Unspecified Public Purpose: $24,554,000 ($757.79)Retired Unspecified Public Purpose: $934,000 ($28.83)
Los Gatos government finances - Cash and Securities in 2017 (per resident):
Bond Funds - Cash and Securities: $27,666,000 ($853.84)
Other Funds - Cash and Securities: $36,446,000 ($1124.81)
5.37% of this county's 2021 resident taxpayers lived in other counties in 2020 ($152,550 average adjusted gross income )
Here:
5.37%California average:
5.19%
0.01% of residents moved from foreign countries ($93 average AGI )Santa Clara County:
0.01%California average:
0.03%
Top counties from which taxpayers relocated into this county between 2020 and 2021:
7.70% of this county's 2020 resident taxpayers moved to other counties in 2021 ($201,706 average adjusted gross income )
Here:
7.70%California average:
6.14%
0.01% of residents moved to foreign countries ($110 average AGI )Santa Clara County:
0.01%California average:
0.02%
Top counties to which taxpayers relocated from this county between 2020 and 2021:
Businesses in Los Gatos, CA
Name Count Name Count
7-Eleven 2 McDonald's 1 AT&T 1 New Balance 4 Ace Hardware 2 Nike 5 Apple Store 1 Office Depot 1 Banana Republic 1 Pier 1 Imports 1 Baskin-Robbins 2 RadioShack 1 Bentleymotors.Com 1 Rite Aid 1 Big O Tires 1 Safeway 2 CVS 2 Starbucks 3 Chico's 1 Subway 2 FedEx 9 T-Mobile 1 GNC 1 Taco Bell 1 Gap 2 Talbots 1 Goodwill 1 Trader Joe's 1 Gymboree 1 U-Haul 2 H&R Block 1 UPS 7 J.Crew 1 Vans 1 Jamba Juice 1 Vons 3 JoS. A. Bank 1 Walgreens 2 KFC 1 Whole Foods Market 1 MasterBrand Cabinets 5
Strongest AM radio stations in Los Gatos:
KLOK (1170 AM; 50 kW; SAN JOSE, CA; Owner: ENTRAVISION HOLDINGS, LLC)
KGO (810 AM; 50 kW; SAN FRANCISCO, CA; Owner: KGO-AM RADIO, INC.)
KNBR (680 AM; 50 kW; SAN FRANCISCO, CA; Owner: KNBR LICO, INC.)
KSJX (1500 AM; 10 kW; SAN JOSE, CA; Owner: MULTICULTURAL RADIO BROADCASTING INC)
KTCT (1050 AM; 50 kW; SAN MATEO, CA; Owner: SUSQUEHANNA RADIO CORP.)
KFAX (1100 AM; 50 kW; SAN FRANCISCO, CA; Owner: GOLDEN GATE BROADCASTING CO, INC.)
KYCY (1550 AM; 50 kW; SAN FRANCISCO, CA; Owner: INFINITY BROADCASTING OPERATIONS, INC.)
KLIV (1590 AM; 5 kW; SAN JOSE, CA; Owner: EMPIRE BROADCASTING COMPANY)
KZSF (1370 AM; 5 kW; SAN JOSE, CA; Owner: CARLOS A. DUHARTE)
KTRB (860 AM; 50 kW; MODESTO, CA; Owner: PAPPAS RADIO OF CALIFORNIA, A CALIFORNIA LIMITED PARTNERSHIP)
KSCO (1080 AM; 10 kW; SANTA CRUZ, CA)
KVVN (1430 AM; 2 kW; SANTA CLARA, CA; Owner: ICBC BROADCAST HOLDINGS - CA, INC.)
KIQI (1010 AM; 35 kW; SAN FRANCISCO, CA; Owner: RADIO UNICA OF SAN FRANCISCO LICENSE CORP.)
Strongest FM radio stations in Los Gatos:
KUFX (98.5 FM; SAN JOSE, CA; Owner: CITICASTERS LICENSES, L.P.)
KRTY (95.3 FM; LOS GATOS, CA; Owner: KRTY, LTD.)
KBAA (94.5 FM; GILROY, CA; Owner: INFINITY RADIO OPERATIONS INC.)
KSQL (99.1 FM; SANTA CRUZ, CA; Owner: TMS LICENSE CALIFORNIA, INC)
KKUP (91.5 FM; CUPERTINO, CA; Owner: ASSURANCE SCIENCES FOUNDATION)
KBRG (100.3 FM; SAN JOSE, CA; Owner: ENTRAVISION HOLDINGS, LLC)
KFJC (89.7 FM; LOS ALTOS, CA; Owner: FOOTHILL-DE ANZA COMM. COLLEGE DIST.)
KTEE (93.7 FM; FELTON, CA; Owner: MAPLETON COMMUNICATIONS, L.L.C.)
K240CD (95.9 FM; SOQUEL, ETC., CA; Owner: CALVARY CHAPEL OF TWIN FALLS, INC.)
K216AX (91.1 FM; LAUREL, CA; Owner: CALVARY CHAPEL OF TWIN FALLS, INC.)
KFFG (97.7 FM; LOS ALTOS, CA; Owner: KFFG LICO, INC.)
KSJS (90.5 FM; SAN JOSE, CA; Owner: SAN JOSE STATE UNIVERSITY)
KEZR (106.5 FM; SAN JOSE, CA; Owner: INFINITY RADIO OF SAN JOSE, INC.)
K238AC (95.5 FM; SALIDA, CA; Owner: FAMILY STATIONS, INC.)
KKSF-FM1 (103.7 FM; PLEASANTON, ETC., CA; Owner: AMFM RADIO LICENSES, L.L.C.)
KZBR-FM2 (95.7 FM; LIVERMORE, ETC., CA; Owner: BONNEVILLE HOLDING COMPANY)
KSJO (92.3 FM; SAN JOSE, CA; Owner: CITICASTERS LICENSES, L.P.)
KFRC-FM3 (99.7 FM; WALNUT CREEK, CA; Owner: INFINITY KFRC-FM, INC.)
KZBR-FM1 (95.7 FM; WALNUT CREEK, CA; Owner: BONNEVILLE HOLDING COMPANY)
KBLX-FM2 (102.9 FM; PLEASANTON, CA; Owner: ICBC BROADCAST HOLDINGS -CA, INC.)
TV broadcast stations around Los Gatos:
KNTV (Channel 11; SAN JOSE, CA; Owner: KNTV LICENSE, INC.)
KQED (Channel 9; SAN FRANCISCO, CA; Owner: KQED, INC.)
KBIT-CA (Channel 28; SAN FRANCISCO, ETC., CA; Owner: POLAR BROADCASTING, INC.)
KKPX (Channel 65; SAN JOSE, CA; Owner: PAXSON SAN JOSE LICENSE, INC.)
KICU-TV (Channel 36; SAN JOSE, CA; Owner: KTVU PARTNERSHIP)
KTEH (Channel 54; SAN JOSE, CA; Owner: KTEH FOUNDATION)
KDTV (Channel 14; SAN FRANCISCO, CA; Owner: KDTV LICENSE PARTNERSHIP, G.P.)
KSTS (Channel 48; SAN JOSE, CA; Owner: TELEMUNDO OF NORTHERN CALIFORNIA LICENSE CORP.)
KAXT-CA (Channel 22; SANTA CLARA-SAN JOSE, CA; Owner: LINDA K. TRUMBLY)
KTEH1 (Channel 54; SANTA CRUZ, CA; Owner: KTEH FOUNDATION)
National Bridge Inventory (NBI) Statistics 68 Number of bridges846ft / 258m Total length $1,670,000 Total costs2,646,711 Total average daily traffic95,913 Total average daily truck traffic
New bridges - historical statistics
1 1940-1949 14 1950-1959 3 1960-1969 1 1970-1979 48 1990-1999 1 2010-2019
See full National Bridge Inventory statistics for Los Gatos, CA
Home Mortgage Disclosure Act Aggregated Statistics For Year 2009(Based on 2 full and 7 partial tracts) A) FHA, FSA/RHS & VA B) Conventional C) Refinancings D) Home Improvement Loans E) Loans on Dwellings For 5+ Families F) Non-occupant Loans on G) Loans On Manufactured Number Average Value Number Average Value Number Average Value Number Average Value Number Average Value Number Average Value Number Average Value
LOANS ORIGINATED 17 $583,955 243 $668,638 1,359 $473,080 37 $323,171 3 $2,382,000 53 $412,046 0 $0 APPLICATIONS APPROVED, NOT ACCEPTED 2 $701,720 47 $653,846 127 $488,314 8 $460,755 0 $0 6 $296,163 1 $174,440 APPLICATIONS DENIED 5 $607,326 55 $671,849 265 $605,409 11 $587,151 1 $2,483,900 16 $454,439 4 $211,265 APPLICATIONS WITHDRAWN 3 $556,990 26 $691,304 157 $547,416 6 $366,925 0 $0 5 $422,096 0 $0 FILES CLOSED FOR INCOMPLETENESS 1 $589,500 5 $563,406 54 $522,464 5 $530,030 0 $0 3 $538,400 1 $188,970
Aggregated Statistics For Year 2008(Based on 2 full and 7 partial tracts) A) FHA, FSA/RHS & VA B) Conventional C) Refinancings D) Home Improvement Loans E) Loans on Dwellings For 5+ Families F) Non-occupant Loans on G) Loans On Manufactured Number Average Value Number Average Value Number Average Value Number Average Value Number Average Value Number Average Value Number Average Value
LOANS ORIGINATED 2 $641,155 236 $763,717 498 $580,040 29 $339,777 2 $776,180 32 $531,185 2 $146,820 APPLICATIONS APPROVED, NOT ACCEPTED 0 $0 58 $776,046 105 $610,809 6 $479,113 0 $0 10 $388,061 2 $162,115 APPLICATIONS DENIED 0 $0 70 $787,517 198 $721,478 19 $542,711 1 $346,850 19 $539,738 9 $223,369 APPLICATIONS WITHDRAWN 1 $522,940 36 $782,364 115 $663,517 11 $385,921 2 $2,389,725 6 $648,647 0 $0 FILES CLOSED FOR INCOMPLETENESS 0 $0 10 $675,777 27 $635,804 4 $170,780 0 $0 3 $438,200 0 $0
Aggregated Statistics For Year 2007(Based on 2 full and 7 partial tracts) B) Conventional C) Refinancings D) Home Improvement Loans E) Loans on Dwellings For 5+ Families F) Non-occupant Loans on G) Loans On Manufactured Number Average Value Number Average Value Number Average Value Number Average Value Number Average Value Number Average Value
LOANS ORIGINATED 366 $810,745 647 $682,116 62 $509,826 12 $2,009,657 70 $598,574 5 $115,532 APPLICATIONS APPROVED, NOT ACCEPTED 97 $756,353 136 $723,735 15 $233,670 0 $0 16 $688,184 10 $194,838 APPLICATIONS DENIED 98 $746,647 246 $878,284 26 $634,957 3 $762,453 29 $544,799 15 $202,557 APPLICATIONS WITHDRAWN 35 $893,707 110 $780,321 8 $776,301 1 $2,801,160 11 $980,711 0 $0 FILES CLOSED FOR INCOMPLETENESS 9 $1,010,348 40 $754,150 3 $259,557 0 $0 2 $640,100 0 $0
Aggregated Statistics For Year 2006(Based on 2 full and 7 partial tracts) A) FHA, FSA/RHS & VA B) Conventional C) Refinancings D) Home Improvement Loans E) Loans on Dwellings For 5+ Families F) Non-occupant Loans on G) Loans On Manufactured Number Average Value Number Average Value Number Average Value Number Average Value Number Average Value Number Average Value Number Average Value
LOANS ORIGINATED 0 $0 418 $731,072 711 $659,671 75 $474,789 6 $1,193,557 78 $582,154 2 $107,570 APPLICATIONS APPROVED, NOT ACCEPTED 0 $0 97 $621,429 137 $585,106 16 $379,301 0 $0 22 $512,576 4 $180,918 APPLICATIONS DENIED 0 $0 96 $799,101 209 $779,455 32 $454,784 0 $0 27 $654,781 7 $157,824 APPLICATIONS WITHDRAWN 1 $198,800 50 $816,614 148 $644,181 10 $415,586 0 $0 9 $652,972 0 $0 FILES CLOSED FOR INCOMPLETENESS 0 $0 11 $666,551 30 $601,183 3 $189,260 0 $0 3 $514,670 0 $0
Aggregated Statistics For Year 2005(Based on 2 full and 7 partial tracts) A) FHA, FSA/RHS & VA B) Conventional C) Refinancings D) Home Improvement Loans E) Loans on Dwellings For 5+ Families F) Non-occupant Loans on G) Loans On Manufactured Number Average Value Number Average Value Number Average Value Number Average Value Number Average Value Number Average Value Number Average Value
LOANS ORIGINATED 0 $0 535 $709,289 923 $614,476 76 $502,695 9 $1,982,929 89 $533,597 4 $123,560 APPLICATIONS APPROVED, NOT ACCEPTED 0 $0 82 $663,260 130 $675,374 11 $497,895 0 $0 10 $359,672 4 $88,445 APPLICATIONS DENIED 0 $0 117 $701,440 245 $723,853 26 $475,739 0 $0 31 $630,521 6 $99,953 APPLICATIONS WITHDRAWN 1 $198,800 60 $632,695 170 $557,258 17 $436,269 0 $0 14 $500,356 0 $0 FILES CLOSED FOR INCOMPLETENESS 0 $0 16 $610,931 52 $660,836 4 $984,805 0 $0 3 $573,247 0 $0
Aggregated Statistics For Year 2004(Based on 2 full and 7 partial tracts) B) Conventional C) Refinancings D) Home Improvement Loans E) Loans on Dwellings For 5+ Families F) Non-occupant Loans on G) Loans On Manufactured Number Average Value Number Average Value Number Average Value Number Average Value Number Average Value Number Average Value
LOANS ORIGINATED 603 $645,027 1,290 $549,562 45 $377,398 6 $1,454,240 102 $432,112 1 $123,080 APPLICATIONS APPROVED, NOT ACCEPTED 97 $670,201 179 $555,575 12 $203,737 0 $0 14 $376,236 2 $80,715 APPLICATIONS DENIED 108 $621,335 285 $631,121 28 $466,670 2 $798,640 28 $623,069 5 $107,710 APPLICATIONS WITHDRAWN 67 $643,653 245 $586,585 10 $269,453 1 $9,983,000 15 $376,317 0 $0 FILES CLOSED FOR INCOMPLETENESS 14 $550,918 42 $620,421 3 $173,773 0 $0 3 $511,787 0 $0
Aggregated Statistics For Year 2003(Based on 2 full and 7 partial tracts) A) FHA, FSA/RHS & VA B) Conventional C) Refinancings D) Home Improvement Loans E) Loans on Dwellings For 5+ Families F) Non-occupant Loans on Number Average Value Number Average Value Number Average Value Number Average Value Number Average Value Number Average Value
LOANS ORIGINATED 0 $0 451 $551,064 3,236 $438,678 12 $108,598 6 $1,714,510 177 $335,665 APPLICATIONS APPROVED, NOT ACCEPTED 1 $106,410 59 $550,230 428 $431,542 4 $283,352 0 $0 28 $315,876 APPLICATIONS DENIED 0 $0 66 $520,162 404 $542,513 9 $61,673 1 $349,400 30 $448,321 APPLICATIONS WITHDRAWN 0 $0 38 $575,277 372 $388,035 6 $49,627 0 $0 15 $317,848 FILES CLOSED FOR INCOMPLETENESS 0 $0 12 $562,945 105 $540,811 3 $96,883 0 $0 5 $384,190
Aggregated Statistics For Year 2002(Based on 2 full and 5 partial tracts) A) FHA, FSA/RHS & VA B) Conventional C) Refinancings D) Home Improvement Loans E) Loans on Dwellings For 5+ Families F) Non-occupant Loans on Number Average Value Number Average Value Number Average Value Number Average Value Number Average Value Number Average Value
LOANS ORIGINATED 0 $0 438 $482,423 2,323 $430,641 21 $108,785 3 $1,341,020 115 $342,721 APPLICATIONS APPROVED, NOT ACCEPTED 2 $50,695 50 $506,519 313 $433,323 7 $215,899 0 $0 10 $323,106 APPLICATIONS DENIED 0 $0 44 $452,881 244 $450,641 16 $101,306 0 $0 16 $369,108 APPLICATIONS WITHDRAWN 0 $0 41 $376,534 274 $410,379 6 $74,320 0 $0 19 $345,935 FILES CLOSED FOR INCOMPLETENESS 0 $0 14 $466,580 82 $500,997 0 $0 0 $0 5 $266,252
Aggregated Statistics For Year 2001(Based on 2 full and 5 partial tracts) B) Conventional C) Refinancings D) Home Improvement Loans E) Loans on Dwellings For 5+ Families F) Non-occupant Loans on Number Average Value Number Average Value Number Average Value Number Average Value Number Average Value
LOANS ORIGINATED 302 $476,062 1,410 $431,045 85 $87,012 3 $1,239,347 78 $324,998 APPLICATIONS APPROVED, NOT ACCEPTED 67 $501,685 198 $422,963 12 $104,893 0 $0 13 $265,058 APPLICATIONS DENIED 52 $504,265 218 $510,240 18 $101,810 0 $0 21 $539,752 APPLICATIONS WITHDRAWN 42 $453,684 182 $414,750 12 $120,839 1 $279,520 8 $297,416 FILES CLOSED FOR INCOMPLETENESS 12 $460,638 91 $432,667 1 $128,550 3 $1,420,820 0 $0
Aggregated Statistics For Year 2000(Based on 2 full and 5 partial tracts) A) FHA, FSA/RHS & VA B) Conventional C) Refinancings D) Home Improvement Loans E) Loans on Dwellings For 5+ Families F) Non-occupant Loans on Number Average Value Number Average Value Number Average Value Number Average Value Number Average Value Number Average Value
LOANS ORIGINATED 1 $169,590 413 $487,315 310 $369,918 70 $90,714 3 $1,615,927 48 $352,520 APPLICATIONS APPROVED, NOT ACCEPTED 0 $0 53 $443,877 50 $323,958 11 $85,120 0 $0 2 $273,565 APPLICATIONS DENIED 1 $127,230 68 $437,094 93 $367,101 15 $92,087 0 $0 10 $443,602 APPLICATIONS WITHDRAWN 0 $0 48 $468,848 65 $288,661 9 $108,106 0 $0 7 $305,414 FILES CLOSED FOR INCOMPLETENESS 0 $0 12 $587,104 47 $282,285 5 $155,446 1 $2,458,110 1 $209,630
Aggregated Statistics For Year 1999(Based on 2 full and 6 partial tracts) A) FHA, FSA/RHS & VA B) Conventional C) Refinancings D) Home Improvement Loans E) Loans on Dwellings For 5+ Families F) Non-occupant Loans on Number Average Value Number Average Value Number Average Value Number Average Value Number Average Value Number Average Value
LOANS ORIGINATED 0 $0 582 $403,298 905 $356,144 99 $72,157 7 $2,770,093 75 $256,115 APPLICATIONS APPROVED, NOT ACCEPTED 1 $126,330 93 $398,530 192 $350,987 12 $108,738 0 $0 10 $226,832 APPLICATIONS DENIED 0 $0 94 $406,555 200 $379,996 17 $46,778 1 $5,586,240 21 $322,598 APPLICATIONS WITHDRAWN 0 $0 87 $385,135 145 $291,419 5 $111,650 0 $0 9 $267,714 FILES CLOSED FOR INCOMPLETENESS 0 $0 16 $660,433 59 $341,028 3 $85,950 0 $0 3 $508,730
Detailed mortgage data for all 9 tracts in Los Gatos, CA
Private Mortgage Insurance Companies Aggregated Statistics For Year 2009(Based on 1 full and 6 partial tracts) A) Conventional B) Refinancings Number Average Value Number Average Value
LOANS ORIGINATED 1 $692,360 2 $355,215 APPLICATIONS APPROVED, NOT ACCEPTED 2 $391,820 0 $0 APPLICATIONS DENIED 1 $261,660 0 $0 APPLICATIONS WITHDRAWN 0 $0 1 $509,220 FILES CLOSED FOR INCOMPLETENESS 0 $0 0 $0
Aggregated Statistics For Year 2008(Based on 1 full and 4 partial tracts) A) Conventional Number Average Value
LOANS ORIGINATED 5 $613,106 APPLICATIONS APPROVED, NOT ACCEPTED 2 $436,660 APPLICATIONS DENIED 0 $0 APPLICATIONS WITHDRAWN 0 $0 FILES CLOSED FOR INCOMPLETENESS 0 $0
Aggregated Statistics For Year 2007(Based on 1 full and 4 partial tracts) A) Conventional B) Refinancings Number Average Value Number Average Value
LOANS ORIGINATED 1 $450,520 4 $486,445 APPLICATIONS APPROVED, NOT ACCEPTED 0 $0 0 $0 APPLICATIONS DENIED 0 $0 0 $0 APPLICATIONS WITHDRAWN 0 $0 0 $0 FILES CLOSED FOR INCOMPLETENESS 0 $0 0 $0
Aggregated Statistics For Year 2006(Based on 1 full and 1 partial tracts) A) Conventional Number Average Value
LOANS ORIGINATED 2 $733,680 APPLICATIONS APPROVED, NOT ACCEPTED 0 $0 APPLICATIONS DENIED 0 $0 APPLICATIONS WITHDRAWN 0 $0 FILES CLOSED FOR INCOMPLETENESS 0 $0
Aggregated Statistics For Year 2005(Based on 4 partial tracts) A) Conventional B) Refinancings Number Average Value Number Average Value
LOANS ORIGINATED 0 $0 1 $522,650 APPLICATIONS APPROVED, NOT ACCEPTED 1 $108,500 0 $0 APPLICATIONS DENIED 0 $0 0 $0 APPLICATIONS WITHDRAWN 0 $0 0 $0 FILES CLOSED FOR INCOMPLETENESS 0 $0 0 $0
Aggregated Statistics For Year 2004(Based on 1 full and 4 partial tracts) A) Conventional B) Refinancings C) Non-occupant Loans on Number Average Value Number Average Value Number Average Value
LOANS ORIGINATED 1 $579,380 2 $508,775 0 $0 APPLICATIONS APPROVED, NOT ACCEPTED 1 $468,440 0 $0 1 $468,440 APPLICATIONS DENIED 0 $0 0 $0 0 $0 APPLICATIONS WITHDRAWN 0 $0 0 $0 0 $0 FILES CLOSED FOR INCOMPLETENESS 0 $0 0 $0 0 $0
Aggregated Statistics For Year 2003(Based on 5 partial tracts) A) Conventional B) Refinancings C) Non-occupant Loans on Number Average Value Number Average Value Number Average Value
LOANS ORIGINATED 4 $337,378 1 $570,020 0 $0 APPLICATIONS APPROVED, NOT ACCEPTED 2 $282,025 0 $0 1 $137,320 APPLICATIONS DENIED 0 $0 0 $0 0 $0 APPLICATIONS WITHDRAWN 0 $0 0 $0 0 $0 FILES CLOSED FOR INCOMPLETENESS 0 $0 0 $0 0 $0
Aggregated Statistics For Year 2002(Based on 1 full and 4 partial tracts) A) Conventional B) Refinancings Number Average Value Number Average Value
LOANS ORIGINATED 7 $404,009 1 $248,780 APPLICATIONS APPROVED, NOT ACCEPTED 2 $319,805 1 $527,800 APPLICATIONS DENIED 0 $0 0 $0 APPLICATIONS WITHDRAWN 0 $0 0 $0 FILES CLOSED FOR INCOMPLETENESS 1 $268,100 0 $0
Aggregated Statistics For Year 2001(Based on 1 full and 3 partial tracts) A) Conventional C) Non-occupant Loans on Number Average Value Number Average Value
LOANS ORIGINATED 5 $478,582 0 $0 APPLICATIONS APPROVED, NOT ACCEPTED 5 $324,052 1 $267,570 APPLICATIONS DENIED 0 $0 0 $0 APPLICATIONS WITHDRAWN 0 $0 0 $0 FILES CLOSED FOR INCOMPLETENESS 0 $0 0 $0
Aggregated Statistics For Year 2000(Based on 2 full and 5 partial tracts) A) Conventional B) Refinancings C) Non-occupant Loans on Number Average Value Number Average Value Number Average Value
LOANS ORIGINATED 16 $330,441 5 $361,072 2 $196,755 APPLICATIONS APPROVED, NOT ACCEPTED 3 $455,203 0 $0 0 $0 APPLICATIONS DENIED 0 $0 0 $0 0 $0 APPLICATIONS WITHDRAWN 0 $0 0 $0 0 $0 FILES CLOSED FOR INCOMPLETENESS 0 $0 0 $0 0 $0
Aggregated Statistics For Year 1999(Based on 1 full and 6 partial tracts) A) Conventional B) Refinancings Number Average Value Number Average Value
LOANS ORIGINATED 22 $343,410 2 $309,320 APPLICATIONS APPROVED, NOT ACCEPTED 3 $470,743 1 $237,340 APPLICATIONS DENIED 1 $367,250 0 $0 APPLICATIONS WITHDRAWN 1 $289,750 0 $0 FILES CLOSED FOR INCOMPLETENESS 0 $0 0 $0
Fire-safe hotels and motels in Los Gatos, California:
Toll House Hotel, 140 S Santa Cruz Ave, Los Gatos, California 95030 Phone: (408) 395-7070, Fax: (408) 395-3730
Best Western The Inn of Los Gatos, 55 Los Gatos - Saratoga Rd, Los Gatos, California 95032 Phone: (408) 356-9191
All 2 fire-safe hotels and motels in Los Gatos, California
Most common first names in Los Gatos, CA among deceased individuals Name Count Lived (average)
John 286 75.4 years Mary 229 82.9 years Robert 211 72.6 years William 205 77.0 years James 147 74.5 years Margaret 139 80.4 years George 132 79.6 years Joseph 131 77.7 years Dorothy 128 80.1 years Ruth 125 82.6 years
Most common last names in Los Gatos, CA among deceased individuals Last name Count Lived (average)
Smith 97 79.6 years Johnson 73 80.0 years Brown 52 77.0 years Miller 44 79.3 years Williams 42 78.6 years Wilson 36 83.1 years Jones 36 76.0 years Anderson 36 79.5 years Davis 32 81.0 years White 28 79.7 years
Los Gatos compared to California state average:
Median household income above state average. Median house value significantly above state average. Unemployed percentage significantly below state average. Black race population percentage significantly below state average. Hispanic race population percentage significantly below state average. Median age significantly above state average. Length of stay since moving in significantly above state average. Percentage of population with a bachelor's degree or higher significantly above state average.
#10 on the list of "Top 100 cities with highest median house value"
#30 on the list of "Top 101 cities with largest percentage of males in occupations: management occupations (population 5,000+)"
#74 on the list of "Top 101 cities with the highest cost per building permit(population 5,000+)"
#76 on the list of "Top 101 cities with the most local government spending on highway construction per resident (population 10,000+)"
#79 on the list of "Top 101 cities with largest percentage of females in industries: professional, scientific, and technical services (population 5,000+)"
#90 on the list of "Top 101 cities with largest percentage of males in industries: professional, scientific, and technical services (population 5,000+)"
#101 on the list of "Top 101 cities with largest percentage of females in occupations: construction and extraction occupations (population 5,000+)"
#15 (95030) on the list of "Top 101 zip codes with the highest average reported salary/wage in 2012 (pop 5,000+)"
#20 (95030) on the list of "Top 101 zip codes with the highest 2012 average reported profit/loss from business (pop 5,000+)"
#41 (95030) on the list of "Top 101 zip codes with the largest percentage of taxpayers reporting net capital gain/loss in 2012 (pop 5,000+)"
#51 (95030) on the list of "Top 101 zip codes with the highest 2012 average Adjusted Gross Income (AGI) for individuals (pop 5,000+)"
#5 on the list of "Top 101 counties with the highest percentage of residents that visited a dentist within the past year"
#9 on the list of "Top 101 counties with the lowest percentage of residents that smoked 100+ cigarettes in their lives"
#16 on the list of "Top 101 counties with the most Other adherents"
#16 on the list of "Top 101 counties with the most Catholic adherents"
#17 on the list of "Top 101 counties with the highest percentage of residents that drank alcohol in the past 30 days"
Top Patent Applicants
Charles Abraham (146)
William H. Radke (97)
Matthew Lee Rogers (92)
Nima Mokhlesi (89)
Tarik Tabet (81)
Yan Xun Xue (76)
Pantas Sutardja (74)
Ru-Ying Tong (70)
Cullen E. Bash (69)
Chris Kalaboukis (67)
Total of 10987 patent applications in 2008-2024.


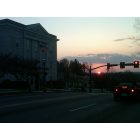


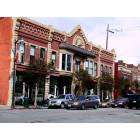

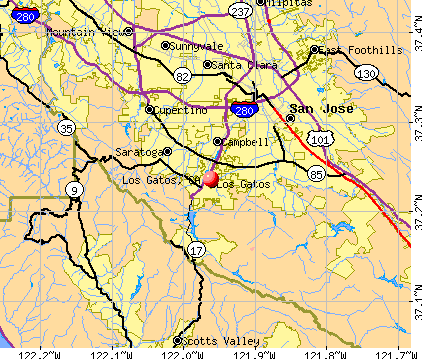


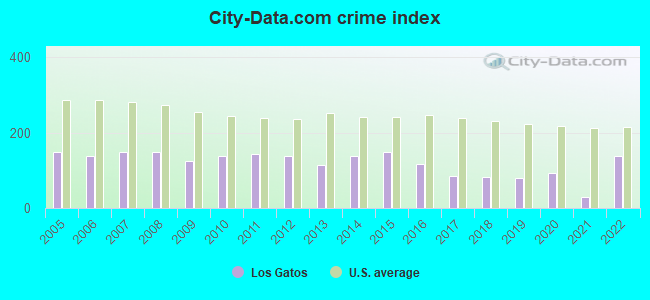
 Recent articles from our blog. Our writers, many of them Ph.D. graduates or candidates, create easy-to-read articles on a wide variety of topics.

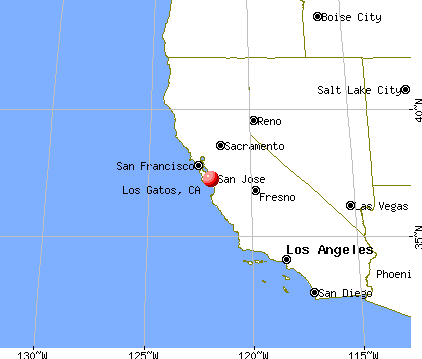
 (6.8 miles
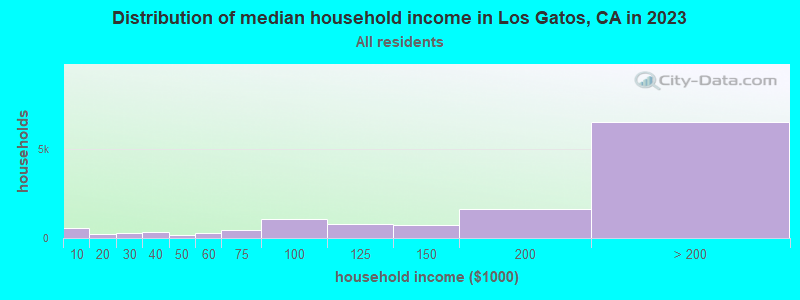
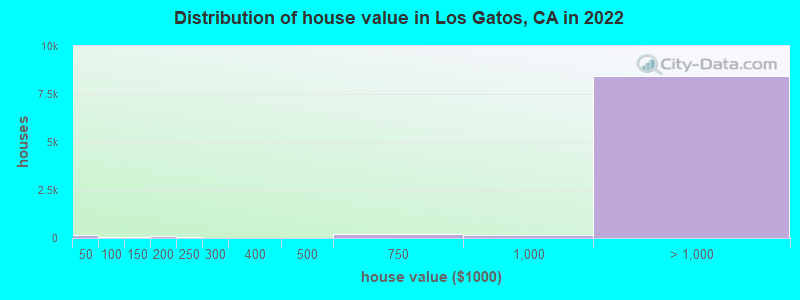
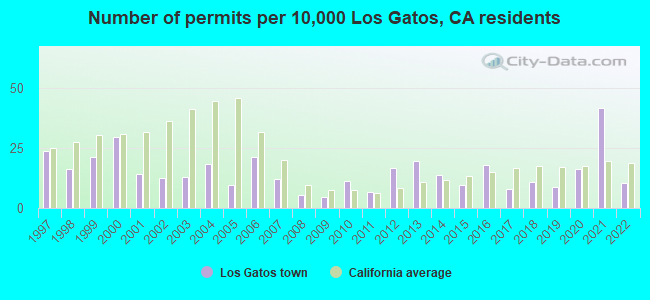
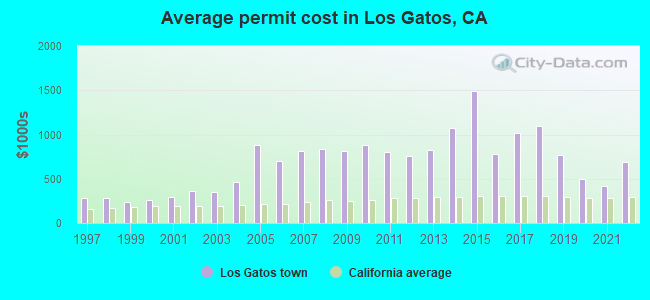
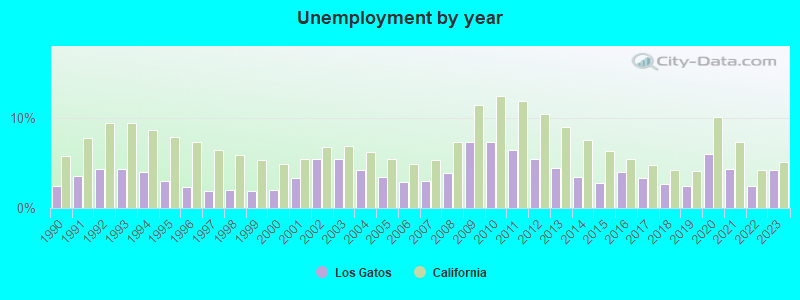
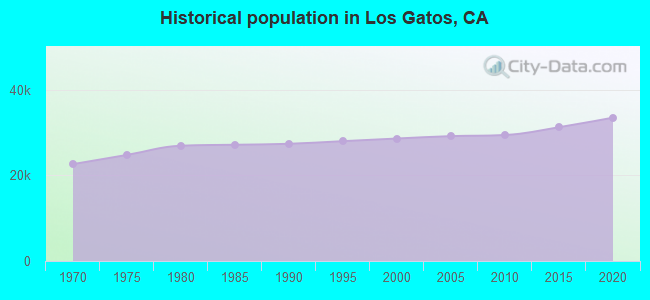
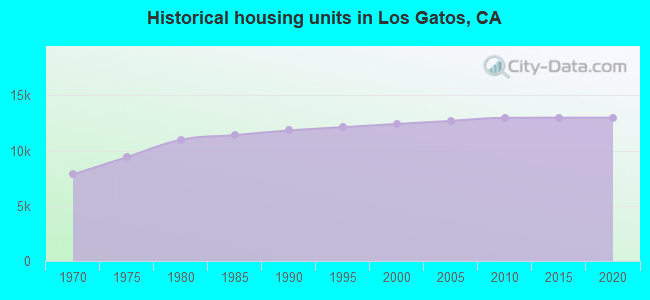
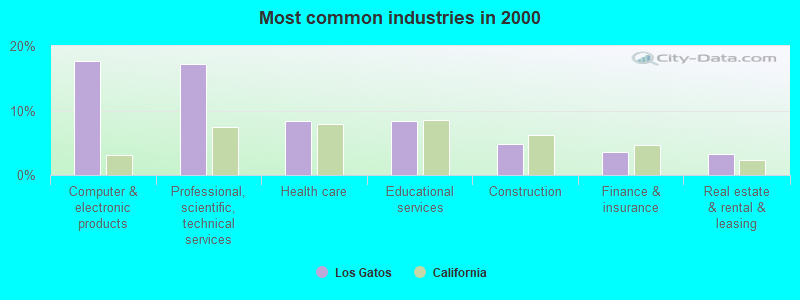
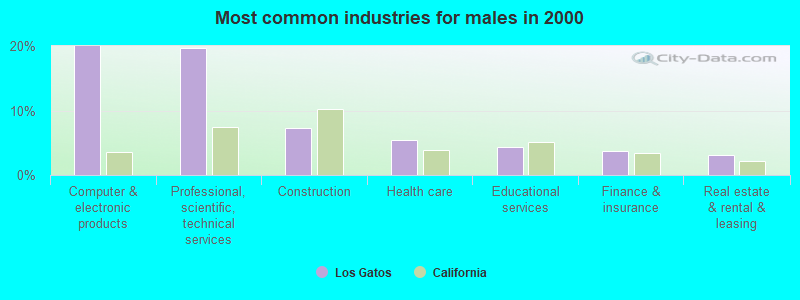
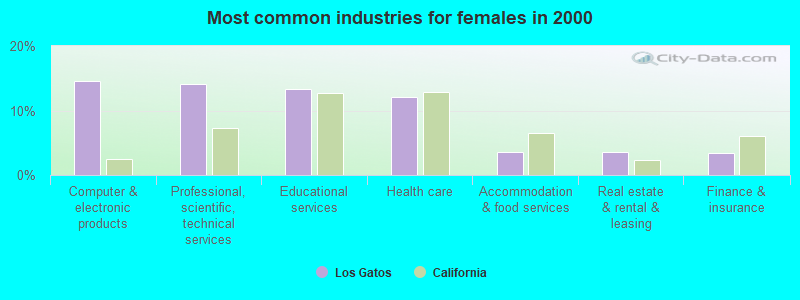
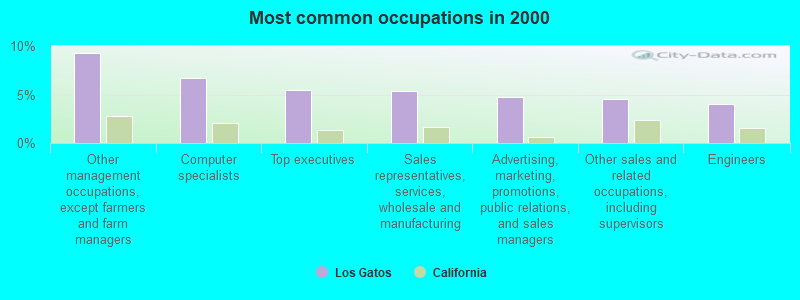
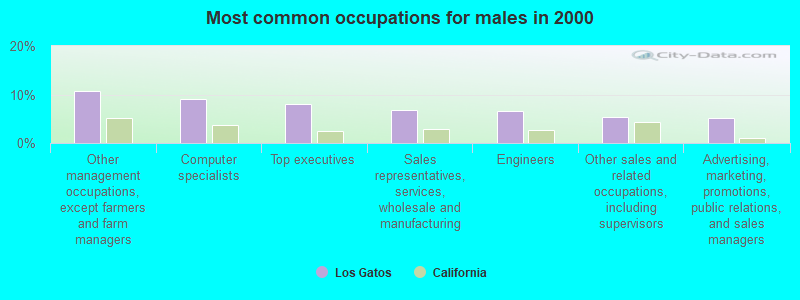
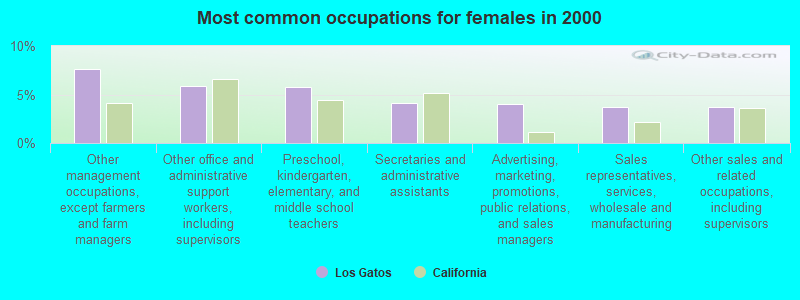
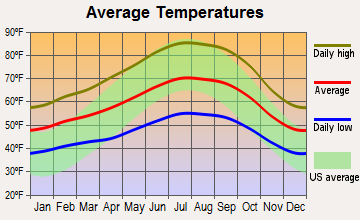
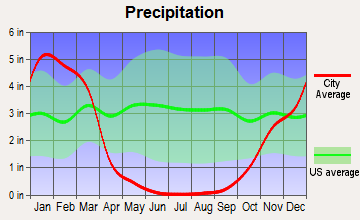
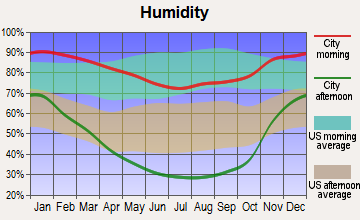
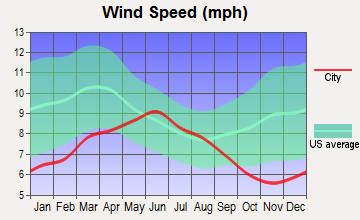
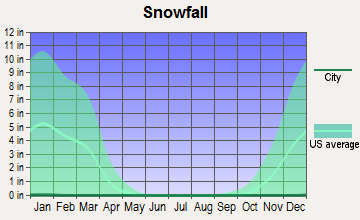
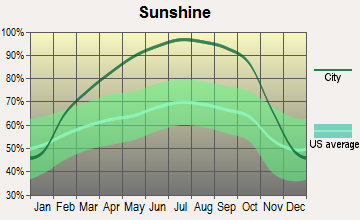
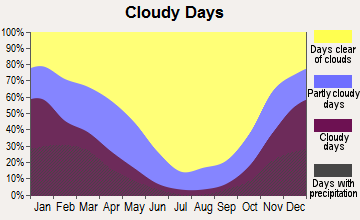


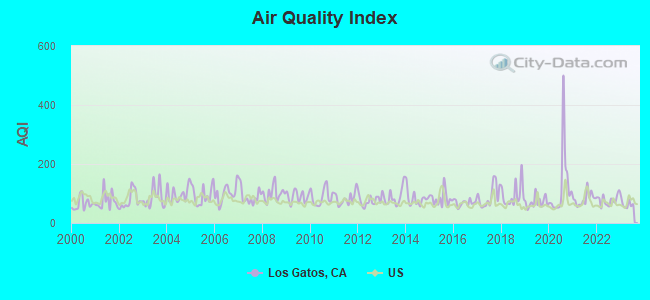
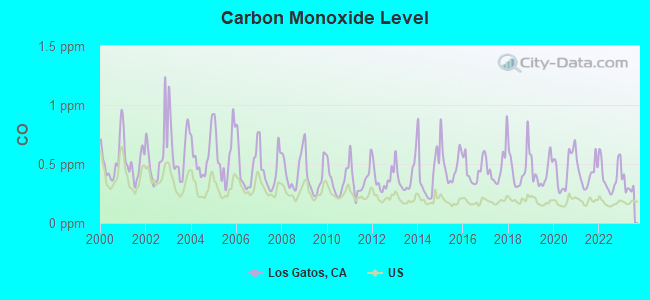
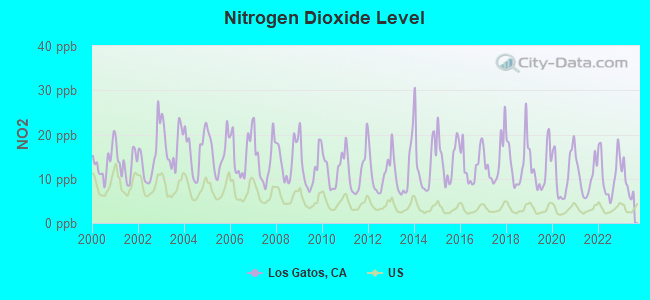
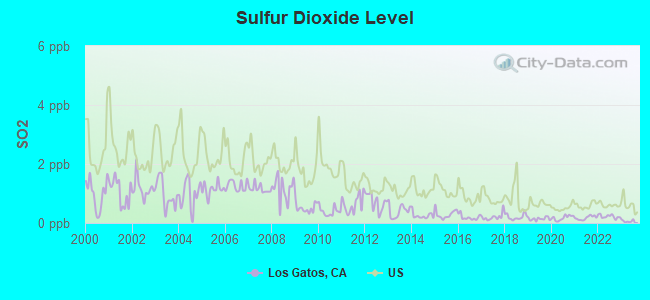
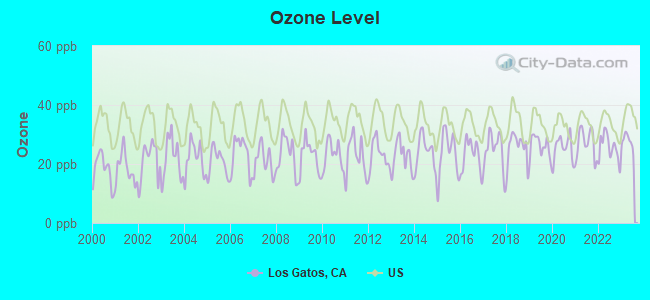
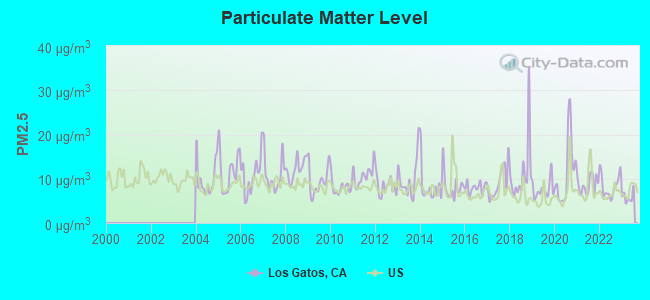
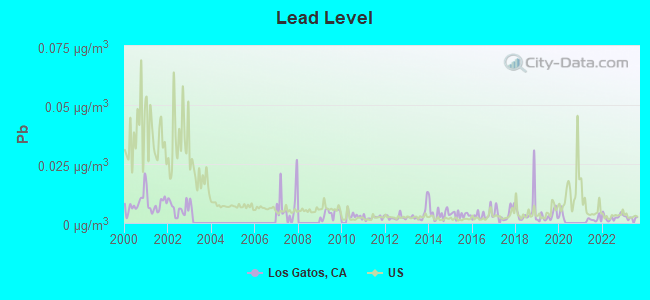

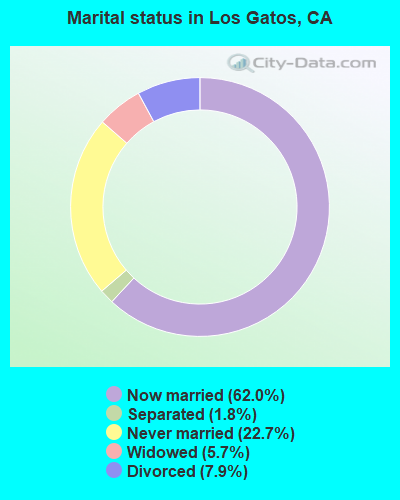
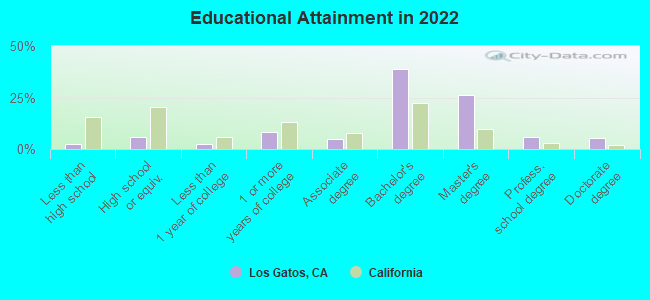
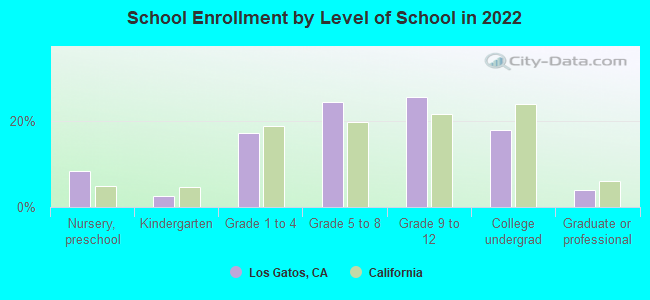
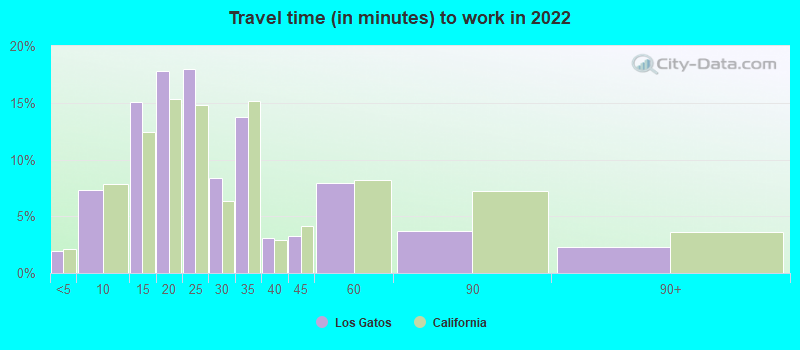
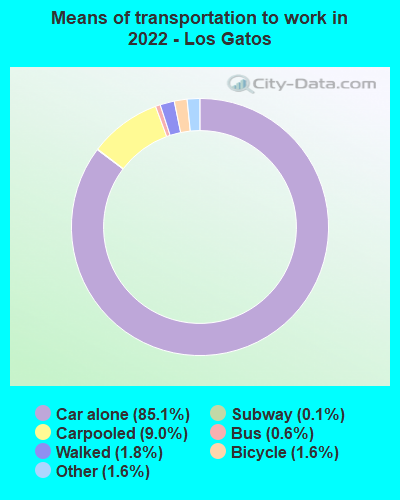
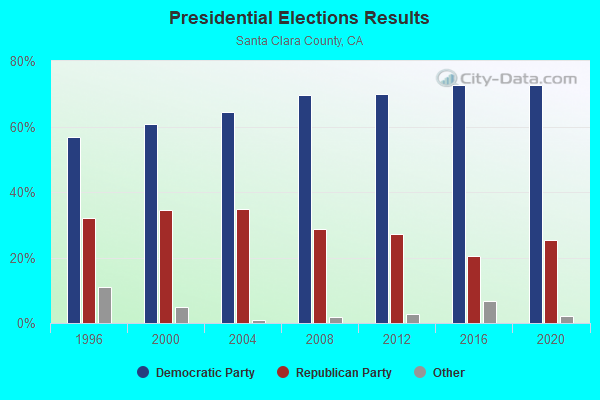
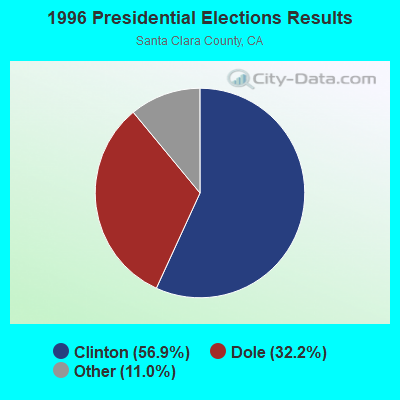
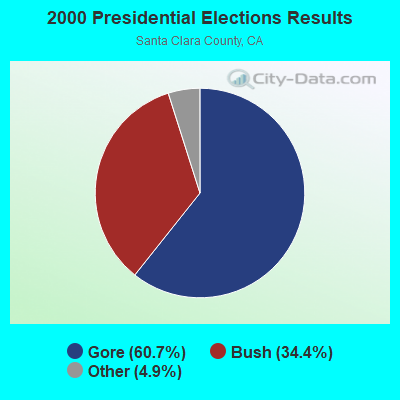

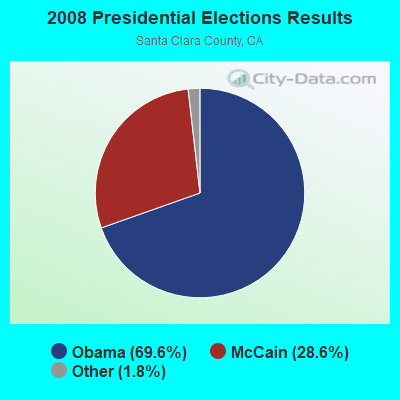
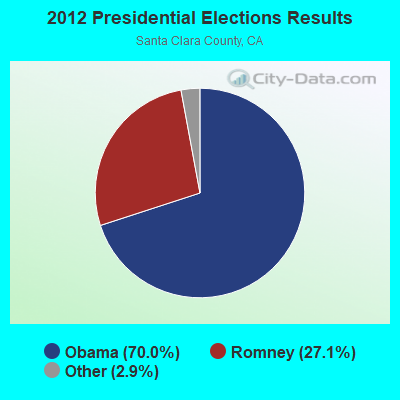
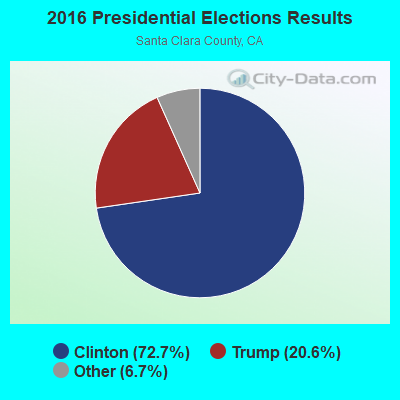
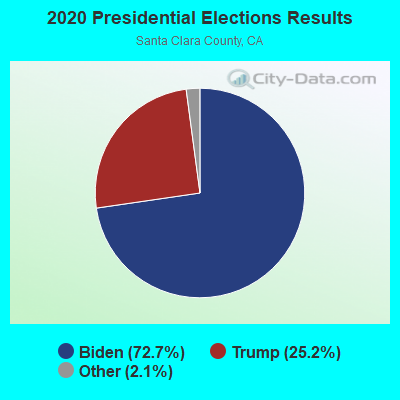
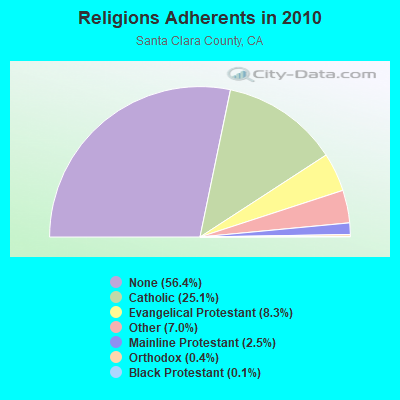
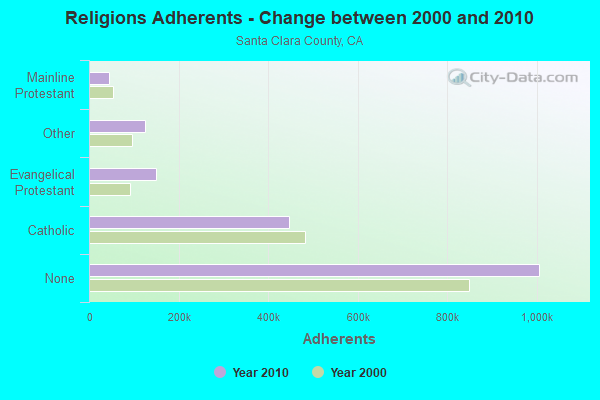
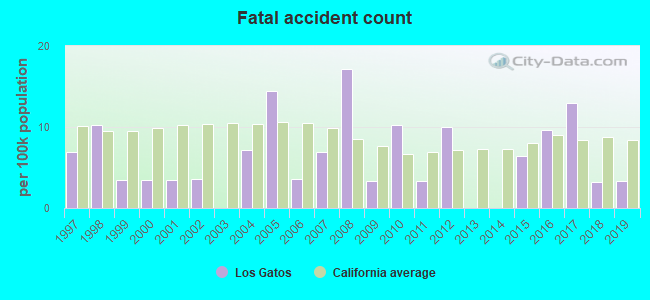
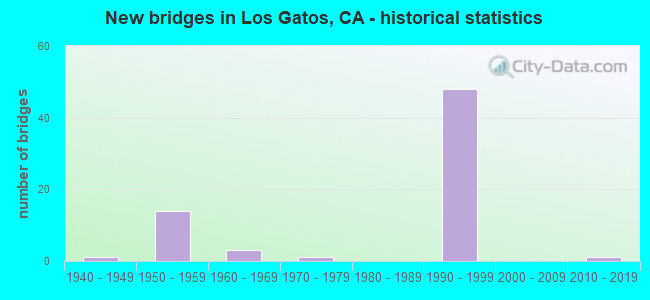
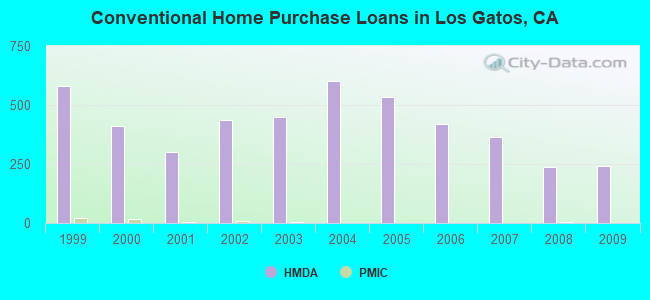
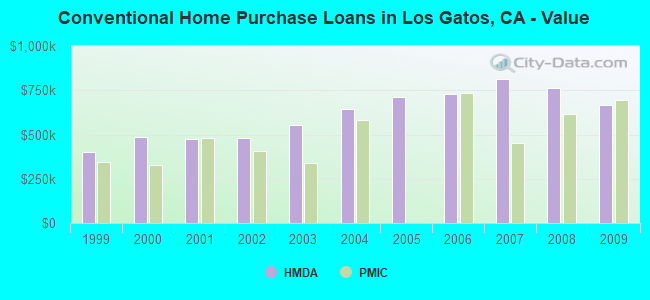
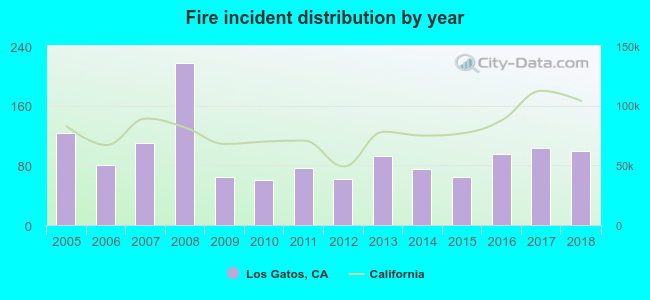 According to the data from the years 2005 - 2018 the average number of fire incidents per year is 94. The highest number of reported fire incidents - 217 took place in 2008, and the least - 60 in 2010. The data has a decreasing trend.
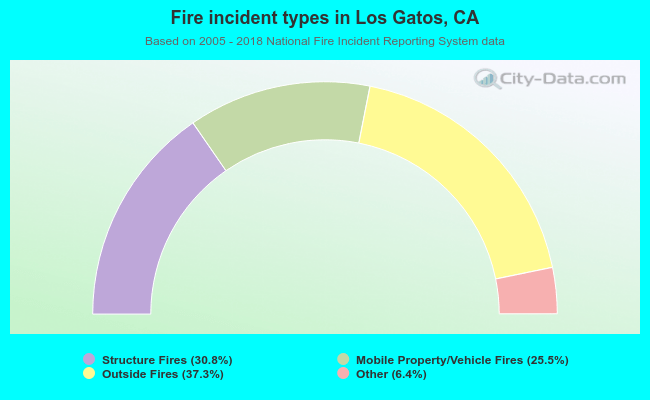 When looking into fire subcategories, the most incidents belonged to: Outside Fires (37.3%), and Structure Fires (30.8%).