Clermont, New York (NY) Poverty Rate Data
Information about poor and low-income residents

Recent posts about poverty in Clermont, New York on our local forum with over 2,400,000 registered users:
 | smaller Upstate NY cities and towns/African American communities (5948 replies) |
| Speed camera revenue could help end Nassau wage freeze (21 replies) |
| The Condos at Navy Green affordable housing lottery (253 replies) |
| 7 Clermont Building Lottery (29 replies) |
| New addition to the family thinking of leaving NYC (90 replies) |
| why do people move back up north after moving down south? (841 replies) |
11.2% of Clermont, NY residents had an income below the poverty level in 2022, which was 27.6% less than the poverty level of 14.3% across the entire state of New York. Taking into account residents not living in families, 20.1% of high school graduates and 38.6% of non high school graduates live in poverty. The poverty rate was 8.1% among disabled males and 8.0% among disabled females. The renting rate among poor residents was 42.6%. For comparison, it was 22.5% among residents with income above the poverty level.
Poverty rates in Clermont, NY
Residents with income below the poverty level in 2022:
Residents with income below 50% of the poverty level in 2022:
Poverty rate among disabled males:
Poverty rate among disabled females:
Renting rate in this town among poor and not poor residents:
| Clermont: | 11.2% |
| Whole state: | 14.3% |
| Clermont: | 4.9% |
| Whole state: | 7.4% |
Poverty rate among disabled males:
| Clermont: | 8.1% |
| New York: | 18.1% |
Disability rate in this town among poor males (it is 15.6% among male residents who are not classified as poor):
| Clermont: | 18.5% |
| New York: | 29.6% |
Poverty rate among disabled females:
| Clermont: | 8.0% |
| New York: | 23.0% |
Disability rate in this town among poor females (it is 14.2% among female residents who are not classified as poor):
| Clermont: | 10.3% |
| New York: | 31.0% |
Renting rate in this town among poor and not poor residents:
| Residents below poverty level: | 42.6% |
| Residents above poverty level: | 22.5% |
Poverty by age in Clermont, NY
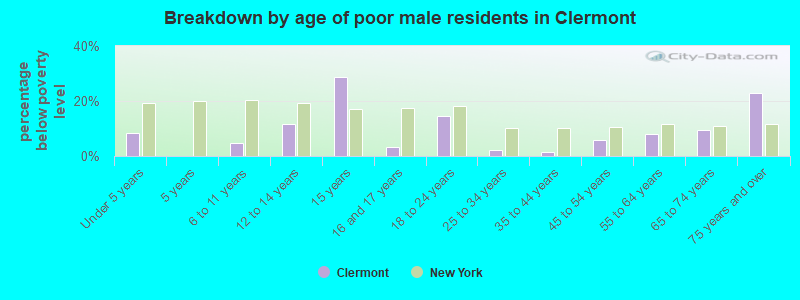
- Breakdown by age of poor male residents in Clermont,NY (percentage below poverty level)
- 8.5%Under 5 years
- 0.0%5 years
- 4.6%6 to 11 years
- 11.6%12 to 14 years
- 28.6%15 years
- 3.1%16 and 17 years
- 14.5%18 to 24 years
- 2.4%25 to 34 years
- 1.6%35 to 44 years
- 5.8%45 to 54 years
- 8.0%55 to 64 years
- 9.6%65 to 74 years
- 22.9%75 years and over
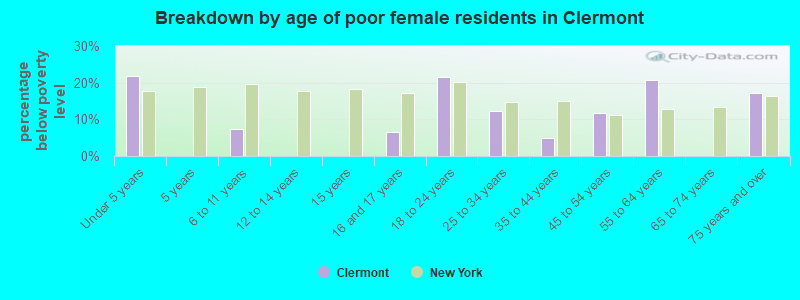
- Breakdown by age of poor female residents in Clermont,NY (percentage below poverty level)
- 21.7%Under 5 years
- 0.0%5 years
- 7.5%6 to 11 years
- 0.0%12 to 14 years
- 0.0%15 years
- 6.7%16 and 17 years
- 21.5%18 to 24 years
- 12.4%25 to 34 years
- 5.0%35 to 44 years
- 11.8%45 to 54 years
- 20.8%55 to 64 years
- 0.0%65 to 74 years
- 17.2%75 years and over
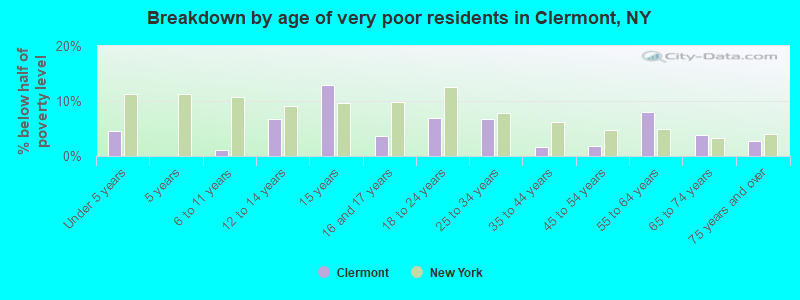
- Breakdown by age of very poor residents in Clermont,NY (% below half of poverty level)
- 4.5%Under 5 years
- 0.0%5 years
- 1.1%6 to 11 years
- 6.7%12 to 14 years
- 12.8%15 years
- 3.6%16 and 17 years
- 7.0%18 to 24 years
- 6.7%25 to 34 years
- 1.6%35 to 44 years
- 1.7%45 to 54 years
- 8.0%55 to 64 years
- 3.9%65 to 74 years
- 2.7%75 years and over
Poverty by race and place of birth in Clermont, NY
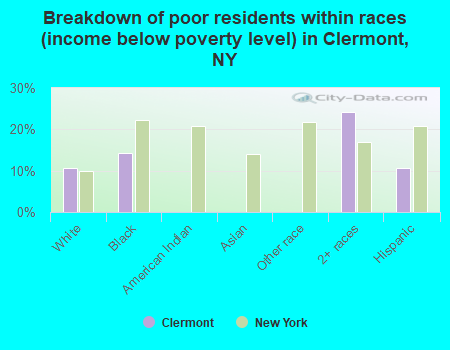
- Breakdown of poor residents within races in Clermont, NY (%)
- 10.6%White
- 14.2%Black
- 0.0%American Indian
- 0.0%Asian
- 0.0%Other race
- 24.2%2+ races
- 10.7%Hispanic
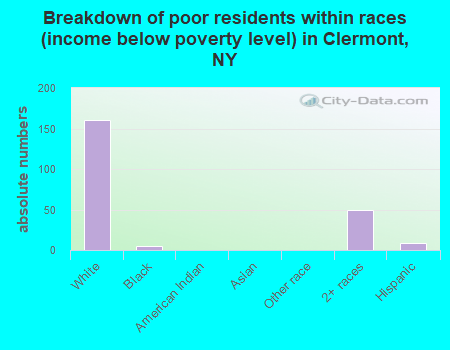
- Breakdown of poor residents within races in Clermont, NY (absolute numbers)
- 160White
- 5Black
- 0American Indian
- 0Asian
- 0Other race
- 502+ races
- 9Hispanic
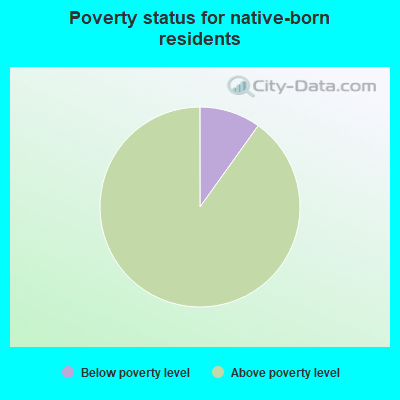
- 9.9%Below poverty level
- 90.1%Above poverty level
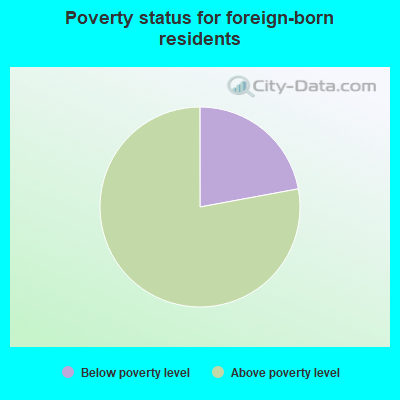
- 22.1%Below poverty level
- 77.9%Above poverty level
Poverty in families in Clermont, NY
Children below poverty level:
| Clermont, New York: | 9.3% |
| State: | 18.5% |
Poverty rate among high school graduates not in families:
| Clermont: | 20.1% |
| New York: | 18.3% |
Poverty rate among people who did not graduate high school not in families:
| Clermont: | 38.6% |
| New York: | 44.0% |
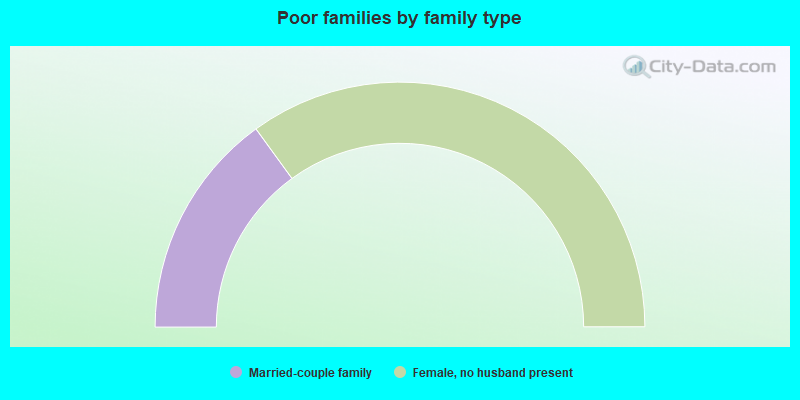
- 30.0%Married-couple family
- 0.0%Male, no wife present
- 70.0%Female, no husband present
Other data
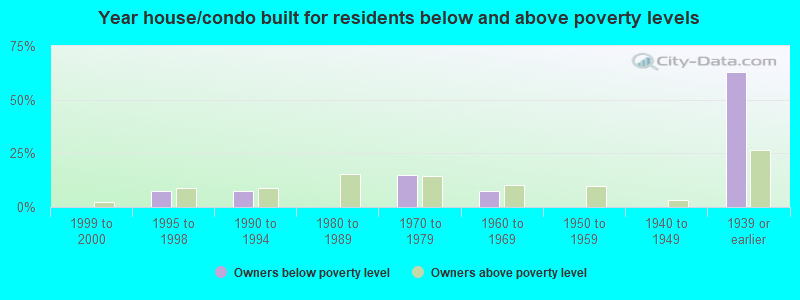
- Owners below poverty level
- 0.0%1999 to 2000
- 7.4%1995 to 1998
- 7.4%1990 to 1994
- 0.0%1980 to 1989
- 14.8%1970 to 1979
- 7.4%1960 to 1969
- 0.0%1950 to 1959
- 0.0%1940 to 1949
- 63.0%1939 or earlier
- Owners above poverty level
- 2.1%1999 to 2000
- 8.7%1995 to 1998
- 9.0%1990 to 1994
- 15.6%1980 to 1989
- 14.7%1970 to 1979
- 10.2%1960 to 1969
- 9.7%1950 to 1959
- 3.3%1940 to 1949
- 26.7%1939 or earlier